


 Arguments


Recent Comments
Prev 1795 1796 1797 1798 1799 1800 1801 1802 1803 1804 1805 1806 1807 1808 1809 1810 Next
Comments 90101 to 90150:
-
Harry Seaward at 22:39 PM on 13 April 2011How I lived through a carbon tax and survived to tell the tale
Dan @ 199 How was more than 100% returned? Where did the "extra" come from? -
mspelto at 22:39 PM on 13 April 2011Zebras? In Greenland? Really?
If we are worried about the Greenland Ice Sheet and Arctic Sea Ice the spectacular and significant changes in both have all occurred in the last decade, that is why the last decade is the key. It is the outlier and that is why the last decade has seen these historic responses in both sea ice cover and ice sheet behavior. If this decade was similar to others those large cryospheric indicators would have responded in kind. -
Harry Seaward at 22:27 PM on 13 April 2011How I lived through a carbon tax and survived to tell the tale
Marcus @ 209 Impediments galore exist in the legal world. Most of the alternative energy projects in the US are caught up in permitting red tape and lawsuits. Most of the opposition comes from "green" groups and their illogical not in my backyard attitude. -
Marcus at 22:22 PM on 13 April 2011How I lived through a carbon tax and survived to tell the tale
"I'm curious to know which "ideology" I'm supposed to have" I was referring to your [snip] pro-fossil fuel ideology. "I concentrate on Iceland because it is a perfect benchmark for me, since everything converges to make it an ideal case. If it has *not* been achieved there, where the hell do you think it will be ?" As I've said, Iceland is still on track to achieve a fossil free future by 2050. If they can achieve it, with such a small population & specialized economy, then larger more diversified economies should be able to achieve that goal *even quicker*. Unfortunately we're still being impeded by vested interests. "Actually, the reality is just the opposite, but you may need to refresh some historical facts : http://en.wikipedia.org/wiki/John_D._Rockefeller" You are *aware* that oil prices in the US were strictly controlled in the US, by government policies, right up until the end of WWII? By contrast, coal-fired electricity cost more than $2 per kw-h to generate (in today's money) back at the end of the 19th century. It took close to 50 years to get the prices closer to those we enjoy today. Cars were a very expensive luxury item when they were first put onto the market. It took many decades for them to become affordable for *all* people. The same is true of the first TV's. So in truth, with the exception of oil, my claim holds very true. "No - it is simply a proof that a rich country can make some advertising on "green technologies" on a very small scale, but quickly stops spending useless money when they're in deep economic trouble, and cannot afford anyway these expensive "danseuses", as we say in French." Did you even *read* the article you linked to? They haven't ditched the scheme at all, its simply going a bit slower. The point is that it *proves*, in spite of your hand-waving, that it *is* possible to replace hydrocarbons with hydrogen for such things as fishing boats & buses & other heavy vehicles. That remains the case in *spite* of the financial crisis.Moderator Response: [Dikran Marsupial] inflamatory adjective snipped -
les at 22:15 PM on 13 April 2011The e-mail 'scandal' travesty in misquoting Trenberth on
72 Gilles "so which cross calibration do you propose now ?" Why not ask the satellite science team? They have some superb material explaining cross calibration. http://www.acrim.com/ e.g. Hint: real scientists let the team managing the devices / experiments provide the results 'cos they understand the data.
-
Marcus at 22:08 PM on 13 April 2011How I lived through a carbon tax and survived to tell the tale
OK Gilles, I'm going to explain things s-l-o-w-l-y, so that even *you* can understand. I made it abundantly clear, time & again, that I was *not* talking about what is *currently* being done, but what can *potentially* be done-here & now. From my extensive reading on the subject, there are a number of inescapable facts: 1) There is *currently* no technical or economic impediment to making a transition to a 100% renewable energy electricity grid (& yes that includes hydro). The only impediments or political inertia & the overwhelming power of the fossil fuel lobby. 2) There is *currently* no technical or economic impediment to making a transition of our transport network to a mixture of hydrogen, electric & bio-diesel. 3) There is currently no technical or economic impediment to making our industrial sector 100% *Carbon Neutral* Now this conclusion is based, not just on reading material from Green Groups, but from reading Science & Technology magazines & the reports of hard-nosed energy & economic organizations (like the EIA). The transition won't happen overnight but, as long as vested interests don't get in the way, it is entirely possible to achieve these goals in about 20 years-probably less time in developing nations where a pre-existing energy network doesn't already exist. Now, unless you can provide *evidence* to prove my above claims wrong, then I'm probably just going to ignore any of your future hand-waving rants. -
Alec Cowan at 22:02 PM on 13 April 2011The e-mail 'scandal' travesty in misquoting Trenberth on
@#73 Cross calibration! Good joke! To oversimplify it (but nothing essential is lost) A - B = C You say "look A, there are different As, so C must be wrong -especially because I don't like C-" The right way to make a critical analysis: "What 'A' Trenberth et al used? How are the error margins dealt in the whole equation?" Your way "Why don't you lose your time replying about technical details related to the inkblot image unrelated to the topic that I placed?" You're pretty transparent, pal! -
Bern at 21:54 PM on 13 April 2011Waste heat vs greenhouse warming
I'm puzzled, RSVP. What mechanism do you propose that: a) captures waste heat from human activities, allowing it to accumulate over centuries, while allowing 'waste heat' from solar heating (which is about 10,000 times greater) to escape to space; and b) prevents the warmed air in that bottom 1000 feet of atmosphere from rising & mixing with the colder air above, as hot air tends to do? (ever see a thunderstorm?) Here's an important question for you. If there is some mechanism that traps waste heat over long periods of time, and it only takes 10 days' worth of solar input to provide enough heat to raise air temperatures by 30ºC - why is the bottom 1000 feet of the Earth's atmosphere not a plasma at millions of degrees? After all, the sun has been pumping that heat into the atmosphere for literally hundreds of billions of days. Unless the waste heat from human activity is some new kind of heat that behaves in a completely different fashion from the heat resulting from solar input, then you have to contend with that four orders of magnitude difference thing. -
Gilles at 21:47 PM on 13 April 2011The e-mail 'scandal' travesty in misquoting Trenberth on
Alec, you're right, that's the last version including most recent SORCE data (in red)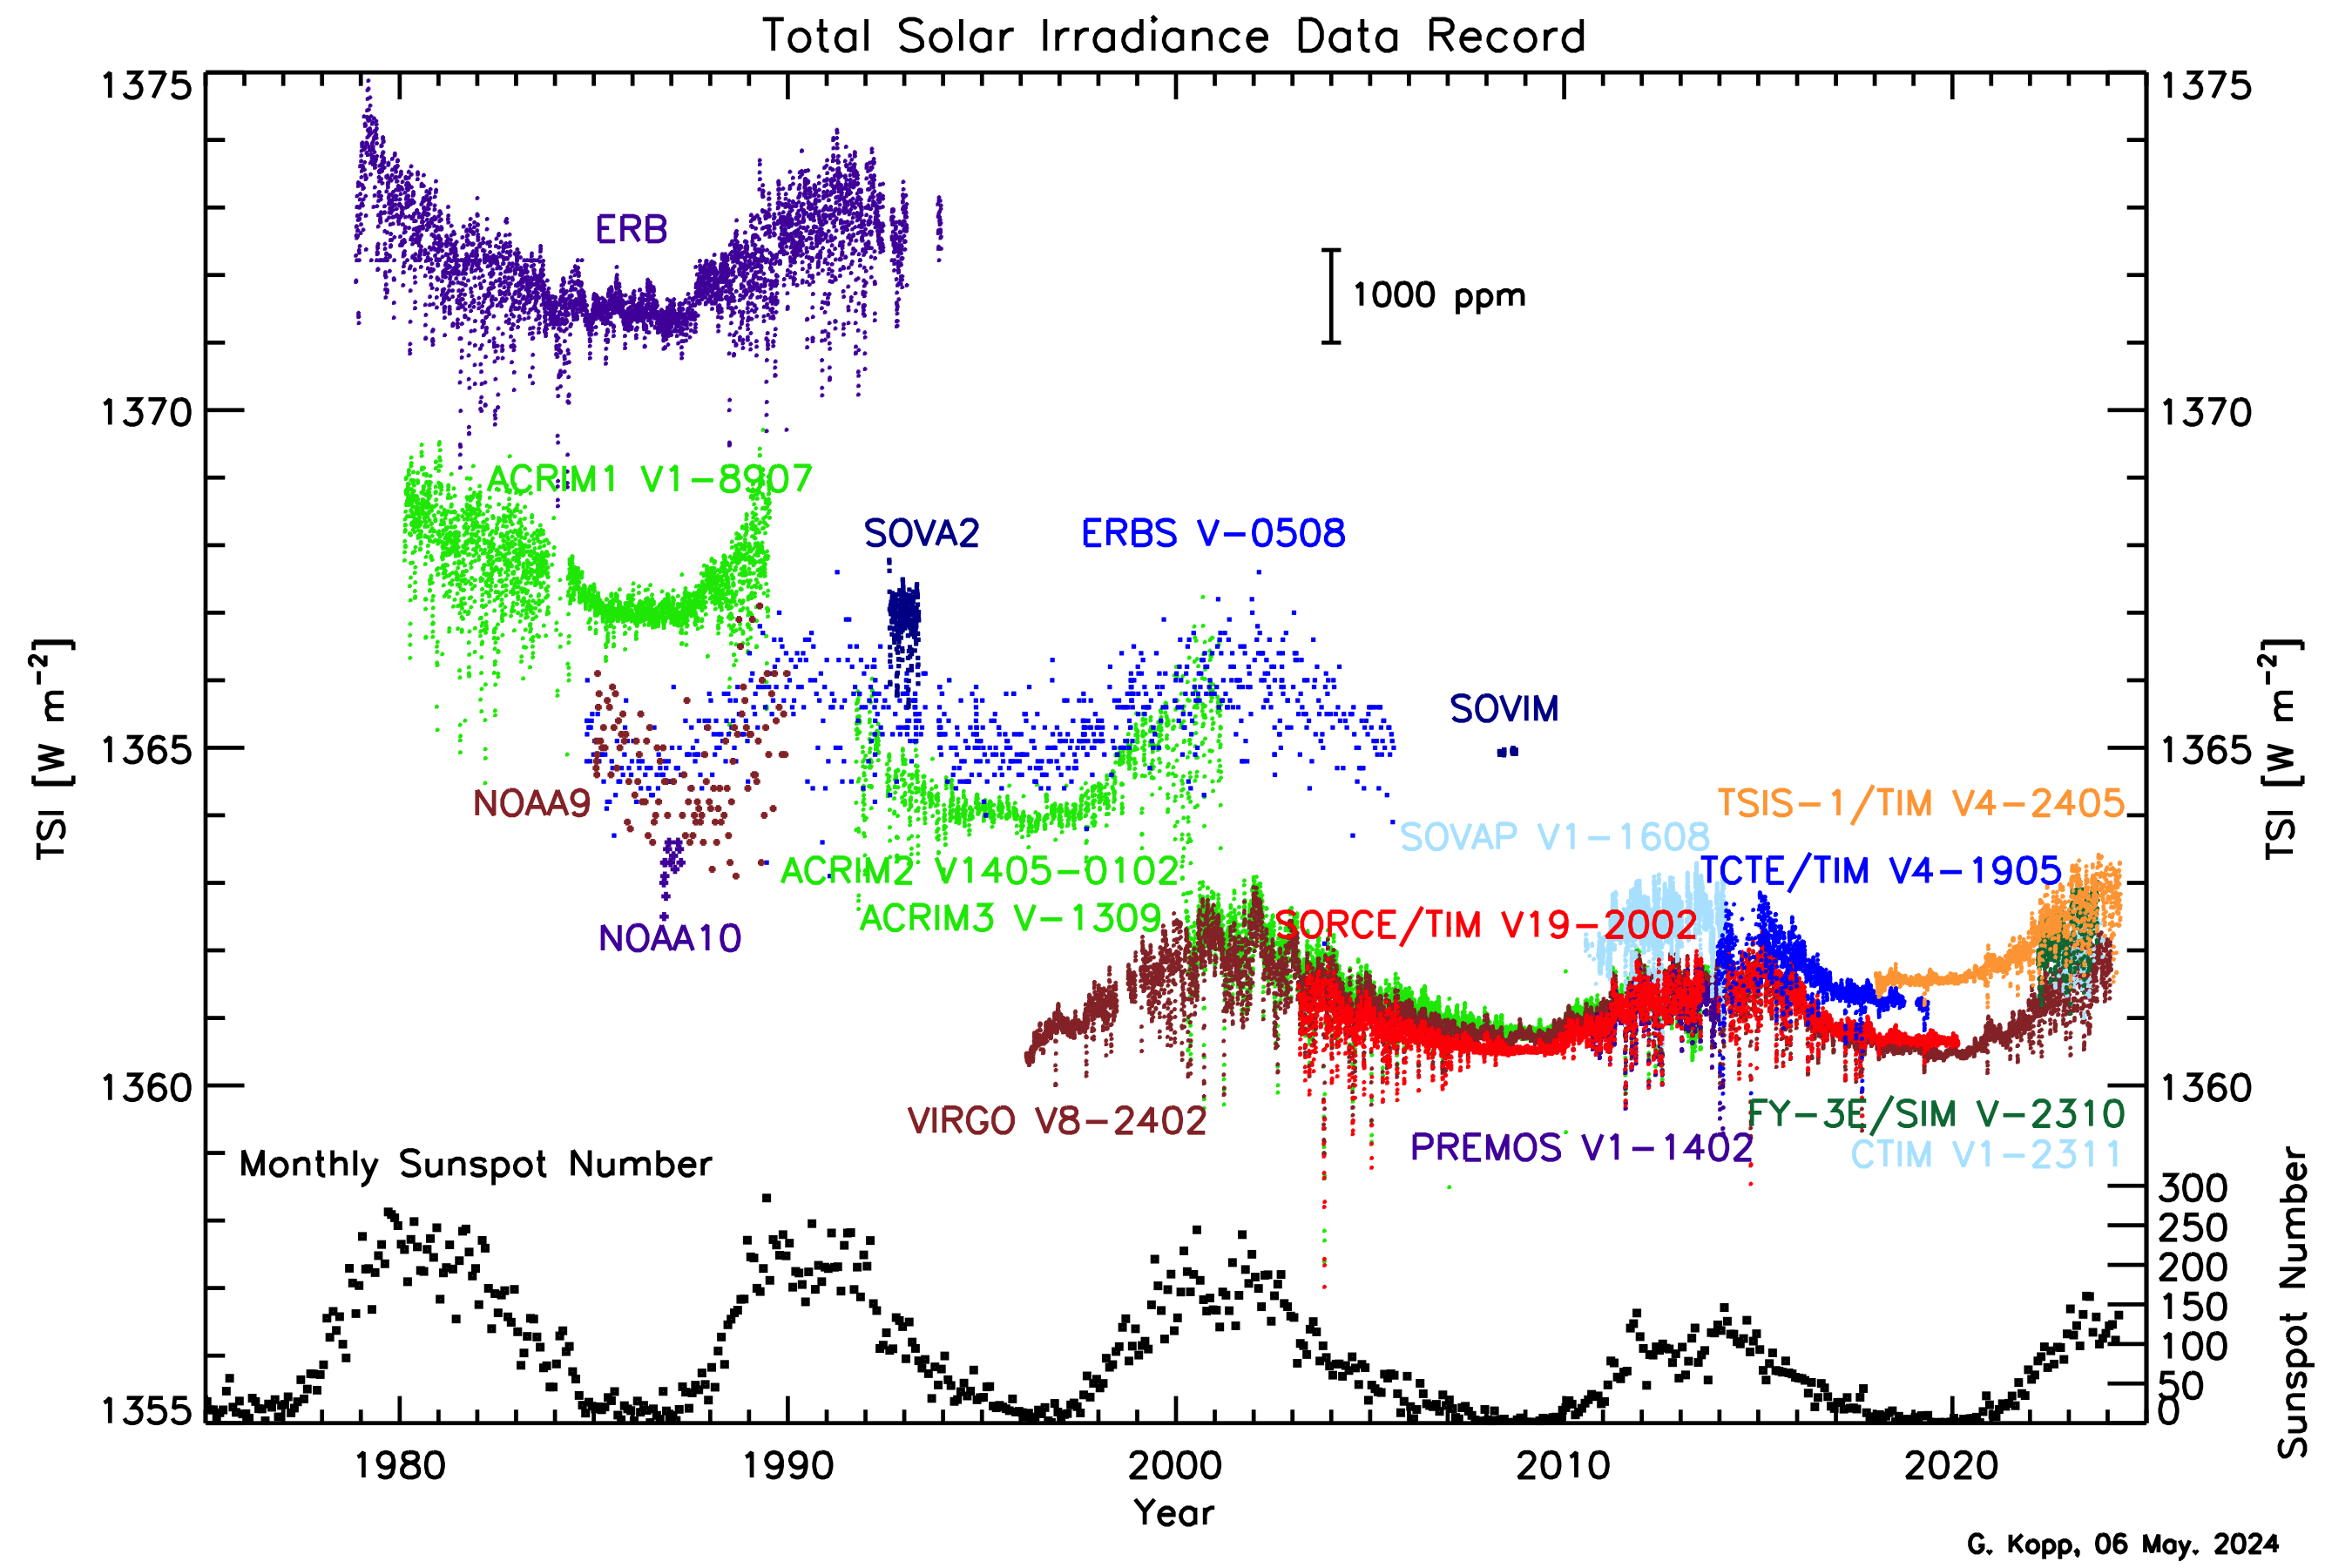 so which cross calibration do you propose now ?
-
Eric (skeptic) at 21:46 PM on 13 April 2011Solar Hockey Stick
#42, CBDunkerson, aside from GHG, the cooling stratosphere comes from lack of large volcanoes and from lowered solar UV (and thus ozone) during the solar minimum. Warming at night is partly from UHIE contamination, although some is GHG warming and some is weather. As for the rest of this thread, it is the rather typical divide and conquer approach: no correlation to cosmic rays over on one thread, no correlation to TSI on another thread, volcanoes on yet another thread. There are many examples here, e.g., /global-warming-early-20th-century.htm that simply use TSI for the complete depiction of solar activity in the late 20th century. Likewise this paper: http://www.agci.org/dB/PDFs/10S1_LGray_SolarInfluencesCLimate.pdf which concludes that GHG forcing is primarily responsible for late 20th century warming. The paper is interesting though in that it explains (and then ignores) many effects of solar activity on weather (the weather that causes part of the increase in nighttime warming, affects stratospheric temperatures, etc). -
Alec Cowan at 21:40 PM on 13 April 2011The e-mail 'scandal' travesty in misquoting Trenberth on
Why Gilles provides a lot of heterogeneous raw data from assorted dated technologies and a 1978-2001 period in #61? Is is to contrast Trenberth's 0.9W/m2 for a 2000-2004 period? Placing a figure out of context and conducting a sort of guided Rorschach Inkblot text with the height of the figure playing the role of "error margins" and the proposed reality check being the same units are used, isn't it sort of talking of ectoplasmic bodies in this photos? -
Ken Lambert at 21:35 PM on 13 April 2011The e-mail 'scandal' travesty in misquoting Trenberth on
Gilles #68 Interestingly enough, the SORCE people (check their website) also produced their version of the famous Trenberth energy flow diagram which is quite different to Dr Trenberth's. If the TSI of 1361 W/sq.m at TOA was right then incoming Solar radiation would drop by the difference of 4.5W/sq.m divided by 4 at TOA = 1.13W/sq.m and taking an overall albedo of 0.7 would see a reduction of incoming solar radiation of about 0.8W/sq.m. This is significant in comparison with the claimed 0.9W/sq.m imbalance. -
CBDunkerson at 21:09 PM on 13 April 2011More wind, bigger waves, changing marine ecosystems
Interesting article all around. If the trends shown and correlation to global warming continue to prove out with further analysis then these changes will have dozens of obvious impacts (e.g. need for higher sea walls, stronger waves breaking up sea ice more, more wind and wave power, increased sea sickness, changes to migration patterns, et cetera) and likely hundreds of others we haven't begun to think of yet. -
les at 20:59 PM on 13 April 2011There is no consensus
It is extraordinarily how these allegations of corruption get made despite the evidence to the contrary. The Cuccinelli witch hunt went no where - despite having huge financial and legal resources at their disposal. Not only that, be even Steve McIntyre said that corruption was not the issue (not that his allegations of misconduct where upheld either). The fact is, when there is a perfectly good paper-trail (as all public funding bodies maintain) available and when nothing is found despite huge investigative effort... one has to conclude that there is neither smoke nor fire. -
CBDunkerson at 20:50 PM on 13 April 2011Solar Hockey Stick
shawnhet: "IMO, there are way too many correlations btw solar proxies and climate" How do you square that opinion with the dis-correlation cited in the article? That is, "...TSI has not increased over the past 50+ years. During this time the surface temperature has increased approximately 0.6°C." IF solar effects and global climate were as tightly bound as you claim this discrepancy should be impossible. Further, if the Sun were responsible for recent warming there would be different 'fingerprints'. Neither a direct increase in TSI nor any of the 'cosmic ray' theories would cause more pronounced warming at night or stratospheric cooling. Yet those effects have been observed. Indeed, I've never seen a single skeptic even try to challenge (or address) those observations. How do you explain the fact that the pattern of the observed warming directly contradicts what you claim to be its cause? -
Gilles at 20:25 PM on 13 April 2011The e-mail 'scandal' travesty in misquoting Trenberth on
actually DM, it is unclear for me what you call "very much lower true uncertainty" : what is your claim about the absolute uncertainty due to systematics in the plot I've showed ?Moderator Response: [Dikran Marsupial] Sorry, that is just trolling. My point has been made perfectly clearly, the difference between ACRIM and PMOD composites is a good indication of the residual uncertainty. I made that point in response to your initial use of the plot here. -
Bruce Frykman at 20:25 PM on 13 April 2011There is no consensus
[complaint about moderation snipped]Moderator Response: [Dikran Marsupial] Please read the comments policy, posts that contravene the comments policy are likely to be deleted. Of course moderators being only human sometimes miss comments that should be moderated (although the one you point out is not acturally an ad-hominem). This is more likely to happen if we have to spend all our time deleting repeated complaints about the moderation here. Keep on-topic and observe the comments policy and your comments won't be deleted. It isn't as if you have not been warned more than once before. -
Gilles at 20:11 PM on 13 April 2011Arctic Ice March 2011
nobody interested in the Nares strait and Lincoln sea anymore? looking for another more interesting "place of the month" ?Moderator Response: [Dikran Marsupial] Whatever happened to "wait and see". When there is news, if it is not posted here by others, there is no reason why you shouldn't post it yourself. If there is no news available, it is hardly surprising there is no discussion. Just for the record, I am interested, but have no news. -
Gilles at 20:01 PM on 13 April 2011The e-mail 'scandal' travesty in misquoting Trenberth on
I wasn't arguing specifically that the real uncertainty was that of the plot, it was just on purpose of illustrating how difficult it was to get absolute values.But again, cross calibration can be used to measure accurately * relative* variations but not absolute ones unless you have clearly identified the origin of systematics. So I think the plot is really illustrative of the order of magnitude of systematic uncertainties, they aren't much lower, and the story is far from being settled : see e.g. Kopp and Lean 2010, GRL 38 where the SORCE team claims a TSI around 1360.8 ± 0.5 W /m2, yet another 4.5 W/m2 lower ! and that's only the first part of the budget, as Ken Lambert reminded us : the outgoing LWR flux isn't better known.Moderator Response: [Dikran Marsupial] I didn't say that you were making that argument specifically, the data from the satelites in many places overlap, which means that the true uncertainty is very much lower. The fact that you are still blustering suggests a poor attitude to science. The reason we have peer-review in the journals is to moderate arguments to the point where they are properly robust. Some authors tend to ignore comments made in peer review, or pay lip-service to them or bluster. They generally write poor papers that get poorly cited as a result. Bluster in response to constructive criticism rings alarm bells when I am a reviewer, and isn't encouraging here either. I have made my point, if you don't want to improve the robustness of your argument that is your decision. -
Adam at 19:25 PM on 13 April 2011Zebras? In Greenland? Really?
Muoncounter, "than what? There are ample threads here, all with pointers to the relevant literature, explaining this process in detail."It should have warmed faster than the previous period of warming. Look, the fact that the 1920-1940 warming occurred at a faster rate, shows that other forces can also significantly effect Greenland's climate. It was obviously not CO2 that caused the previous period of warming. Yet it is supposedly co2, which is causing the current warming. Like I said, polar regions are especially sensitive. The increase in temperature should have occurred faster, if CO2 was the dominant driver of our climate.Could you please point out that papers you are referring to, which explains why Greenland warmed faster 60 years ago? Rob Honeycutt, "Really? Is that what we say? I would modify that to say "if there were no other forcings on the climate system..." then yes, you'd be right. But no one claims that CO2 is the only mechanism that affect climate. We only say that CO2 is the biggest control knob. "If so, could you please tell me what forcing caused the previous Greenland warming of 1920-1940? And could you also please explain why you don't think it could be that, which is causing the current Greenland warming?Dana, "Adam, I'm looking at my calendar right now, and it tells me the year is 2011. So I'm having a hard time understanding why you're unwilling to consider Greenland temperatures after 2000." You just don't get what I am trying to say. Yes I do accept that the years 2003 and 2010 were especially warm for Greenland's climate, hence causing the total temps to slightly exceed the 1930's, but it was for those two years only. Once again Dana, did you actually read the papers I provided?Now anthropogenic greenhouse gases supposedly started warming the global climate at around 1970 (right?) And Greenland is part of the global climate. Therefore, according to AGW the warming that occurred on Greenland must have been man made. (unless you accept that it could have been natural) Therefore, it means that for the 30 years, greenhouse gases were supposedly warming our climate, Greenland temperatures did not exceed what they were 60 years ago. Polar regions are especially sensitive, so therefore this data would contradict AGW. I really do suggest you read those papers."There's a word for that, we don't like to use it here, but it starts with the letter "d" and sounds like a river in Egypt." Dana I've not insulted you, so I can't see why you are trying to insult me.Dana and scaddenp, I will repeat my challenge to Rob, to both of you.mspelto "So the key climate data is that of the last decade. " No it's not. You have to look back at the decadal trends of the past century. What you need to do is look at previous periods of warming, and see whether the current one is similar to them, which as shown by the papers I provided and Dana's own graph, it is.Moderator Response: [DB] Off-topic portions struck out. For someone who claims to know how SkS works, insistence upon staying off-topic testifies to the opposite. -
les at 19:25 PM on 13 April 2011There is no consensus
(mods, I'd suggest deleting my 329 now as it really makes no sense as you deleted my re-response to 327!) my re-response only said - in short - I don't see how 327 substantiates the claims in 316 as it contains no evidence of corrupt public grant allocation or corrupt recruitment to publicly funded research positions...Moderator Response: [Dikran Marsupial] Cheers, that re-statement simplifies matters considerably! Any responses please note the first item of the comments policy. Unsubstantiated accusations of corruption are not acceptable. -
Gilles at 19:16 PM on 13 April 2011The e-mail 'scandal' travesty in misquoting Trenberth on
well I don't see your point. I used own Trenberth's quotes to remind that the energy budget wasn't well known and constrained by measurements, because it seemed to me that some people here overlooked that and misunderstood what Trenberth really meant - he really meant that that the sum of variations of energy content he could measure didn't match the theoretical expectations. And again , concluding that theory is right and that measurements miss one of the heat sinks is obviously only *one* possibility - the other obvious one being that theory is incomplete ! And I used the plot to illustrate how it is difficult to get an absolute value of the incoming TSI - obviously the relevant point is to compare the discrepancies between instruments to the required accuracy to test the imbalance - around 1W/m2. Things would have been quite different if it would have been a matter of several dozens of W/m2 for instance , but it is not. You can recalibrate each instrument on the other, but always with an overall systematic uncertainty on the absolute value - because you don't know of course which one is *really* right.Moderator Response: [Dikran Marsupial] The point is that the important uncertainty is the residual uncertainty after eliminating the uncertainties that can be properly eliminated by cross-calibration. Hence the plot you used overstated the uncertainties involved. I don't understand your reluctance just to accept that point and sharpen the presentation of your argument. -
Icarus at 19:11 PM on 13 April 2011Solar Hockey Stick
All the skeptical arguments which attempt to get CO2 'off the hook' share the same problem - i.e. if there was another factor causing a large positive forcing then we would be seeing much more warming than we actually do. Disputes about TSI or cosmic rays aren't going to change the radiative properties of CO2. My understanding is that we know the climate forcing from CO2 to an accuracy of less than 1%, and nothing we discover about other natural factors is going to change that. The expected warming resulting from that forcing is less certain, because it is a function of climate sensitivity, but that applies equally to other forcings such as TSI. It's not possible to argue that the sun is causing the current warming without also denying the radiative properties of CO2, which would be absurd. -
Gilles at 19:04 PM on 13 April 2011How I lived through a carbon tax and survived to tell the tale
"There already exists perfectly feasible substitutes for oil, but its going to take time to make the switch-the fact that you continue to choose *not* to accept that such a switch is possible only speaks to your ideological-based blindness on this matter." I'm curious to know which "ideology" I'm supposed to have - it's just a matter of productivity of liquids hydrocarbons, you know. You can check that it has been used by *every* ideology, religion, or culture. Just take the list of main oil producers in the world, this is enough to see that oil is used by all industrial societies, totally irrespective of any ideological or cultural origin: Saudi Arabia Russia (former Soviet union) USA Mexico Iran Canada Nigeria Brazil "A) it is possible when non-intermittent and steerable hydro and geothermal power is available - otherwise, it's just wishful thinking up to now." Well, so you keep on claiming, but you've not exactly been too upfront with too much *evidence* to prove your point"" Marcus I am not *claiming* anything, I'm *asking* you if there is a country whose electrical grid is mainly power by non-hydro , renewable sources. It is not a *claim*, it is a *question*. Do you understand your own language ? I'm really curious to know which ideological common feature you can find between all these countries ... B) "....and, yet again, you've provided *no proof* that they aren't economically feasible. " Again, I'm not trying to prove anything. I'm asking you to explain why, if you think it is possible, it has never been achieved anywhere, even in the most favorable cases. I concentrate on Iceland because it is a perfect benchmark for me, since everything converges to make it an ideal case. If it has *not* been achieved there, where the hell do you think it will be ? "The reality is that *no* source of energy was, at its outset, economically feasible-but that didn't stop them being adopted." Actually, the reality is just the opposite, but you may need to refresh some historical facts : http://en.wikipedia.org/wiki/John_D._Rockefeller For electric furnaces , i repeat : we don't know how to reduce economically iron oxide without carbon - and that's true even in electric furnaces. If you want to produce the current steel production with charcoal - do it. Good luck. "C) "well, not bad ... what do you think is the growth rate ?" Totally irrelevant. Those numbers were from 2 years back, & are simply *proof* that it *is* possible to substitute oil for our transportation needs & that, as the infrastructure is put in place, that substitution will continue apace. " No - it is simply a proof that a rich country can make some advertising on "green technologies" on a very small scale, but quickly stops spending useless money when they're in deep economic trouble, and cannot afford anyway these expensive "danseuses", as we say in French. http://www.eenews.net/public/climatewire/2009/07/01/1Moderator Response: [Dikran Marsupial] Please can both sides steer clear of discussion of ideology. Many thanks in advance. -
Bruce Frykman at 18:56 PM on 13 April 2011There is no consensus
This is index number 329Moderator Response: [Dikran Marsupial] There has been some deleting of posts that contravene the comments policy, but some replies to those comments may still be present. Please can we all re-start the discussion in a more moderate impersonal tone, and try to keep on-topic. -
Dikran Marsupial at 18:44 PM on 13 April 2011Waste heat vs greenhouse warming
RSVP@366 Sorry RSVP, you can't ignore observations that refute your theory by saying there are "just a bump in the road". If the warming is due to waste heat, the warming would be highest were it is generated and would be less the further away from where it is generated as the heat diffuses out. The faster rate of warming in the Arctic than elsewhere directly refutes that theory. [incorrect P.S. snipped] -
RSVP at 18:32 PM on 13 April 2011Waste heat vs greenhouse warming
Bibliovermis 365 "You are still wrong and no amount of repetition of your misconceptions will make them correct" It doesnt matter if I am wrong, in the sense that the waste heat that is accumulating doesnt care if you are right or I am wrong. No amount of beautiful theories about GHG is going to stop it. Anyone really paying attention will start looking for a good place to live. In the end, (as as always) its going to be every man for himself. -
Gilles at 18:29 PM on 13 April 2011How I lived through a carbon tax and survived to tell the tale
[snip]Moderator Response: [Dikran Marsupial] Gilles, Marcus made many substantive points in his post that you could usefully address, notably provision of evidence, rather than concentrating on a (now moderated) inflamatory throw-away line at the end. Please do so, so that I don't need to waste any more of my time moderating your inflamatory responses. -
RSVP at 18:26 PM on 13 April 2011Waste heat vs greenhouse warming
DM 364 You might want to browse here: http://www.epa.gov/heatisld/ ...where it says, "In the evening, the difference can be as high as 22°F (12°C)." Are you telling me that temperatures are over 12°C in the Artic? I doubt it. Heat can only transfer from something warmer to something cooler, and will always tend to spread as well. So while you may have a local change, the net energy flow will always be towards the Artic, not from the Artic (assuming the Artic is an overall cooler place). On the otherhand, I will not deny an acute non linearity affecting temperature in polar region's if there is now water where before there was ice. This situation however is just a bump in the road as we are talking about "global" warming. -
Bruce Frykman at 18:25 PM on 13 April 2011There is no consensus
RE: les - 323 "Ammeter time in argumentation, I see. Make a vague statement that something ill defined doesn't exist and ask for it to be refuted? You will really have to raise your game if you want to engage here." Let us see if this one meets your profile: If "we" [excludes the power elite].... don't break "our" [your] "addiction to fossil fuels" [access to free energy markets], then "n years from now" [after we are all dead] the earth will experience a "feverish" temperature rise that "may" [or equally may not] be .6 C above "natural variability" [that we cannot hope to quantify]. Now "deniers" have never been able to disprove this wonderful scientific theory. Therefore AGW science is "settled" Help, the coulombs are melting my computer.Moderator Response: [muoncounter] Still have yet to see any actual evidence on any of these points. Forget the ammeter, worry about the credibility meter. -
Gilles at 18:15 PM on 13 April 2011The e-mail 'scandal' travesty in misquoting Trenberth on
DM : "evidence" of what ? I'm just reminding that the 0.9 W/m2 value is by no means the outcome of measurements - there is no "evidence" to justify or deny, it just that it hasn't been computed from experimental values, but from computer modeling, which has never been considered as experimental evidence in any field of science I know.Moderator Response: [Dikran Marsupial] You know perfectly well that the plot you gave was intended as evidence of the uncertainty in the energy budget. However, you were overstating your case by using raw measurements rather than cross-calibrated ones. The fact that you haven't simply admitted that and are still blustering speaks volumes. In science, the best approach is to present the strongest argument that the opposition cannot pick holes in, not just the strongest argument you can present. Why do you think Trenberth (and indeed the majority of climatologists) openly discusses the weak points in the science? -
Ken Lambert at 18:06 PM on 13 April 2011The e-mail 'scandal' travesty in misquoting Trenberth on
Gilles #63 Quite right. The CERES imbalnce is actually +6.4W/sq.m which is 'corrected' down to +0.9W/sq.m. There have been several threads on this site which discuss this 'imbalance' problem and the circular argument which rationalizes it to a 'measured +0.9W/sq.m. The 0.9W/sq.m comes from maths and modelling (Hansen 2005) and is reported in IPCC AR4 Fig2.4 (+1.6W/sq.m) *plus* Dr Trenberth's estimate of climate responses which sum to a total of (-0.7W/sq.m). +1.6 - 0.7 = 0.9W/sq.m -
MichaelM at 18:05 PM on 13 April 2011There is no consensus
Well Bruce @326, at least you seem to be in agreement with the main topic of this thread; there is scientific consensus on global warming. It is the orthodox position and if you are going to challenge it I suggest providing evidence. -
Bibliovermis at 17:58 PM on 13 April 2011Waste heat vs greenhouse warming
RSVP, We've been round & round on this back in October and before. You admitted that anthropogenic heat flux radiates just like solar heat flux does, but still insisted that anthropogenic heat accumulates. Trains and oranges and lakes, oh my! You are still wrong and no amount of repetition of your misconceptions will make them correct. Increasing the input will only cause a level increase if the output is restricted. -
Gilles at 17:45 PM on 13 April 2011The e-mail 'scandal' travesty in misquoting Trenberth on
DM : of course you can try to correct from systematics from each instruments, but this is notoriously difficult, and again Trenberth himself states very clearly that the 0.9 W/m2 number is *not* the outcome of precise measurements.Moderator Response: [Dikran Marsupial] All instrumental data is "imprecise" by definition, there are always sources of bias, drift and other calibration issues. These always need to be properly considered. Rejecting evidence because it is not the outcome of precise measurements is irrational, uncertain meaurements still contain information. In science, overstating the strength of your argument by inappropriate use of evidence is considered a bad thing. Investigating the ACRIM-v-PMOD difference and re-stating your argument based on less over-stated evidence would have been far more useful than the above bluster. Oh well, you can lead a horse to water... -
Marcus at 17:34 PM on 13 April 2011How I lived through a carbon tax and survived to tell the tale
@ Gilles. "and what is the point that oil is needed for transportation ? (but also for fishing for instance, and some left is used for heating where geothermal warmth is not available). Isn't transportation necessary for a modern economy ?" I keep on telling you, Gilles, but you keep on choosing *not* to listen-its a *very* annoying habit of yours. There already exists perfectly feasible substitutes for oil, but its going to take time to make the switch-the fact that you continue to choose *not* to accept that such a switch is possible only speaks to your ideological-based blindness on this matter. "A) it is possible when non-intermittent and steerable hydro and geothermal power is available - otherwise, it's just wishful thinking up to now." Well, so you keep on claiming, but you've not exactly been too upfront with too much *evidence* to prove your point. There are plenty of examples, across the globe, where various renewable energy technologies are *already* being used in a non-intermittent & steerable fashion. That's not wishful thinking, that's *here* & *now*-again, its only your ideologically based *blindness* that prevents you from seeing that (you'd much rather rely on fossil fuel industry propaganda). B) "again - you mix up technical feasibility and economical one - the issue is to replace them at no cost, for a given standard of living." ....and, yet again, you've provided *no proof* that they aren't economically feasible. Seriously, I might accept some of your more outlandish claims if you could provide even a *shred* of data to back up your claims-well, data from sources that aren't obviously fossil fuel industry propaganda (which, it seems, is all you bother to read). The reality is that *no* source of energy was, at its outset, economically feasible-but that didn't stop them being adopted. It took *decades* & many billions of dollars-in todays money-to get coal-fired electricity prices down, even to the level that fuel cells & renewable energy *started* at. However, your attitude seems to be that, no matter there starting cost, we should *never* ever switch to renewable energy-even though those starting costs are already competitive, with fewer subsidies, with fossil fuels. "Electric furnaces only oxidize carbon rich iron cast, or recycle already used metallic pieces, either by mixing them with iron cast, or by using carbon electrodes." Again, you've proven your inability to *read*. I never said otherwise. Funny, though, how more & more smelters are switching *away* from blast furnaces & towards arc furnaces. I guess you'd better tell them that they're *all wrong* to do that. "We don't know how to produce the current quantity of steel without coke." Again, so you keep claiming, but once again your claims are short on *facts*. As I've already said before, all you need is a substance that is as "willing"-if not more-to give up electrons to the metal oxide as carbon is. Not that I can see any reason why the carbon has to be fossil fuel based. I've already read about how they're using organic sources of carbon (like Biochar) to reduce metal oxides. Seems thats another claim thats short on actual fact, but long on ideology. C) "well, not bad ... what do you think is the growth rate ?" Totally irrelevant. Those numbers were from 2 years back, & are simply *proof* that it *is* possible to substitute oil for our transportation needs & that, as the infrastructure is put in place, that substitution will continue apace. [small snip]Moderator Response: [Dikran Marsupial] Please can we keep the discussion as impersonal and scientific as possible (whatever the perceived provocation). -
Dikran Marsupial at 17:12 PM on 13 April 2011Waste heat vs greenhouse warming
RSVP@363 So can you explain why the Arctic is warming faster than the industrialised regions that are actually producing the waste heat? -
Tom Curtis at 16:59 PM on 13 April 2011There is no consensus
Bruce Frykman @323, the correct suposition when a debater breaks up his opponents sentences line by line, or into even smaller fragments, as you do, is tht the debater is dishonest, and cannot rebut their opponent when the sentences are taken in context. This impression is reinforced when they treat metaphor as literal utterances. I have no time for such fools, and hence not time for you. I will only comment that if you are going to push conspiracy theories of science (as you are), then at least be honest enough to call it what it is. If scientists are deliberately not reporting adverse results, and discuss together how to avoid the adverse results coming to light as you maintain, then they are involved in a conspiracy. -
Gilles at 16:46 PM on 13 April 2011How I lived through a carbon tax and survived to tell the tale
"Hang on!!! What?!? No cost? Why? Given the huge costs of inaction, it makes perfect sense to do this even at substantial cost," but it is at the expense of a substantial cost, how wouldn't it affect economy ? I'm rather lost in your various estimates of what increasing costs can produce, following what you're arguing : sometimes they don't produce anything (for instance in SRES BAU growth scenarios, the fact that cheap conventional resources will be exhausted and replaced by expensive unconventional resources doesn't seem to have any effect on their consumption !) , sometimes it is supposed to provoke recessions (peak oil fears), sometimes it just lead people to switch to other sources ... the economic rules seem to be very flexible following what we want to demonstrate ! -
les at 16:44 PM on 13 April 2011There is no consensus
316 Frykman "My primary support of this is the near certain fact that any such funding is either minuscule or non-existent. I look forward to your refutation of my proposition." Ammeter time in argumentation, I see. Make a vague statement that something ill defined doesn't exist and ask for it to be refuted? You will really have to raise your game if you want to engage here. To help you do that I suggest you look at a certain Mr. PoopDrecks list of "anti-AGW publications". The reason to do this is that what you'll find is that the whole idea is totally meaningless in reality. The reality of the practice of science is no one has ever had a grant or got a job to prove or disprove AGW. Working scientist - which I'd hazard you have absolutely no experience of - get jobs and grants (public funding, at least) to go measure things, do analysis, build models; which reflect and improve our understanding of reality - another thing I'd hazard you are a stranger to. If you find a public funded grant which sets out to prove or disprove an ideology - that would be a bad thing and should be queried. That's been tried here and there - see, for example, Cucinelli V Mann - and, to date, has failed. The failure of such law suites is, so far as it goes, a legal refutation of your proposition. However, none of that applies to private funding, as for example the funding of the Koch brothers - which is targeted specifically at people who promise, although may fail, to disprove AGW. I've no doubt that's a waste of typing. And, unless you take advice and raise your game; you won't get much more. -
RSVP at 16:44 PM on 13 April 2011Waste heat vs greenhouse warming
muoncounter 361 One could ask a similar questions about AGW. A so called GHG "fingerprint" would show up as higher high temperatures in arid sunny climates. I dont know if this has been observed, but I have not seen anything mentioned on this. On the other hand, a waste heat "fingerprint" would be all temperatures everywhere generally going up as this heat slowly gets spread around, which is what I do think is happening. This is space ship Earth, not unlike the satellite I described in 359. We are taking everything with us. We are liberating stored energy that has been trapped for millions of years and dont even realize why it getting warmer. Eventually something will click. Perhaps when fussion makes this more obvious. -
Gilles at 16:41 PM on 13 April 2011How I lived through a carbon tax and survived to tell the tale
202 : My argument was that the natural increase of the resource extraction cost would have exactly the same effect - and actually this increase has been much larger than any tax these last years. You seem to miss a point : that the amount of FF that could threaten the Earth in FF intensive scenario can only be produce at an expensive cost anyway, because cheap FF are much less than that. So why would a carbon tax discourage people from using FF that would be sold anyway at a much higher cost than that a tax can produce ? either they're not discouraged by the extraction cost - and won't be either by a tax. Or they would be discouraged by a tax - but by high extraction costs as well. In both cases, the tax doesn't have any significant effect - which is precisely what is observed. Historically, taxes had some interest in the past when FF were cheap - the interest of sparing them and making them last a little bit longer. But this time is mainly over. -
RSVP at 16:33 PM on 13 April 2011Waste heat vs greenhouse warming
KR 360 If my "thesis" were false, there would be no such thing as social security... the idea that if you tuck away a small amount over time, after many years there will be a significant pile left over. Another simple analogy is electronic circuit drift. In this circuit, "ground" is floating, and slowly rising. Unless for some natural causes the overall backdrop average temperatures were decreasing, there is absolutely no reason for this energy not to accumulate, whereas you say "there is no plausable mechanism". It is my understanding that AGW assumes "all things being equal" in terms of the natural average trend, so if all things are equal, the added heat can only be accumulating. I am sure you would feel cheated if the gov. told you they spent your social security pension, and you might want to remark on this if you care to reply. -
There is no consensus
Bruce >"My primary support of this is the near certain fact that any such funding is either minuscule or non-existent. I look forward to your refutation of my proposition." >"Oh, finally is Dr Landsea now a "kook" or a "denier?" http://www.aoml.noaa.gov/hrd/Landsea/landsea_bio.html" Oops, I think you just scored an own goal. Your argument was that skeptics are pressured out or unfunded by the government, but then you went and posted a link that shows a) Landsea is still in the employ of the government and b) listing the extensive research Landsea has been able to perform since since his IPCC resignation letter. What point are you trying to make again? If your argument is specifically about the IPCC, then please take it to one of the multiple IPCC threads listed here. This thread is about general consensus among climate scientists. -
Dan Moutal at 16:17 PM on 13 April 2011How I lived through a carbon tax and survived to tell the tale
@ Gilles " the issue is to replace them [FFs] at no cost, for a given standard of living. " Hang on!!! What?!? No cost? Why? Given the huge costs of inaction, it makes perfect sense to do this even at substantial cost, even though the best estimates show the costs are minimal, and if history is any guide overestimated. I think you really need to stop, and take some time to think this through. It is abundantly clear that you haven't. -
Dan Moutal at 16:13 PM on 13 April 2011How I lived through a carbon tax and survived to tell the tale
@ Gilles You are missing the point. Of course we don't know exactly how to create a fully FF free energy system. If we did we would just get the government to mandate the solution. But we don't know and that is WHY you implement a price on carbon. So the free market can figure out all those pesky details. It is damned good at doing just that. Nothing beats it. This has been explained often to you in this thread, and again in the interviews I asked you to listen too. But you continue in missing the point. Is it too much to ask that you keep on topic? -
Gilles at 16:05 PM on 13 April 2011Arctic Ice March 2011
after these interesting, on topic,s thoughts, do you have news from Lincoln sea ? where is it to be found online BTW ? -
scaddenp at 16:04 PM on 13 April 2011How I lived through a carbon tax and survived to tell the tale
Oh and on "those subsidies were put in place to encourage exploration because a reliable fuel supply is absolutely necessary to ensure the security of our country. " You mean the government was deciding what was the most reliable fuel supply instead of the market? I don't buy it. If FF was the best answer then it didnt need a subsidy. Nuclear or renewables might be answer to current problem but I still wouldnt back subsidies for them. Set it up so market finds the best answer. -
Gilles at 15:54 PM on 13 April 2011How I lived through a carbon tax and survived to tell the tale
Marcus : and what is the point that oil is needed for transportation ? (but also for fishing for instance, and some left is used for heating where geothermal warmth is not available). Isn't transportation necessary for a modern economy ? now for 187 : A) it is possible when non-intermittent and steerable hydro and geothermal power is available - otherwise, it's just wishful thinking up to now. B) again - you mix up technical feasibility and economical one - the issue is to replace them at no cost, for a given standard of living. For steel - it seems that you don't fully master the chemistry of oxidation and reduction. Electric furnaces only oxidize carbon rich iron cast, or recycle already used metallic pieces, either by mixing them with iron cast, or by using carbon electrodes. The carbon consumption is much lower just because you start basically from already reduced metals, and just have to reduce the small amount of oxides produced by roast. They don't work for mineral oxides. We don't know how to produce the current quantity of steel without coke. C) Well Iceland currently has around 50 hydrogen powered buses, both at home & abroad-which isn't bad for a program only started in 2005. well, not bad ... what do you think is the growth rate ? -
HumanityRules at 15:37 PM on 13 April 2011Solar Hockey Stick
37 dana1981 There is nothing in that link about land use change or natural variation. There is nothing in the IPCC figure used in that post about these as well.
Prev 1795 1796 1797 1798 1799 1800 1801 1802 1803 1804 1805 1806 1807 1808 1809 1810 Next


