


 Arguments


Recent Comments
Prev 1798 1799 1800 1801 1802 1803 1804 1805 1806 1807 1808 1809 1810 1811 1812 1813 Next
Comments 90251 to 90300:
-
Marcus at 09:58 AM on 14 April 2011How I lived through a carbon tax and survived to tell the tale
"you just forget something : we already have cars." Wow, is that the *best* you can do? Hilarious. In the 19th century, we already had a number of relatively cheap modes of transportation (horses, horse-drawn carriages, bikes, our own two feet). Yet that didn't stop the public & private sectors from collectively investing in the construction & sale of very expensive motor cars-or the construction of an entire fuel infrastructure. Similarly, when TV's first came out, we already had access to a number of relatively cheap entertainments (the radio, the theater, the movies). Yet, again, that didn't stop the manufacture & sale of relatively expensive TV sets-or the construction of an entire infrastructure to make us of the new medium. Now of course most renewable energy sources aren't starting off nearly as expensive-relative to existing energy options-as cars & TV's were relative to their pre-existing "competition". The *real* point of my analogy, though, was that once economies of scale got going, both cars & TV's (& coal-fired electricity for that matter) all came down in price until they were affordable to the masses. In the same vein, the life-cycle costs of renewable energy technologies will continue to improve as economies of scale (& improved manufacturing technologies) kick in. Meanwhile, increasing scarcity of fossil fuel resources will make the life-cycle cost of coal-fired electricity even more expensive. So much so that I feel confident in making the following prediction-the nations which have failed to make a switch towards a *mostly* renewable energy fueled economy, by around the middle of this century, are setting themselves up to the Third World Countries of both the latter half of the 21st century & the 22nd century. -
cloa513 at 09:46 AM on 14 April 2011Christy Crock #3: Internal Variability
Both wrong- its external variability- cosmic rays (and the sun) explain the cloud cover. There is low CO2 temperature climate sensitivity- the reaction of the temperatures to major volcanic eruptions shows that.Response: Problem with the "cosmic rays are driving global warming by changing cloud cover" argument is cosmic radiation and climate went in opposite directions in the latter 20th Century - if anything cosmic rays and the sun should be having a cooling effect.

Reconstructed cosmic radiation (solid line before 1952) and directly observed cosmic radiation (solid line after 1952) compared to global temperature (dotted line). (Krivova 2003) -
Alexandre at 09:44 AM on 14 April 2011Christy Crock #3: Internal Variability
Christy dismisses all the evidence supporting AGW as insufficient, perhaps. I would guess that his own theory has a much more compelling set of evidences. But it fails to answer a lot of questions: - Why did DLR increase and OLR decrease over the last decades? - Why did this measured trapped IR energy NOT increase the temperature? What has happened to it? - Where’s the very compelling evidence that global temperatures vary as wildly as the last decades (some 0.6ºC in 40 years). Why did all those clouds decide to warm the planet now, if they don’t usually do it? - Where’s the evidence that cloud cover has varied as much as to justify the observed warming over these decades? I’m a layman, so I’d be pleased if someone more knowledgeble explained to me why my questions are for some reason irrelevant. Or not? -
Bob Lacatena at 09:44 AM on 14 April 2011It warmed just as fast in 1860-1880 and 1910-1940
42, Rob, Wow. Okay, so this guy has a really, really deep bag of scientific "tricks." And the deniers are all up in arms about "hide the decline?" Sheesh. Adam, Sorry, but as a source, that one is downright pathetic. Please check your sources more carefully in the future. If you don't mind taking a bit of advice, usually I find it helpful to be skeptical about these sorts of things, read them carefully, and look into them in some detail. Otherwise you could find yourself falling for some very alarming scientific hoaxes. -
WSteven at 09:34 AM on 14 April 2011Monckton Myth #16: Bizarro World Sea Level
I love the tilted graph. I'd expect that kind of nonsense from someone in junior high or _maybe_ senior high school. How can anybody who does this be considered a credible source of information? Good article, Dana. -
Albatross at 09:33 AM on 14 April 2011It warmed just as fast in 1860-1880 and 1910-1940
All, Re the dubious TSI data from Soon. Here is a graph by Kopp and lean (2011; both (eminent scientists in this field) that shows a distinct downward trend between 1979 and 2010: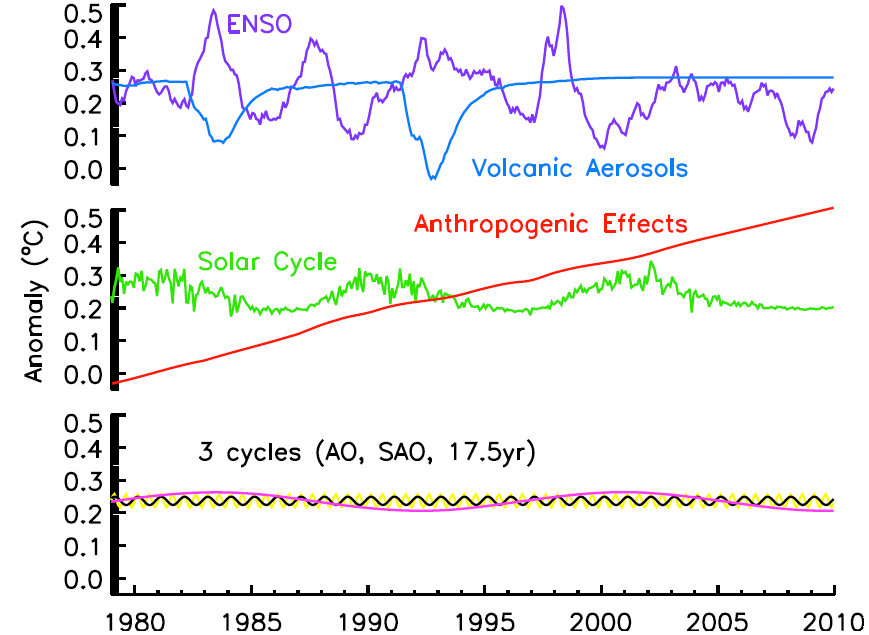 Caption: Contributions to the empirical model of temperature shown in Figure 1 are broken down here: El Niño Southern Oscillation (purple), volcanic eruptions (blue), anthropogenic effects (red), and solar irradiance (green).
[Source]
and compare those data with the SAT data:
Caption: Contributions to the empirical model of temperature shown in Figure 1 are broken down here: El Niño Southern Oscillation (purple), volcanic eruptions (blue), anthropogenic effects (red), and solar irradiance (green).
[Source]
and compare those data with the SAT data:
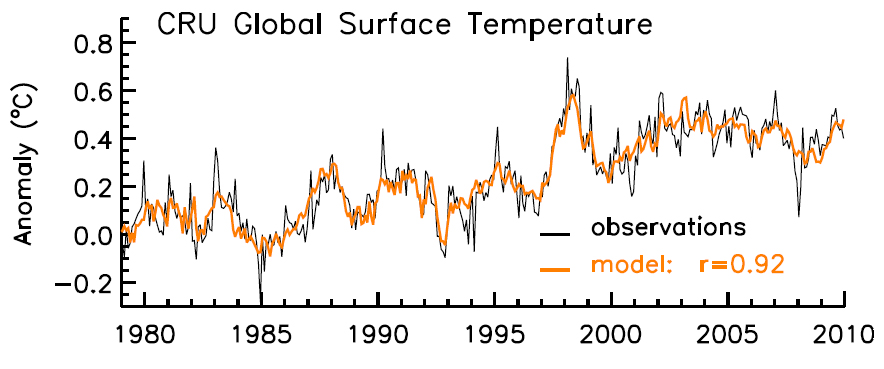 Caption: Global surface temperature from 1980 to 2010 has risen by 0.4 degrees Celsius (0.72 degrees Fahrenheit) according to Climate Research Unit measurements (black) and an empirical model (orange). (Courtesy Kopp and Lean), same source as above.
Not surprisingly, Kopp and Lean conclude that:
"Using this model, Lean estimates that solar variability produces about 0.1°C global warming during the 11-year solar cycle, but is not the main cause of global warming in the past three decades."
Caption: Global surface temperature from 1980 to 2010 has risen by 0.4 degrees Celsius (0.72 degrees Fahrenheit) according to Climate Research Unit measurements (black) and an empirical model (orange). (Courtesy Kopp and Lean), same source as above.
Not surprisingly, Kopp and Lean conclude that:
"Using this model, Lean estimates that solar variability produces about 0.1°C global warming during the 11-year solar cycle, but is not the main cause of global warming in the past three decades."
-
Dikran Marsupial at 09:13 AM on 14 April 2011Weather vs Climate
Bruce@124 If you think there is anything interesting in that, you have just demonstrated that you don't understand the difference between weather and climate. A warming climate does not imply there will not be bad weather, there isn't anything ironic about it. Dellingpole shows rather poor taste in his sarcastic gloating about it IMHO, I don't know why anyone would want to share in that. -
Bruce Frykman at 09:00 AM on 14 April 2011Weather vs Climate
Climate vs weather. A group of activists headed up to the arctic circle in May 2009 to "raise awareness" that the "warmer climate" was creating mild snow, ice, and temperature conditions there, thus driving polar bears to extinction. They were driven back by ferocious snow, ice, and temperature conditions that nearly killed them; they needed to be rescued lest they die under the horrific cold conditions they found on the way. The number of polar bears they encountered was posing yet more deadly risk to the party. It incident was all due to colder "weather" and not the warmer "climate" http://blogs.telegraph.co.uk/news/jamesdelingpole/9802307/Global_warming_explorers_in_Arctic_get_nasty_shock_polar_ice_caps_blooming_freezing/Moderator Response: Yes exactly, as you pointed out this is an example of weather not climate. If your argument is that the arctic is not warming, please take it to one of the related Arctic threads posted here. -
Gilles at 08:37 AM on 14 April 2011How I lived through a carbon tax and survived to tell the tale
"The reason why high extractions costs wont reduce emissions has already been answered. (hint tar sands)" The issue is that high extractions costs have reduced emissions ! It's very clear that the production of FF has leveled off during the spike of barrel price, and will do it again with the current new spike. And tar sands production hasn't risen - for the good reason that nobody wanted to buy more. Personally I'm not fond of "reasons" explaining non-existing facts ...
Moderator Response: [Dikran Marsupial] ISTR having pointed this out before, but extracting FF from tar sands takes up a great deal of energy. You can't measure total emissions by counting barrels of oil shipped, because that ignores the carbon emissions from energy expended in extracting it. For tar sands, that is very far from negligible. There is also the issue that oil sales are not necessarily driven purely by demand. Oil is not in plentiful or unlimited supply, and it is not necessarily to the economic advantage of those that hold the reserves to sell in such quantities as to satisfy demand. Thus the levelling off of sales does not necessarily imply that the cost of extraction is the cause of the levelling off, or that total carbon emissions are also levelling off. The Earth doesn't care if the carbon emissions are from tar sands oil or from energy expended in extracting the oil from the tar sands. The CO2 is a greenhouse gas either way. Also oil is not the only FF. IIRC also a major justification for tar sands is security of supply rather than cost. Apart from that the comment is fine.
and will do it again with the current new spike. And tar sands production hasn't risen - for the good reason that nobody wanted to buy more. Personally I'm not fond of "reasons" explaining non-existing facts ...
Moderator Response: [Dikran Marsupial] ISTR having pointed this out before, but extracting FF from tar sands takes up a great deal of energy. You can't measure total emissions by counting barrels of oil shipped, because that ignores the carbon emissions from energy expended in extracting it. For tar sands, that is very far from negligible. There is also the issue that oil sales are not necessarily driven purely by demand. Oil is not in plentiful or unlimited supply, and it is not necessarily to the economic advantage of those that hold the reserves to sell in such quantities as to satisfy demand. Thus the levelling off of sales does not necessarily imply that the cost of extraction is the cause of the levelling off, or that total carbon emissions are also levelling off. The Earth doesn't care if the carbon emissions are from tar sands oil or from energy expended in extracting the oil from the tar sands. The CO2 is a greenhouse gas either way. Also oil is not the only FF. IIRC also a major justification for tar sands is security of supply rather than cost. Apart from that the comment is fine. -
Rob Honeycutt at 08:35 AM on 14 April 2011It warmed just as fast in 1860-1880 and 1910-1940
Sphaerica... You also have to look at Fig 3 in Adam's Svensmark/Friis-Christensen PDF and then compare it to the same data at Wood For Trees. -
les at 08:34 AM on 14 April 2011There is no consensus
347 pbjamm Indeed. But he posts a lot of hot air... ... Gilles' be along in a moment to claim that that's the reason the arctic is melting.Moderator Response: [DB] DNFTT. -
Dikran Marsupial at 08:33 AM on 14 April 2011Monckton Myth #16: Bizarro World Sea Level
Daniel Maris@30 Would you accept then that the Telegraph article that you raised on another thread has been refuted by the evidence I have presented in this thread, which show the allegations made by Morner are completely without foundation? I ask because a common trait of deniers is to avoid explicitly acknowledging when one line of argument is refuted (so they can return to it later or elsewhere) and simply pick a new line of evidence? What you have just done looks very much like exactly that, so maybe you would like to dispel that impression. Secondly, have you investigated the WUWT story to find out whether it checks out, or whether like the Telegraph article it is full of bogus claims? -
pbjamm at 08:29 AM on 14 April 2011There is no consensus
Bruce@345 "So far I have seen no scientific evidence of any kind here being presented here by anyone." Then you should be doing more reading and less typing. This site is chock full of links to scientific studies and data that support the the premise that the earth is warming and that human activity is driving the change in temperature. Not many people here are practicing climate scientists so not much original work is generated, thus the links to others work. If you have a published paper of your own or links to studies that you think are relevant to the discussion then please post them in the appropriate thread. As for this thread, you have not provided anything constructive to the discussion (not debate! not argument!) of the original post. Your first comment @311 was an accusation that Climate Science is driven by politics rather than data with no supporting evidence. That is not how this site works. If you are going to take a position you need to support it somehow. -
les at 08:29 AM on 14 April 2011There is no consensus
Hummm two more looong post by Mr. Frykman and still no evidence to back up his earlier claims. Clearly not here to present nor discuss facts. -
Rob Honeycutt at 08:25 AM on 14 April 2011It warmed just as fast in 1860-1880 and 1910-1940
Adam... "I have explained why Greenland and Arctic temperature variations are not man made." No, you have explained why you believe there is an inconsistency between the warming period in the early 20th century and the warming in the latter 20th century, making the wrong assumption that both had to be directly correlated with the increased concentrations of atmospheric CO2. -
Dikran Marsupial at 08:24 AM on 14 April 2011Earth hasn't warmed as much as expected
Rovinpiper@1 Practically all modern models include ocean effects and are known as coupled atmosphere-ocean general circulation models (AOGCMs). Practically all modern models incorporate aerosols as well (you can't adequately model 20th century climate without them c.f. "ice age predicted in 70s" canard). -
Gilles at 08:23 AM on 14 April 2011The e-mail 'scandal' travesty in misquoting Trenberth on
Sphaerica : "express exactly where he stands on the topic of this post (i.e. how a statement by an important and respected climate scientist was clearly and manipulatively taken out of context by people who simply don't like what the facts and science have to say). " Frankly ? i don't care much about what people think of what other people say. You may be right , but it's not a question of physics - may be of psychology, politics, sociology. Billions of people think stupid things anyway, so I can't waste my time in looking at them all. So I posted here to correct what I thought being incorrect : no we don't have a precise measurement of fluxes, yes the Earth doesn't seem to have gained energy these last years - whatever the reason is. Read the thread again - I didn't try to "manipulate" anybody - I just explained why some sentences appeared erroneous to me. Alec Cowan : I don't really get what you're trying to argue - yes multiplying 1 W/m2 by the surface of the Earth and the number of seconds in one year gives something like 10^20 J/year - and so? what does it change ? -
Albatross at 08:21 AM on 14 April 2011Solar Hockey Stick
Shawn @58, "Just throwing an offhand comment that I am committing seppukku is not helpful. " Re credibility seppuku-- that is not a comment or opinion, it is an empirical observation based on your posts here. You are entitled to your opinion, but do not expect to overturn credible science or make compelling arguments by talking through your hat. Re "That may be true, but again, one does not need to invoke GCRs or some other hitherto unknown mechanism to explain the observed warming. Surely you agree with that much?" OK, I think that we finally agree on something--I am referring to the observed warming since the early sixties, when TSI and global SATs traces diverged. -
Albatross at 08:14 AM on 14 April 2011Monckton Myth #16: Bizarro World Sea Level
Daniel, Be a true skeptic please--do not believe everything you read and see at WUWT, or take it at face value. There is much fiction touted as fact on that pseudo science blog. Are you now too denying that global sea levels have risen? -
Daniel Bailey at 08:13 AM on 14 April 2011Monckton Myth #16: Bizarro World Sea Level
@ daniel maris Citing disinformation blogs does little for your credibility and explains much. -
adelady at 08:09 AM on 14 April 2011Monckton Myth #16: Bizarro World Sea Level
Wheels, apparently not. I've now concluded that I should read DenialDepot not just for fun. We all should see it as a sign of what we might expect to see in certain publications. If graph-tilting or axis-fudging is not already out there, it will be one day. -
daniel maris at 08:07 AM on 14 April 2011Monckton Myth #16: Bizarro World Sea Level
It seems that Prof Morner isn't safe from ad hominem attacks. I suggest people take a look at this site: http://wattsupwiththat.com/2009/03/19/despite-popular-opinion-and-calls-to-action-the-maldives-is-not-being-overrun-by-sea-level-rise/ You'll see some very interesting photos there which suggest that the alleged sea level rise in the Maldives is really pure fiction. There is also some very relevant criticism of tide guage measurement. Interesting to see the rickety structures - there's only one way they are going and that is down!Moderator Response: [Dikran Marsupial] Just for clarification, there has been precisely one ad-hominem against Morner posted on this thread, and it has been deleted by a moderator (not me as I am actively involved in the discussion) because it contained an ad-hominem. So it would seem Prof. Morner is quite safe from ad-hominem attacks here, provided you give the moderators time to do their jobs. -
adelady at 08:04 AM on 14 April 2011Monckton Myth #16: Bizarro World Sea Level
adrian, when you read the IPCC carefully you will notice that they _explicitly_ exclude any contribution from melting ice sheets. Not because they think it's a bad idea, or it's not happening, or it can't be measured. It's excluded because of the IPCC's role. To report on the science as published up to a point in time. At the time of collecting and evaluating available papers, there was too little explicit calculation and attribution of the amount or the rate of rise attributable to melt - let alone projections of expected rise due to melt. That situation won't apply for the next round. Don't say you weren't warned if there are big differences between the next and the previous IPCC reports. -
Bruce Frykman at 07:58 AM on 14 April 2011There is no consensus
RE: # Bruce@343 "Is this really a debate forum?" "No. It is a forum for the presentation and discussion of scientific evidence." OK, which of your have presented "your" scientific evidence here; not other's - "yours". So far I have seen no scientific evidence of any kind here being presented here by anyone. If you are merely linking to stuff you like, then all you are doing is cheer-leading your cause. If you are simply denigrating others by linking to science you don't like then your are engaging in something but it is clearly not science. ( -Snip- ) RE: "- Ad Hominem accusations of distortion against the majority of climate scientists with no evidence for same." # Where is the ad hominem? Have I called anyone's comments "deplorable?", "rants?" Clearly you have! How have I distorted "the majority" of climate scientists? Who or what represents this "majority?" Do any of you have any data of figures that substantiate what and who represents this majority? I belong to several groups but I would never be mindless enough to suggest that "group think" constitutes is my think. It all sounds rather militaristic. In discussing all of this science do any of you ever favor one individual scientist's ideas over another's? If you did, would not this be casting an ad hominem towards the group's endorsed thought processes by your own standards? Re: "Posting ideology rather than facts" What is my "ideology?" RE: Major, major tendencies to run off-topic. Guilty,I have devoted major major tendencies to discuss why you have deleted my comments.Moderator Response: [DB] "So far I have seen no scientific evidence of any kind here being presented here by anyone." Try actually reading the posts and the linked source studies. Staying on-topic on a science-discussion (not debate) website is a must, not a want. Adherence to the Comments Policy is also not optional. Complaining about having to comply with it is a surefire ticket to forcing the moderators to act. Maybe you might want to perhaps consider other venues with less restrictive policies? -
shawnhet at 07:57 AM on 14 April 2011Solar Hockey Stick
Honestly, I have no clue what you were talking about in your previous comment so it is pretty much impossible for me to give more detail until I understand what you are talking about. Just throwing an offhand comment that I am committing seppukku is not helpful. Am I precluded from making any statements at all including of my own opinion that are not referenced in peer review literature? No one else on this thread is handcuffed to this extent. -
WheelsOC at 07:56 AM on 14 April 2011Monckton Myth #16: Bizarro World Sea Level
I have to second a previous question: did this report come out on April 1st? -
Daniel Bailey at 07:47 AM on 14 April 2011It warmed just as fast in 1860-1880 and 1910-1940
@ KR Not an expert an the Arctic, but my read on Chylek2009 is this: The Arctic temps are heavily influenced by the AMO, which makes sense. The problem is, and perhaps Robert Way could provide some insight on this, that (as currently defined), the AMO is not properly detrended for the post-1975 warming. The detrending performed is linear, but the warming itself since 1975 is non-linear. Tamino made that observation here, that (under the linearly detrended AMO definition, the post-1975 increase reflected in the AMO is because of global warming. It is the residue of global warming. That being said, Chylek 2009 only says the rates of Arctic Amplification were greater in the earlier time frame than the later. It does not say that the earlier was warmer. Tamino also removes the cyclical exogenous factors from the temperature records to show this: My two cents. HTH.
The Yooper
My two cents. HTH.
The Yooper
-
Bob Lacatena at 07:28 AM on 14 April 2011It warmed just as fast in 1860-1880 and 1910-1940
33, Adam, I love that graph, and that paper!!!! I love them!!! The caption for the graph, in particular referencing the lower graph where things match so very nicely between cosmic rays and tropospheric temperatures, says this:The lower panel shows the match achieved by removing El Niño, the North Atlantic Oscillation, volcanic aerosols, and also a linear trend (0.14 ± 0.4 K/Decade).
This is great. Remove El Niño. Check! Remove North Atlantic Oscillation. Check! Remove volcanic aerosols. Check! Remove global warming. Check! Wait! Remove global warming? Yes. If you take global warming out of the picture, the match is perfect. They have basically proven for us that cosmic rays have nothing whatsoever to do with current warming. Does it have an influence on natural short term variations? Apparently (although I'm not so sure that these are people I trust, but since I could care less about short term variations, it doesn't matter much). But does it have any influence on global climate? Is there any attribution whatsoever for the current warming trend due to cosmic rays? They have proven that this answer is "no." [I also despise anyone who puts out a PDF of a paper and tries to make it look like a peer reviewed journal article, which this clearly is not. For shame.] -
David Horton at 07:27 AM on 14 April 2011Monckton Myth #16: Bizarro World Sea Level
"It boggles the mind that Monckton and the "S"PPI think they can convince people that sea level has dropped since 1950" - it, and similar approaches have worked well for over ten years now. -
It warmed just as fast in 1860-1880 and 1910-1940
Adam - Thanks for repeating the Chlylek link. Looking at their paper, it's quite evident that Arctic (and for that matter Greenland) temperatures follow the global temperature trends. Their statement that Arctic amplification is insufficient to explain the magnitude of such trends is a bit more iffy, however, bordering on odd. I would be interested in the Arctic expert's opinions on this. The AMO data is also quite interesting; given that the AMO appears to also track the temperature anomaly record, however, I would consider this a possible correlation to temperature (and changing wind patterns) as a first cause - otherwise you have to argue that the AMO is affecting global temperatures, including the Southern Hemisphere, which I quite frankly would have to see some strong evidence (and a plausible mechanism) for before accepting. Have you at least dropped the strawman argument about CO2 being the only driver of climate? -
There is no consensus
Bruce Frykman - The major problems that I see with your posts are: - Ad Hominem accusations of distortion against the majority of climate scientists with no evidence for same. - Posting ideology rather than facts. - Major, major tendencies to run off-topic. Do you have any science to present? Evidence? This site is set up to discuss science, after all, not politics. If you don't, then it's your opinions versus assembled facts. Quite frankly, in my view, your opinions aren't holding up very well... -
dana1981 at 07:15 AM on 14 April 2011Monckton Myth #16: Bizarro World Sea Level
adrian #24 - try in the ballpark of 1 meter sea level rise by 2100. Just because the IPCC AR4 didn't include melting land ice doesn't mean it won't melt - in fact it already is. -
Alec Cowan at 07:13 AM on 14 April 2011The e-mail 'scandal' travesty in misquoting Trenberth on
@Albatross #84 Don't worry. I understand what you say. I see this kind of characters like they being magicians that are meaning they really vanished the coin because they have powers and idiotic masses prone to believe them. But the answer is not speaking about the impossibility of violating the laws of Thermodynamics, but explaining the public what blind spot the magicians exploited, and most of all, where are the hidden coins. -
Adam at 07:12 AM on 14 April 2011It warmed just as fast in 1860-1880 and 1910-1940
Anyway, this is getting pretty tiring. I'm leaving now. I'm going out tomorrow, so I probably won't be able to comment again until tomorrow evening. So long. -
pbjamm at 07:12 AM on 14 April 2011There is no consensus
Bruce@343 "Is this really a debate forum?" No. It is a forum for the presentation and discussion of scientific evidence. -
muoncounter at 07:11 AM on 14 April 2011It warmed just as fast in 1860-1880 and 1910-1940
Adam#22: "the 2003 and 2010 spikes were just one year events, which quickly went back to normal straight after. Could you please explain how it could have been anthropogenic co2, which caused those two spikes," No one said those one year events were caused by CO2. "The temperature in Greenland for 1920-1940 didn't have many outlier temp anomalies, it stayed at roughly the same trend over those few decades. " That's just not true. There is in fact a 1.2 degree jump in 1919 (I just plotted the Polyakov data). If that's in error, your rapid 1930s warming is a thing of the past. Wouldn't a real skeptic question an entire conclusion that rests on the validity of a single data point? -
Adam at 07:10 AM on 14 April 2011It warmed just as fast in 1860-1880 and 1910-1940
KR read this paper http://www.lanl.gov/source/orgs/ees/ees14/pdfs/09Chlylek.pdf " the Arctic temperature changes are highly correlated with the Atlantic Multi-decadal Oscillation (AMO) suggesting the Atlantic Ocean thermohaline circulation is linked to the Arctic temperature variability on a multi-decadal time scale." "The Atlantic Ocean thermohaline circulation multi-decadal variability is suggested as a major cause of Arctic temperature variation." The Arctic multidecadal oscilation can indeed explain the temperature changes observed in the Arctic. "Your arguments are unsupported, incorrect, and generally empty of data, theory, or (in my opinion) content. " KR I don't think you have actually read my comments. I clearly explained it in detail and provided peer reviewed studies. -
pbjamm at 07:07 AM on 14 April 2011It warmed just as fast in 1860-1880 and 1910-1940
Adam "So, once again, could you please explain to me why there is no correlation between CO2 and Greenland temperature variations. You do agree that there is no correlation with CO2, right?" and "I have explained why Greenland and Arctic temperature variations are not man made." I do not believe you have adequately established or supported this position. No. If you are going to take a position contrary to the majority opinion then you have to provide a lot more evidence than you have. -
Adam at 07:06 AM on 14 April 2011It warmed just as fast in 1860-1880 and 1910-1940
"Please explain why Soon's TSI data after 1960 contradict the reputable (and official TSI ) data. His paper falls to pieces right there." Albatross, first of all from 1960 to 1980 the correlation did indeed increase. I think it is fair to say that the correlation between the sun and the climate (supposedly) ends at around 1981, which is the time of the solar maximum. However, when you use tropspheric temperature data instead of solar data you can see that the correlation does indeed continue. As shown by the graph below, for the past 20 years there is a perfect correlation between cosmic rays and tropospheric temperature. Albatross, the link between the sun and climate did not end.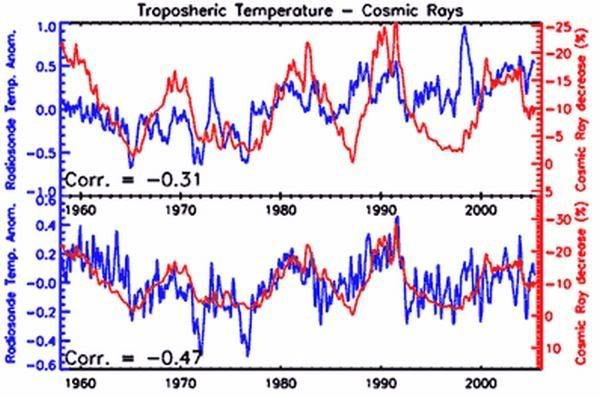 http://icecap.us/images/uploads/SvensmarkPaper.pdf
-
It warmed just as fast in 1860-1880 and 1910-1940
Adam - "...oceanic oscilations play a major role in Arctic climate. They most likely brought in warmer waters, which caused the previous Greenland warming and are most likely what caused the most recent Greenland warming." To which I will reply: Evidence? Do you have any evidence of such changes in Arctic circulation showing correlation to temperatures? There's certainly plenty of evidence for the various known forcings driving global temperatures, along with the Arctic amplification - you're asking for an unproven hypothesis with no evidence to supplant a well supported hypothesis that matches the data. I believe the term is "wishful thinking". If that's all you have, then you're not even hand-waving. As has been said here before - You're entitled to your own opinion - but not your own facts. -- "You do agree that there is no correlation with CO2, right?" Sigh - There's excellent correlation with known forcing factors, including CO2; your strawman argument against CO2 as the only factor is both repetitive and deeply incorrect. Your arguments are unsupported, incorrect, and generally empty of data, theory, or (in my opinion) content. Please read some of the references you have been pointed to. -
shawnhet at 07:04 AM on 14 April 2011Solar Hockey Stick
Is it not common knowledge at least that GCR changes with Earth's motion relative to the spiral arms of the galaxy?Moderator Response: [DB] Shawn, this is not a debate or rhetoric forum (in which you'd also be doing poorly), this is an online community for the discussion of science. Unless you can provide contextual understanding of your points supported by linked peer-reviewed published science, no one here will take you seriously. Obviously, neither of us wish for that to happen. In your above comment, you provide no additional commentary for anyone reading it to understand why you write what you wrote or even that you understand it yourself, let alone how it is germane to the topic of this thread. -
Alec Cowan at 07:04 AM on 14 April 2011The e-mail 'scandal' travesty in misquoting Trenberth on
#Gilles #82 and #83 You may use the search capabilities of this site, or use instead Google buy placing into the searchbox, for instance, [Trenberth travesty and deep ocean heat site:skepticalscience.com]. You'll find the story of the 0.9, 0.77 and all the values that have been used. You'll even find some peer reviewed literature accounting for more that 60% of Trenberth's travesty in deep ocean Southern waters -next home :)- (Trenberth's travesty had a value in the time of the famous email, and it isn't 0.9 at all -a hint, it included a 1020-. You should know this before discussing the subject). This site is full of material for you to replace your saying with a founded opinion. -
Adam at 07:00 AM on 14 April 2011It warmed just as fast in 1860-1880 and 1910-1940
"So, you are left with no theory, no explanation, nothing other than your desire for AGW to be wrong. " Rob Honeycutt, I have explained why Greenland and Arctic temperature variations are not man made. I do not think that anyone here, has properly answered my points. Yes, Greenland is not the whole world, but polar regions are especially important for detecting any effect caused by anthropogenic greenhouse gases. Therefore, seeing that there is no correlation between Greenland temperature and co2, is not 'cherry picking' and is indeed valid as evidence against AGW. -
muoncounter at 06:58 AM on 14 April 2011It warmed just as fast in 1860-1880 and 1910-1940
Adam#20: "the previous Greenland warming" In Soon's temperature graph shown by Adam#9, the temperature jumps by more than 1 degree in 1920. In the data available from Polyakov et al, this jump does not occur until the mid 1930s. Does this suggest that the surface temperature data for the early 20th century Arctic isn't all that reliable? -
Albatross at 06:57 AM on 14 April 2011It warmed just as fast in 1860-1880 and 1910-1940
Adam, Re blog posts, I concur, but to a point. Please explain why Soon's TSI data after 1960 contradict the reputable (and official TSI ) data. His paper falls to pieces right there. -
Adam at 06:57 AM on 14 April 2011It warmed just as fast in 1860-1880 and 1910-1940
"The appropriate scientific response would be to question why there is an inconsistency or even if your perception of the inconsistency is even accurate. " So, once again, could you please explain to me why there is no correlation between CO2 and Greenland temperature variations. You do agree that there is no correlation with CO2, right? So therefore could you please explain to me how it is possible that CO2 is the driver of Greenland's climate despite the fact there is no correlation. -
pbjamm at 06:55 AM on 14 April 2011It warmed just as fast in 1860-1880 and 1910-1940
Albatross@19 I do not think that Adam is "misrepresenting Dr. Box." He is using Dr Box's research to come to a different conclusion than the Dr himself. Adam@20 "KR natural factors are indeed still present and can explain observed climate changes." Natural factors are still at work, no one would deny this. There seems to be great disagreement with your second assertion though. One paper by Soon is a good start to supporting your argument, but why is his dissenting opinion more credible than all the others he disagrees with? -
Adam at 06:54 AM on 14 April 2011It warmed just as fast in 1860-1880 and 1910-1940
"I'm sorry, but several people now have very patiently explained the errs of your ways to you, yet you are not listening." No, I have not been answered. You just keep repeating the same arguments over and over again (e.g. that Greenland is not the whole world) and are not giving the issue appropriate thought. -
Rob Honeycutt at 06:54 AM on 14 April 2011It warmed just as fast in 1860-1880 and 1910-1940
Looking at Soon's paper he relies on Hoyt and Schatten [1993] (and update from D. Hoyt, 2005) for his TSI data. I find this data heavily referenced on all the standard denier websites. -
Albatross at 06:54 AM on 14 April 2011It warmed just as fast in 1860-1880 and 1910-1940
Rob et al., There is something horribly wrong with those TSI data in Soon's figure, especially after 1960, where he has increasing TSI and all the reputable data that I am familiar with shows a slow decrease in TSI since the sixties. Note too that in the Soon paper, the TSI the are inferred/estimated....... I really have no idea how the reviewers' missed that glaring problem.
Prev 1798 1799 1800 1801 1802 1803 1804 1805 1806 1807 1808 1809 1810 1811 1812 1813 Next


