


 Arguments


Recent Comments
Prev 1825 1826 1827 1828 1829 1830 1831 1832 1833 1834 1835 1836 1837 1838 1839 1840 Next
Comments 91601 to 91650:
-
Stu at 01:36 AM on 31 March 20112nd law of thermodynamics contradicts greenhouse theory
"In the case of water, evaporation is by far the dominant heat loss mechanism for incident radiation, even Trenberth's diagram show's this. You can easily discover the figures for yourself by checking world wide rainfall; the heat needed to evaporate water is deposited in the atmosphere when it condenses. Yes evaporation is a big consideration, but I'm not sure why it trumps radiation. Locally (or indeed regionally), the latent heat flux can be massive, especially where cold air flows over warm water, but Trenberth's schematic shows evapotranspiration having an average value of 80 W/m2, compared to 396 W/m2 radiation: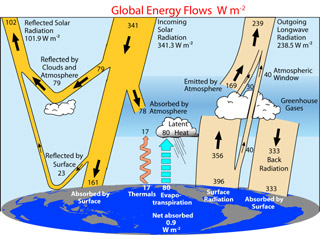 Indeed if you take water to have an emissivity of 0.95 at 300 K, then it's emitting 436 W/m2 at that temperature. And regarding that value of emissivity for water:
"True, but the link doesn't say that or give any figures for different wavelengths, so I do not understand what you are driving at."
The problem then is just that you didn't read the part of the page that says "As a guideline the emmisivities below are based on temperature 300 K"
A substance at 300 K will have its peak emissive flux in the thermal infrared.
"I have read the paper you linked plus the description of the radiometer used and it merely confirms what I wrote in #875. To summarise, the energy associated with heat is constantly being exchanged between (adjacent) molecules both mechanically by (elastic) collision and electromagnetically by absorption and emission of radiation; somewhere there is a link to a paper by Einstein in this connection.
I know this sounds pedantic but it has to be said. What the radiometer used in your paper measures is the radiation from gases that emit electctromagnetic radiation because they have T>0K. What the radiometer doesn't do is measure the 'upwelling' radiation from the same gases. If you could measure the 'upwelling' radiation from the same gases then you would be able to determine how much energy was being transferred and in which direction; only then would you be able to work out what was happening to the temperatures at the various locations of interest."
When you say 'energy associated with heat is... exchanged... by absorption and emission of radiation', you need to qualify it with the fact that only greenhouse gases do any absorbing or emitting. Again, it's not just that gases emit because they have T>0K. N2 and O2 do next to no emitting and their energy has to be transferred by collision to a GHG in order to be radiated away.
Also, radiation is emitted isotropically; if you measure a certain downward flux, you can be sure that the 'layer' of the atmosphere you're measuring is emitting the same flux upwards.
I think Tom Curtis has answered your other points nicely.
Indeed if you take water to have an emissivity of 0.95 at 300 K, then it's emitting 436 W/m2 at that temperature. And regarding that value of emissivity for water:
"True, but the link doesn't say that or give any figures for different wavelengths, so I do not understand what you are driving at."
The problem then is just that you didn't read the part of the page that says "As a guideline the emmisivities below are based on temperature 300 K"
A substance at 300 K will have its peak emissive flux in the thermal infrared.
"I have read the paper you linked plus the description of the radiometer used and it merely confirms what I wrote in #875. To summarise, the energy associated with heat is constantly being exchanged between (adjacent) molecules both mechanically by (elastic) collision and electromagnetically by absorption and emission of radiation; somewhere there is a link to a paper by Einstein in this connection.
I know this sounds pedantic but it has to be said. What the radiometer used in your paper measures is the radiation from gases that emit electctromagnetic radiation because they have T>0K. What the radiometer doesn't do is measure the 'upwelling' radiation from the same gases. If you could measure the 'upwelling' radiation from the same gases then you would be able to determine how much energy was being transferred and in which direction; only then would you be able to work out what was happening to the temperatures at the various locations of interest."
When you say 'energy associated with heat is... exchanged... by absorption and emission of radiation', you need to qualify it with the fact that only greenhouse gases do any absorbing or emitting. Again, it's not just that gases emit because they have T>0K. N2 and O2 do next to no emitting and their energy has to be transferred by collision to a GHG in order to be radiated away.
Also, radiation is emitted isotropically; if you measure a certain downward flux, you can be sure that the 'layer' of the atmosphere you're measuring is emitting the same flux upwards.
I think Tom Curtis has answered your other points nicely.
-
adelady at 01:28 AM on 31 March 2011Arctic Ice March 2011
Rats, it's past my bedtime. If someone wants to do the link properly, go ahead. I'm off. -
adelady at 01:27 AM on 31 March 2011Arctic Ice March 2011
drjc, I don't know about "safe, but it would be reassuring if we were to see 3 out of 5 years above the 2 standard deviation range rather than below it.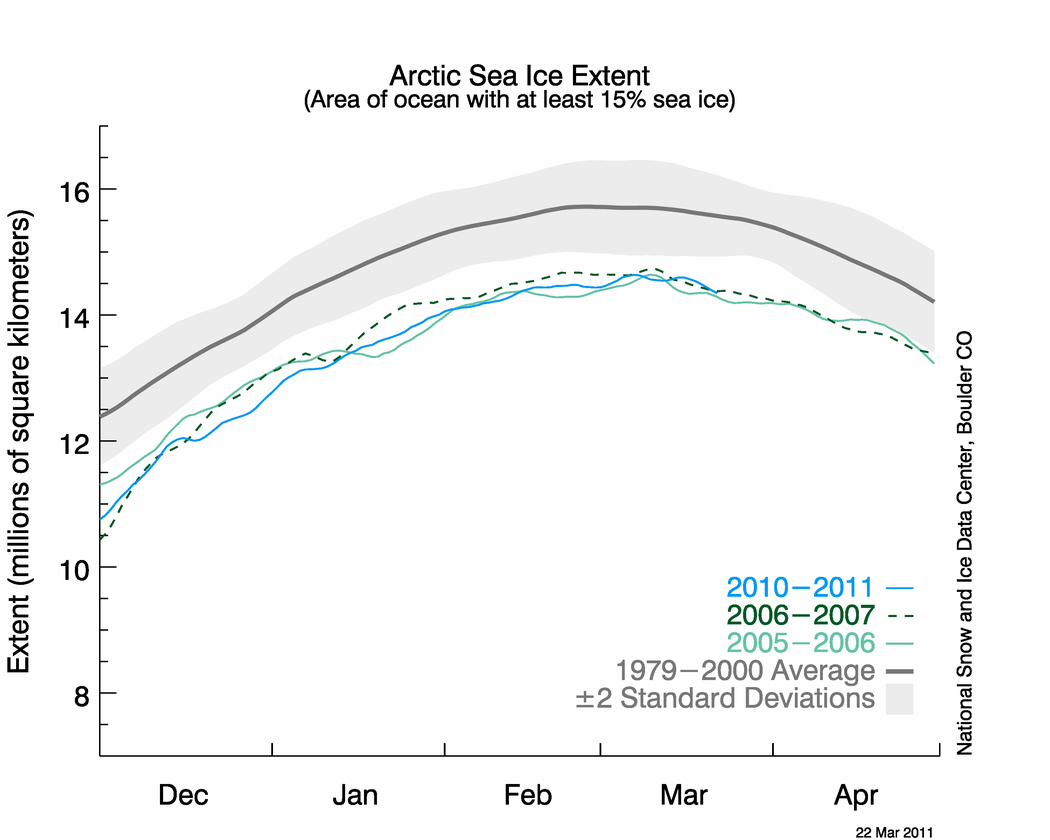 Moderator Response: [DB] Hot-linked image.
 -
adelady at 01:16 AM on 31 March 2011Arctic Ice March 2011
Ken, I find it handy to think of the Arctic as a bottleneck for heat. Atlantic currents drive warm water northwards which just happens to be towards a smaller and smaller area because of the NH land mass. So all that warmth has to find somewhere to go. For a few decades it's been more or less invisible because the ice has been soaking it up from underneath. But all good things must come to an end. So much warmth has gone into thinning the ice that it is finally giving up. It's breaking up into slush in many places, it's not forming the former massive slabs it used to. And those smaller, thinner pieces of ice are more vulnerable to winds, tides and currents that formerly used to circulate around, over and beneath the ice shifting and compressing most of it and moving just the edges away. Now those "edges" are all through the no-longer-packed ice and the winds and currents have free rein to move damaged ice further and faster out of the Arctic area. -
Dr. Jay Cadbury, phd. at 01:04 AM on 31 March 2011Arctic Ice March 2011
So there has been a lot of concern about arctic ice, what level of ice would be considered a safe amount. -
Bern at 00:45 AM on 31 March 2011Understanding Solar Evolution Part 2: Planets
BP: technically possible, but would it ever happen? Given the warnings given by scientists about problems a century hence due to global warming, and the marked lack of action by world governments, I hold grave doubts that they'd work to prevent a problem a few hundred million centuries down the track. :-P I recall a Larry Niven novel (Ringworld, I think) where a species of aliens was moving their entire solar system out of the galaxy due to some impending catastrophic wave of supernovae... that's probably beyond us at this point in time, but a billion years from now, if we're still around? -
Ken Lambert at 00:11 AM on 31 March 2011Arctic Ice March 2011
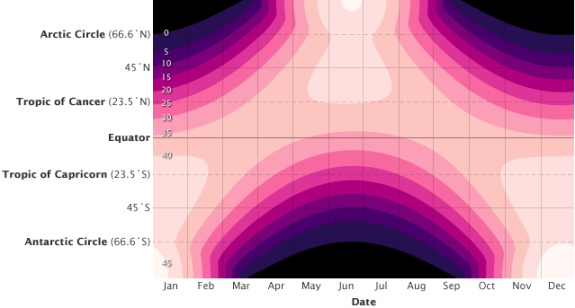
Graphical stories on Arctic sea ice melt regularly appear on SKS and seem to assume undue importance when the heat energy involved is considered. Only about 7% of the earth's surface is above 60 degrees North. Of the purported Earth's warming imbalance of 145E20 Joules/year, only 1E20 Joules/year is accounted for by the reduction in Arctic sea ice. That is only 1/145 of the claimed heat being gained by the Earth due to global warming. The problem is trying to find where is the other 144/145ths.Moderator Response:[DB] Actually, when the heat energy is considered, during the Arctic melt season more energy is delivered to the Arctic than the tropics (due to the much longer periods of daylight available):
-
Ken Lambert at 23:51 PM on 30 March 2011A climate 'Gish Gallop' of epic proportions
CBD #17 "The point being that these values are not just randomly spit out of a climate model in complete isolation. Each is checked against real world data to whatever extent possible." Quite right CBD. The emphasis is on 'to watever extent possible', The famous Trenberth diagram of energy flows shows TSI of approx 340 incoming, roughly 100 reflected and 240 outgoing. Finding 0.9 in 240 is 0.375%. Are any of these quantities being measured to this accuracy? A small change in reflection due to cloud changes can have a big effect on a difference as small as 0.9. These are very good questions for Dr Trenberth - exactly which of the numbers are really solid and which are implied to produce the imbalance of 0.9. -
Tom Curtis at 23:45 PM on 30 March 20112nd law of thermodynamics contradicts greenhouse theory
damorbel @881, I find your comment bizarre on two counts. First, the absorption strengths at different frequencies for all common, and most uncommon atmospheric components is well documented in the HITRANdatabase. Because of that, except in those areas of overlapping absorption, the actual molecules emitting the down welling IR radiation is easily determined, as indeed is the average altitude from which the gas emissions originated. So to a significant degree of accuracy, the downwelling IR radiation tells us a great deal about the kind of material - including its temperature (from its brightness temperature) and pressure (from pressure broadening)- that emitted the radiation. Second, you talk as though observations have not been made from above the locations of observed downwelling spectra. Indeed, you do so despite the fact that downwelling and upwelling spectra from the same location are shown in figure 1 of the intermediate version of the article above. These observations have been made not only by satellite, but also by aircraft from a variety of altitudes. Here, for example, are spectra obtained by an aircraft flying at 3.7 km altitude over the North Sea: And a comparison of those spectra with model results:
 The large spike at the point at which CO2 emissivity is highest is because the cabin temperature was slightly higher than the air at that altitude, as discussed in the paper. It illustrates the point, however, that except at the frequency of greatest emissivity, radiation emitted in the atmosphere will travel hundreds of meters, and even several kilometers before being absorbed (on average). So, "to summarize", energy is constantly being exchanged in the atmosphere between adjacent molecules by collision and radiation, and between very distant molecules at a much slower rate by radiation.
In fact, the concept of "back radiation" is not premised on the radiation coming from high in the atmosphere (you are wrong about that); but your claimed refutation is based on an error. This may be a case of an ugly fact wrecking Einstein's beautiful theory, but I suspect the fact is just wrecking your misinterpretation of Einstein rather than the master himself.
The large spike at the point at which CO2 emissivity is highest is because the cabin temperature was slightly higher than the air at that altitude, as discussed in the paper. It illustrates the point, however, that except at the frequency of greatest emissivity, radiation emitted in the atmosphere will travel hundreds of meters, and even several kilometers before being absorbed (on average). So, "to summarize", energy is constantly being exchanged in the atmosphere between adjacent molecules by collision and radiation, and between very distant molecules at a much slower rate by radiation.
In fact, the concept of "back radiation" is not premised on the radiation coming from high in the atmosphere (you are wrong about that); but your claimed refutation is based on an error. This may be a case of an ugly fact wrecking Einstein's beautiful theory, but I suspect the fact is just wrecking your misinterpretation of Einstein rather than the master himself.
-
CBDunkerson at 23:43 PM on 30 March 2011A Plan for 100% Energy from Wind, Water, and Solar by 2050
Bern #61: The other factor generally impacting coal prices (after "digging it out of the ground") is transport costs. Oil and natural gas can be transported through pipes and/or in and out of containers fairly quickly. Coal needs to be carted around by trains and trucks and requires big shovel loaders to load and unload. Thus, any time you can put the power station by the coal mine (as would apparently be common in Australia based on your example) it means much lower costs. Hence the 1/3rd market rate you refer to... coal from abroad would add massive shipping costs. Hawaii is probably the most extreme example in the other direction. Transporting coal across the ocean to Hawaii would be prohibitively expensive, so instead they have long gotten most of their electricity by burning oil... its higher extraction cost being offset by much lower transport costs. Fortunately they are now starting to shift over to locally generated renewable power, since it is now actually cheaper than getting any of the fossil fuels to the island. -
Gilles at 23:22 PM on 30 March 2011A Plan for 100% Renewable Energy by 2050
whoops something wrong with my answer ?I was just asking adelady which CH4 concentration she expected by 2020, 2030, 2040 and 2050 ?Moderator Response: [DB] Too far off the topic of this post. -
CBDunkerson at 23:18 PM on 30 March 2011The Washington Times Talks Greenhouse Law
I wasn't sure where to put this, but since it is another example of legal maneuvering around global warming I thought this thread might be appropriate; Tennessee teaching law Basically, Tennessee is on the verge of passing a law which prohibits schools from disciplining teachers who 'examine the strengths and weaknesses' of 'controversial' issues like global warming and evolution. Obviously, this is meant to allow the usual propaganda nonsense to be introduced into school classrooms, but I have to wonder if it wouldn't also be an opportunity. Imagine a teacher in Tennessee walking into class after this is passed (if it is) and calmly going through a list of global warming 'skeptic' arguments and showing how they have been fabricated, misrepresented, et cetera. Said teacher would then be protected from any reprisals by the very law meant to spread this nonsense... they were merely pointing out the weaknesses of one of the sides in the 'controversy', namely that the arguments it advances are provably false. If the matter then ends up in a court of law there are firmly established standards (e.g. Frye, Daubert, Federal Rules of Evidence) which require that scientific testimony be limited to well established information... by criteria that would exclude virtually the entirety of global warming 'skepticism'. It seems to me that, as with various examples of demonstrably false 'skeptic' testimony to Congress, there has been a tendency to 'let things slide'. Rather we should pursue something more like the course taken by the 7 states in the suit discussed in the article above. Take the fight to the skeptics... in the classroom and the courtroom. Because the simple fact is that they don't have a leg to stand on once you take away the reams of misinformation in the 'denialsphere'. Get it on the legal record that 'global warming skepticism' is as fictional a 'science' as intelligent design and it becomes harder to spread this nonsense and easier to stomp it out. -
quokka at 23:17 PM on 30 March 2011A Plan for 100% Energy from Wind, Water, and Solar by 2050
#60 Ger Nuclear power plants can be built to load follow. From the Areva web site: "Load follow: between 60 and 100% nominal output, the EPR™ reactor can adjust it power output at a rate of 5% nominal power per minute at constant temperature, preserving the service life of the components and of the plant." Obviously, running an NPP at less than maximum capacity factor is an economic decision, but it may be quite viable to a limited extent depending on the pricing mechanisms in the specific electricity market. -
Berényi Péter at 23:13 PM on 30 March 2011Understanding Solar Evolution Part 2: Planets
"By then, Earth will be incinerated". Not necessarily. It depends on how hard posterity is willing to work. ASTROPHYSICS AND SPACE SCIENCE, 2001, Volume 275, Number 4, 349-366 DOI: 10.1023/A:1002790227314 Astronomical Engineering: A Strategy For Modifying Planetary Orbits D.G. Korycansky, Gregory Laughlin & Fred C. Adams Revista Mexicana de Astronomía y Astrofísica, 2004, diciembre, volumen 022 Universidad Nacional Autónoma de México ISSN (Versión impresa): 0185-1101 MÉXICO ASTROENGINEERING, OR HOW TO SAVE THE EARTH IN ONLY ONE BILLION YEARS D. G. Korycansky -
Bern at 23:11 PM on 30 March 2011A Plan for 100% Energy from Wind, Water, and Solar by 2050
Ger @ #60: nuclear plants can actually throttle their electrical power output very quickly, by blowing steam through condensers rather than through a turbine. Not having to pay for expensive fuel to generate the steam in the first place means it's quite economical to do this. It's also very fast - you can go from 100% to 0% in a matter of minutes (basically as fast as the electrical network will allow the shift in load to happen). I'm not sure how long it takes to ramp up load in that situation, but you're already generating the steam, so it's just a matter of opening valves to send more to the turbine. I understand that many reactors can actually be throttled quickly, too - on the order of hours. But I believe you're correct, in that it takes days to fire one up from scratch. Either way, there are still massive thermal losses between energy source and electricity consumer, as you pointed out. I'm with you, though - well-designed solar thermal can provide massive amounts of heat to individual homes, even in cold climates. -
Bern at 22:54 PM on 30 March 2011A Plan for 100% Energy from Wind, Water, and Solar by 2050
johnd: the effective price of coal for most power stations in Australia is, as far as I'm aware, the cost of digging it out of the ground. I believe there was a recent example in NSW where the state government sold the power station, but decided to continue to operate the mine, because no contractor would dig coal and supply it to the power station for the agreed price. I'll have a dig for the article, but from memory the price was ~$40/tonne supplied to the power station, compared to a market price for coal of $115-$118/tonne, if you were to deliver it to overseas buyers. Some of the other commentators could be right, though, a large part of the difference may be due to the spot/contract price differential. -
CBDunkerson at 22:52 PM on 30 March 2011A climate 'Gish Gallop' of epic proportions
Ken, you are correct about the CERES measurements, but still lack foundation for your conclusion that 'positive warming imbalance is in question'. There are too many other measurements confirming this imbalance. Consider the standard 'Trenberth diagram' of various energy flows within the climate system. These values were not just made up, but rather each is based on measurements and analysis. That is, we have long measured incoming solar radiation and identified its range of fluctuation (fairly small)... measurements of increased 'back radiation' from the greenhouse effect have been taken at the surface and found to correlate with expected results from the models, as have satellite measurements of decreased outgoing radiation in the same bands. Et cetera. The point being that these values are not just randomly spit out of a climate model in complete isolation. Each is checked against real world data to whatever extent possible. Yes, there are many uncertainties, but when all available data points to a positive warming imbalance there are simply no grounds for claiming that imbalance is in question. -
Ger at 22:42 PM on 30 March 2011A Plan for 100% Energy from Wind, Water, and Solar by 2050
#48 Sean A. Without the hot air, well we need hot air as well for heating purposes (or cooling purposes). You will probably also know that about 50% of the energy in the fuel used for electricity goes up in to the air, as the hot air and into the cooling water requirements. Also large part goes away into the distribution lines. The general published figure of a 5% is the loss only in the high tension line (>= 69 kV), if it is transformed down to user level, the more likely figure is a 12%. About using nuclear plants: those are inherently bad in regulating their power output. Shuting down or going on-line takes days. Even a coal fired plant is doing much better with regulating measured in hours (5-6) instead of days. Those base-power plants do need a large grid to operate efficiently. -
Bern at 22:36 PM on 30 March 2011Why we have a scientific consensus on climate change
TonyM, you're getting things a little backward. The science of AGW isn't robust because we have consensus amongst climate scientists - we have consensus amongst climate scientists because the science of AGW is robust! In that regard, the consensus is merely an indicator for non-scientists that there is a very high probability that the AGW hypothesis is correct. It's not evidence supporting AGW in & of itself, though there's plenty of that around. Regarding the CO2/temperature thing - you're forgetting thermal inertia. Current radiative forcing is ~1.6 W/m2, if I recall correctly. To heat the oceans by 1ºC takes a phenomenal amount of energy - multiplying 1.6W/m2 by the surface area of the earth (~510e12 m2) is a lot of energy, sure (about 816 TW, if I've done my sums right), but it's only enough to heat up the mass of the oceans by ~0.005ºC per year (assuming complete mixing, of course!). On that basis, you'd expect ~0.5ºC per century. We're currently seeing about three times that, I think, which is mostly down to the oceans not being well-mixed (plus some of the heat gets absorbed by the land & atmosphere). So, basically, it takes centuries at best, and possibly millennia, for the full warming effect to be realised. This is why focussing on projected warming to 2100 is a dangerous thing. The scientists do it because it's a handy reference point, far enough out to see some real effects that they can highlight to policy-makers. But in the high-emissions (or business-as-usual) scenarios, warming doesn't end there, by any stretch of the imagination. -
quokka at 22:27 PM on 30 March 2011A Plan for 100% Energy from Wind, Water, and Solar by 2050
#56 Johnd, I'm no expert on coal price, but I think Australian generators would be supplied under long term contracts. Under such contracts, the price could well be a lot lower than the current "spot price" which would behave more like oil prices with rapid fluctuations due to things like supply disruptions (eg floods) and weather conditions (eg very cold winter). Incidentally, there is a trend towards the trading of a much higher volume of coal futures contracts. Whether this is a sign that we might be heading to more volatile coal prices in the future might be worth considering. Hopefully such volatility might be something of a disincentive to build more coal burners. -
Ger at 22:14 PM on 30 March 2011A Plan for 100% Energy from Wind, Water, and Solar by 2050
#46: actual thoughtful- we don't disagree, just mentioning that using solar heat in combination with a heat pump is reducing the CO2 footprint. Expensive is not the renewable electricity, expensive is getting it into your place through the old-fashioned type of distribution networks. Those networks do require so many regulations and securities from the generators of large scale power generation that it will increase the generation costs by a factor of two. Renewable energy (especially from wind and solar) have the additional disadvantages that is "fuel" supply is bad to control and (for biomass) that the power density is rather low (lots of moving of biomass to get your MW). -
JMurphy at 22:08 PM on 30 March 2011The Day After McLean
Are there any so-called skeptics, or their favourite websites, taking bets on this ? I fancy a wager... -
Bern at 22:07 PM on 30 March 2011Understanding Solar Evolution Part 2: Planets
Another interesting post, thanks Chris! Would conditions on Venus have ever been cool enough to allow a period of liquid water conditions? Or was insolation high enough to always push it to runaway greenhouse conditions? -
Berényi Péter at 22:06 PM on 30 March 2011Of Satellites and Air – A Primer on Tropospheric temperature measurement by Satellite
Re: Moderator Response:I don't know anything about the long-term global stratospheric temperature trend, it is not even measured properly I guess. At the same time trend for the last 32 years (the "satellite era") is down indeed, as measured by brightness temperature in channel TLS of MSU/AMSU devices. However, science is never about the big picture, in fact not about any picture at all. It is about propositions and truth-values (True/False) attached to them. Sweeping generalizations like "stratospheric temperature trend is down, while the level of CO2 in our atmosphere is up therefore temperature changes are driven by CO2" as suggested in your comment are only good for misleading the general public by showing them a gross picture, but unsuitable for actually understanding what's going on and deriving true and meaningful propositions about the system. ( -Off-topic dissembling snipped- ) We have reliable data for the last 32 years, that is, since the beginning of 1979 till February 2011. And yes, temperatures up there have decreased. However, they've done it in a curious manner. All the decrease happened in two distinct steps, one in 1982-85 the other in 1991-94. Otherwise the temperature curve of lower stratosphere is pretty flat with no trend at all, especially so during the second half of the entire 32 year record. These events are clearly identifiable as major volcanic eruptions (El Chichón, April, 1982 & Pinatubo, July, 1991). What happens is actually a huge initial transient increase in stratospheric temperatures that lasts for about two years followed by a decrease that is larger than the increase was. That is, the stratosphere, after a two years long transient ends up in a state with lower temperatures than the one it was assuming prior to the eruption. Of course the stratosphere can't get ever colder with each major eruption, so there must be some recovery on a multi-decadal scale, but three decades are just too short to give a good estimate of the relaxation time involved (other than a lower bound). To see this process more clearly let's have a closer look at the El Chichón event. The image below shows the CO2/TLS phase diagram around this event with monthly resolution. The eruption itself is marked by a red dot on the trajectory, the transient is in yellow while (meta)stable states before and after the event are in different shades of blue.Due to the paucity (love that word) of water vapor in the stratosphere, the radiative imbalance of the Earth allows CO2 to freely exert it's GHG effects by cooling the stratosphere. As the clear RSS graphic I have shown twice now starkly delineates, the long-term stratospheric temperature trend is down, while the level of CO2 in our atmosphere is up, driving up the temperature of the lower troposphere and our oceans with it.
 As you can see the before and after states occupy two markedly disjoint regions of the phase space. The projection of these regions to the CO2 axis do overlap (between 340 and 345 ppmv), but even there, they're separated by temperature (0.4°C on average). During the 8 years following the initial transient excursion (but before Pinatubo) TLS is not decreasing further. The trajectory meanders to ever higher CO2 concentrations, but the temperature remains stable or if anything, slowly (and hesitantly) climbs back toward the level from where it started before the eruption. It just did not have the time to accomplish this task before another eruption hit.
It is an interesting scientific question what physical process mediates the multi-decadal stratospheric cooling effect of major eruptions. Unfortunately it is a question that mainstream climate science, trapped by the old CO2 paradigm, failed to address so far.
Moderator Response: [DB] You identify a number of different topics which are best discussed elsewhere (like volcanoes, for example). If you wish to pursue them, do them elsewhere. If you believe the satellite record is unreliable, then there's threads delving into that topic that perhaps you've missed. Otherwise, you can't use the satellite data to disprove the trend of the satellite data and expect anyone to take you seriously.
As you can see the before and after states occupy two markedly disjoint regions of the phase space. The projection of these regions to the CO2 axis do overlap (between 340 and 345 ppmv), but even there, they're separated by temperature (0.4°C on average). During the 8 years following the initial transient excursion (but before Pinatubo) TLS is not decreasing further. The trajectory meanders to ever higher CO2 concentrations, but the temperature remains stable or if anything, slowly (and hesitantly) climbs back toward the level from where it started before the eruption. It just did not have the time to accomplish this task before another eruption hit.
It is an interesting scientific question what physical process mediates the multi-decadal stratospheric cooling effect of major eruptions. Unfortunately it is a question that mainstream climate science, trapped by the old CO2 paradigm, failed to address so far.
Moderator Response: [DB] You identify a number of different topics which are best discussed elsewhere (like volcanoes, for example). If you wish to pursue them, do them elsewhere. If you believe the satellite record is unreliable, then there's threads delving into that topic that perhaps you've missed. Otherwise, you can't use the satellite data to disprove the trend of the satellite data and expect anyone to take you seriously. -
damorbel at 20:03 PM on 30 March 20112nd law of thermodynamics contradicts greenhouse theory
Re #876 Stu you wrote:- "Glass is also opaque to thermal infrared. No-one's joking, you just need to be aware that absorptivity is a function of wavelength." True, but the link doesn't say that or give any figures for different wavelengths, so I do not understand what you are driving at. In the case of water, evaporation is by far the dominant heat loss mechanism for incident radiation, even Trenberth's diagram show's this. You can easily discover the figures for yourself by checking world wide rainfall; the heat needed to evaporate water is deposited in the atmosphere when it condenses. Further "Well, can you explain measurements of downwelling clear-sky longwave radiation without it being 'back radiation'? If it's not back radiation, what is it" I have read the paper you linked plus the description of the radiometer used and it merely confirms what I wrote in #875. To summarise, the energy associated with heat is constantly being exchanged between (adjacent) molecules both mechanically by (elastic) collision and electromagnetically by absorption and emission of radiation; somewhere there is a link to a paper by Einstein in this connection. I know this sounds pedantic but it has to be said. What the radiometer used in your paper measures is the radiation from gases that emit electctromagnetic radiation because they have T>0K. What the radiometer doesn't do is measure the 'upwelling' radiation from the same gases. If you could measure the 'upwelling' radiation from the same gases then you would be able to determine how much energy was being transferred and in which direction; only then would you be able to work out what was happening to the temperatures at the various locations of interest. Measuring the 'downwelling radiation' tells you almost nothing because you are far from sure about what kind of material (pressure; density; temperature etc. - for a gas) is emitting this radiation (thus you don't know its emissivity) and where it is. The difference between 'back radiation' and the real world is that, in the real world radiation is emitted and absorbed locally, as explained by Einstein, and the world of back radiation where it comes from 'up there'! -
Gilles at 18:33 PM on 30 March 2011Dana's 50th: Why I Blog
SNRatio : are you really stating that the climate sensitivity is a "real" random variable, comparable to the Poisson noise of a quantum detector, that is, there is absolutely no chance of determining it more precisely that the current uncertainty ? sorry but you're still confusing me even more... -
Stu at 18:22 PM on 30 March 20112nd law of thermodynamics contradicts greenhouse theory
damorbel: "In practical terms the propagation of light in transparent materials..." I presume this might be where you're having trouble... in the relevant part of the spectrum (thermal infrared) water is opaque, not transparent or even translucent. It absorbs all thermal infrared incident upon in within a few tens of microns of the surface (apart from the small fraction that it reflects). Glass is also opaque to thermal infrared. No-one's joking, you just need to be aware that absorptivity is a function of wavelength. I haven't been following your discussion, only jumped in here, but I see you say 'if back radiation really exists...' Well, can you explain measurements of downwelling clear-sky longwave radiation without it being 'back radiation'? If it's not back radiation, what is it? Here's a paper that quantifies downwelling clear-sky longwave radiation as measured during Antarctica's polar night: http://journals.ametsoc.org/doi/pdf/10.1175/JCLI3525.1 I do hope you don't just dismiss these two points out of hand by simply saying 'it can't be valid' or 'it's absurd'. -
Arkadiusz Semczyszak at 17:56 PM on 30 March 2011Muller Misinformation #1: confusing Mike's trick with hide the decline
@ Albatross Are skeptics comments on this site - post - are "off topic"? If we answered "yes " to this question, we would have to conclude that this post John Cook is "off topic" ... “On the occasion” of Climategate he tries to "offer" us previews of AGW supporters eg the "divergence problem" by ignoring the most recent (after 2008) work - papers on this topic. Criticizing Muller - He criticizes (again "by occasion”) opinions of skeptics on the MWA and the LIA. Similarly doing CBDunkerson "along with " disparaging opinions Lindzena and Spencer and the main arguments of skeptics (without the “right to reply” - because it is "off topic" - of course). Is this okay? You can not refuse the "right the reply" skeptics on these matters - if you do it try to "smuggle" through “the back door "... I appeal to supporters and adversaries AGW - by non-use of such "tricks ".Moderator Response: [DB] Please read the moderator response this comment. -
damorbel at 17:56 PM on 30 March 20112nd law of thermodynamics contradicts greenhouse theory
Re #876 RW1 you wrote:- "I would but I'm not quite sure exactly what you're asking. How much is transferred kinetically?" That is the question I asked you. But I will accept evaporation and convection as 'kinetic'. -
damorbel at 17:51 PM on 30 March 20112nd law of thermodynamics contradicts greenhouse theory
Re #877 Stu you wrote:- "Care to explain what the refractive index of a substance has to do with its reflectivity?" All materials, transparent or not have a refractive index, it is just that some are so opaque that transmission is dominated by absorption and incoherent scattering. In practical terms the propagation of light in transparent materials is governed by the Fresnel equations you will see on the link that a beam of light arriving at a 'change in refractive index' - normally one thinks of air/glass with RI for air = 1.0 and RI for glass = 1.4 - 1.7. At the surface of the glass some of the light is reflected and some passes into the bulk of the glass. In this case the RI of air is very low so the amount reflected depends on 1/the RI of the glass and 2/the angle the beam is incident on the glass. So, if back radiation really exists, it would be reflected by any surface, liquid or solid, just like the sunlight in Trenberth's diagram. Further you wrote:- " think the key quantity you should be focussing on is absorptivity, which by Kirchoff's law is always equal to emissivity at a given wavelength. In the thermal infrared (the pertinent wavelength), the emissivity of water is about 0.95" The only problem I have is the figure 0.95 you cite for water. Yes, that is what it says in your link. I have no idea how this figure was obtained, it cannot possibly be valid for water, other transparent materials in the list have similar figures. Light incident on material can either be 1/reflected; 2/absorbed; or 3/transmitted. You clearly know that absorptivity(a) = 1 - reflectivity(r), and emissivity(e) = a What is missing here is transparency(t), light can also pass through material (glass etc.) without being absorbed (much) or reflected (much). So how the compilers of the table in your link can give a figure of 0.95 as the emmisivity of pyrex glass, I do not know, it is absurd, it is higher than the figure given for carbon, is someone joking? -
TonyM at 17:41 PM on 30 March 2011Why we have a scientific consensus on climate change
Consensus – it would never be considered part of modern science and the scientific method. To me, going back to first principles always tends to shed some enlightenment. Science is most fundamentally about observation, hypothesising and experimentation of a controlled and repeatable nature. Without the latter it certainly is not science – at least not my understanding of it. Many fields of study call themselves a Science (like Social sciences etc) from the Latin “scire” to know but that has a very different meaning to orthodox science. One can have scientists working in many fields including management but that does not make those fields science. As an illustration of consensus the aether “theory” was “well founded.” Michelson and Morely carried out some brilliant experiments in the late nineteenth century to prove its existence. Their experiments proved otherwise but, it still took years for the consensus to dissolve and abandon the aether. As a novice surely no one can dispute that we must contribute to carbon based emissions – intuitively it seems so (deforestation, industrialisation, population etc) but more importantly the data confirms it through C isotope measures. But that is a different question to AGW of an extreme type. Consensus is not the answer (that doesn't mean scientists don't talk about it but consensus measures seem quite silly). One question puzzles me about the CO2/temp hypothesis. Given that there has been an increase of over 100ppm of CO2 in the last 200 years and the current level is about 30% higher than at any time in the last 500K years why is our current temperature not the highest temperature of that period. -
nigelj at 17:31 PM on 30 March 2011The Day After McLean
What do you do when you are a third rate scientist, who has published a failed paper based on a failed ludicrous idea you know was failed before you published? Or I hope he knew otherwise Im mystified how he ever graduated. You talk nonsense to get attention and get a buzz. Afterall its either more of the same, plunge on regardless, or an embarrasing admission of error. ( -Snip- ).Moderator Response: [DB] Please take the high road on this. Thanks! -
adelady at 17:23 PM on 30 March 2011A Plan for 100% Renewable Energy by 2050
Gilles acceleration of temperature increases? I'll go with the IPCC until about 2040. I will die during the 40s (if I've made it that far) so I won't see it, but I expect a fair bit of methane /clathrate release starting in the 30s. (Presuming we haven't got our CO2 release and sequestration act together by that point.) All bets about temperature are off for me at that point. -
Marcus at 17:15 PM on 30 March 2011A Plan for 100% Energy from Wind, Water, and Solar by 2050
"Can you provide some figures as it surprises me given our commitment to free trade." The commitment of Western nations to "free trade" is not as great as some would make out. If we were committed to free trade, then we wouldn't be so heavily subsidizing the cost of mining & transporting coal-by, amongst other things, giving the miners massive rebates on diesel fuel. Bern is correct that the domestic coal-fired electricity industry in Australia has greatly benefited from its 100% State Ownership & its virtual monopoly in the electricity market-which is why I find protests about subsidies for the renewable energy industry so hypocritical. -
Gilles at 16:58 PM on 30 March 2011A Plan for 100% Renewable Energy by 2050
scaddenbp : I will readily answer your question, but you said "half the coal" , but this is very vague : half of which coal ? -
Albatross at 16:34 PM on 30 March 2011Muller Misinformation #1: confusing Mike's trick with hide the decline
Shawn @76, "Does this discussion go anywhere or do we just all agree that all "skeptics" are evil and pat ourselves on the back?" No, not at all. I for one certainly do not hold that opinion that you tried to attribute to people here about all "skeptics" being "evil". You strike me as a fairly reasonable person-- I am trying to encourage you to apply your skepticism equally...to be a true skeptic. Muller has also made similarly inaccurate statements about Gore and other scientists in recent weeks....I sense a pattern of sloppiness on Muller's part, and perhaps even an eagerness to bring his political views into play in a discussion of the science. Remember, Muller is one of the science leads in the much touted BEST project. Ideally, this independent study of global temperature records will avoid being used as a political tool and avoid becoming mired in rhetoric and opinion. So Muller's recent misguided public musings on the climate file are very worrying and far from trivial, and does not given people much hope that BEST will value the science above all else. I do remain hopeful that science will prevail though, and that the "skeptics" will unequivocally accept their findings. Anyway, time to sign off, have a good night Shawn. PS: You can respond to dhogaza, but probably on the appropriate thread. I provided a link to one such thread @68. Just leave a note here directing those interested in discussing the "divergence problem" to the relevant thread. -
shawnhet at 15:47 PM on 30 March 2011Muller Misinformation #1: confusing Mike's trick with hide the decline
I can't really express myself here so I think there is not much point continuing. At best, the whole issue here is pretty trivial IMO. I think that, at no point was Muller attempting to claim that the two techniques were identical and he may've simply got confused about who was "hiding the decline". But, nevertheless, let's say I drink the Coolade and go for the position that he was [--snip--] about something that was pretty easy to check - What now? Does this discussion go anywhere or do we just all agree that all "skeptics" are evil and pat ourselves on the back? Dhogaza, I *literally* cannot respond to you, I will simply say that the post that you quote was written quickly and should be judged accordingly. -
Albatross at 15:15 PM on 30 March 2011Muller Misinformation #1: confusing Mike's trick with hide the decline
Shawn @73, Perhaps some simple and direct questions are in order. 1) Did Muller accurately and correctly reflect the content and true meaning of the emails to which John is referring? Yes or no. 2) Do you agree with John Cook's assessment of Muller's errors? Yes or no. 3) Do you agree with this statement by Cook concerning Muller's misguided understanding of events: "To conflate two separate techniques via the phrase "Mike's Nature trick to hide the decline" is adding to the glut of 'Climategate' misinformation." Muller could have easily avoided making the mistakes and perpetuating yet more Climategate/SwiftHack myths had he actually practiced due diligence, done some research, and read the reports on the Climategate/SwiftHack. Instead, it seems that Muller elected to source his "information" from notorious "skeptic" blogs. That is not acceptable on an issue this important, especially by someone of Muller's standing. And John has not even covered the myriad of other misleading statements made by Muller in his talk. -
johnd at 15:14 PM on 30 March 2011A Plan for 100% Energy from Wind, Water, and Solar by 2050
Bern at 15:00 PM, excuse me for butting in, I just had a spare moment, and something jumped out of your post, so I hope it hasn't been addressed earlier. In what way do you mean "Given that coal for generation in Australia is "sold" to the generators for about a third of the going market rate,". Can you provide some figures as it surprises me given our commitment to free trade. -
dhogaza at 15:12 PM on 30 March 2011Muller Misinformation #1: confusing Mike's trick with hide the decline
Sure, tree rings correlate well with temperature except when they don't. It is the parts where they don't correlate that causes problems for the idea that tree rings are good proxies. If you found a group of perfectly preserved tree rings from a time period where you didn't have independent means of assessing the temperature, could you use their widths to determine the temperature?
Naked tree ring widths aren't the proxy ...Come on, Albatross, I am familiar with the issues relating to the divergence problem, which as I said previously, was what I was focusing on.
Making this a false statement. -
Ken Lambert at 15:12 PM on 30 March 2011A climate 'Gish Gallop' of epic proportions
Ken Lambert #10, #11 dana1981 and CBD: Any futher comment or am I to assume that my points are accepted as correct? -
Ken Lambert at 15:11 PM on 30 March 2011A climate 'Gish Gallop' of epic proportions
Well that's settled then Thanks DB. Glad we agree on something at last. -
Bern at 15:00 PM on 30 March 2011A Plan for 100% Energy from Wind, Water, and Solar by 2050
Ken Lambert: er, no, I never suggested you need $150/t carbon pricing to make solar competitive. I was saying if you factored in the externalities of carbon dioxide pollution, then you'd be looking at a $150/t carbon price, and if this was in place, all other generation technologies would be cheaper than fossil fuels. I'm not sure what carbon price is required to make current Solar PV cost-competitive with baseload coal generation. It may indeed be $150/t, it may be less. Given that coal for generation in Australia is "sold" to the generators for about a third of the going market rate, it's a complex question. In any event, more knowledgeable people than I are predicting that it will be cost-competitive without a carbon price within 10 years. If you then consider that Solar PV is one of the most expensive renewable energy sources out there, I think the argument for supporting expansion of coal-fired generation is kind of weak, to say the least. I do agree with what you say about the "privatisation" of the electricity infrastructure, though - if there was ever such a thing as a 'natural monopoly', then electricity distribution networks are it! K T: indefinite exponential economic growth is going to come to an end soon anyway, and the sooner the 'head honchos' realise that, the better... To conduct a ludicrous thought experiment: exponential growth being what it is, if current population growth rates continued, for example, we'd be down to 100m2 of land per person globally somewhere around the year 2500, down to 10m2 per person a bit after 2700, and down to 1m2 of land each by 2930 or so. By 2980, you'd need to share your 1m2 with another person. And that's not counting the loss of land area due to sea level rise. ;-) Given we are starting to have trouble feeding everyone with the 20,000m2 each we have now, that's obviously not going to happen without some amazing new food production technologies. -
shawnhet at 14:37 PM on 30 March 2011Muller Misinformation #1: confusing Mike's trick with hide the decline
Albatross, if talking about the HS is OT, how is the first sentence of #70 not also OT? How can I answer that without going OT? If the point of the OP is that two alterations to the data are exactly the same, then clearly they are not. OTOH, if the point of the OP is that there is no connection btw what was done in both cases, then that is not the case IMO. ( - Off-topic opinion details snipped - ). Now, I've likely gone OT here, but this is my honest opinion.Moderator Response:[DB] Please re-read the OP again, including the first section and the closing paragraph of the OP. The post is not about debating the two techniques used; it's about Muller's repetition of falsehoods about what happened, and what actually happened in real life.
If you wish to discuss the HS or dendro, fine. But not here; there are other threads specifically devoted to them.
-
Bern at 14:24 PM on 30 March 2011Arctic Ice March 2011
Ah, I see where I misinterpreted that part of the article... thanks for pointing that out. Such poor ice condition would tend to lead to rapid break-up of the ice pack, you would think. Will be interesting to see how the extent tracks this year. -
muoncounter at 14:23 PM on 30 March 2011The Day After McLean
Yooper, Yep, the usual response. But here are some things a 'skeptic' could say when caught in such a flub: D'Oh! Never mind! Well, excuse me! Nyuk, nyuk, nyuk Well, here's another nice mess you've gotten me into We're so sorry Nah, not gonna happen. Wouldn't be prudent. -
Albatross at 14:02 PM on 30 March 2011Muller Misinformation #1: confusing Mike's trick with hide the decline
Come on Shawn @71, you can do better than that :) My comment @70 was not OT, I asked you a relevant question about John Cook's assessment (which you ignored), and made an observation about your commentary on this thread. Cheers, :) -
Daniel Bailey at 13:48 PM on 30 March 2011Arctic Ice March 2011
@ Djon & Bern Logicman means the melt season of 2011 will have a month's head-start on that of 2010 due to the much poorer state of the ice currently. Which is why veteran ice watchers such as Logicman feel Maslowski's predictions may now be dated and conservative as the ice conditions seen are much inferior to those present when those predictions were made. And I find myself in agreement with him (L-man). The Yooper -
Djon at 13:34 PM on 30 March 2011Arctic Ice March 2011
Bern, I don't think he means by "I suggest that by mid-April the sea ice will be in a similar condition to that of late August 2010." that the extent will be about the same by mid April as it was in late August 2010. It reads to me as though he was thinking in more qualitative terms when he wrote that. After all, a drop in extent by that much would make the part of his forecast saying "By April 30th, ice extent graphs will show a strong downward trend similar to that of May - June 2010." an incredible understatement. -
muoncounter at 13:31 PM on 30 March 2011Temp record is unreliable
Update to the Berkeley Earth Science Temperature study 'controversy': Watt$ made it up. Anyone surprised?
Prev 1825 1826 1827 1828 1829 1830 1831 1832 1833 1834 1835 1836 1837 1838 1839 1840 Next


