


 Arguments


Recent Comments
Prev 1876 1877 1878 1879 1880 1881 1882 1883 1884 1885 1886 1887 1888 1889 1890 1891 Next
Comments 94151 to 94200:
-
Phila at 13:03 PM on 11 March 2011Examining Hansen's prediction about the West Side Highway
HR: There is nothing I can do if you feel the climate science establishment shouldn't be held to scutiny. This is yet another strawman. I didn't say or imply this, and I don't believe it. Frankly, I don't think you're helping your credibility with this comment. Two other points come to mind. First, AGW has been under incredible scrutiny, as you know perfectly well. I've been following this issue pretty carefully since 1990 or so, so I know that there are few major claims from the consensus side that haven't been challenged, questioned, parsed, anatomized, checked and rechecked repeatedly. That process continues today -- despite efforts to defund or slander the relevant agencies -- and I'm pretty confident that when important adjustments are made to AGW, or its predicted outcomes, they'll come from competent scientists, rather than a flock of willfully ignorant ideologues. Second, "scrutiny" of a scientific theory is valuable laregly to the extent that it comes from informed, intelligent, honest people who are not simply parroting frivolous criticisms they heard on a site like WUWT. We probably don't agree on much, but I hope we can agree on that. -
Tom Curtis at 12:44 PM on 11 March 2011Christy's Unconvincing Congressional Testimony
johnd @16, I find the suggestion that piers would dam the river more than mangroves (the natural river bank vegetation in Brisbane) interesting, but hardly credible. However, the suggestion that changes in geography between 1893 and 2011 rather than, say the 300 mm's (370 at Savages Crossing) rain in three hours dumped onto an already flooded river system are the major oontributor to Brisbane's flood is simply laughable. Below are the rainfall intensity graphs for Helidon (in the Lockyer Valley) and Lowood (just below the Wivenhoe dam wall) to give you some idea of the intensity of the rain involved. The primary flooding in Helidon is associated with the flash flooding in the Lockyer Valley on Monday 10th (google Grantham if you are unfamiliar with it); the peak at Lowood is associated with the second peak that fell mostly on the dam and surrounds. At the same time, Savage's Crossing (just east) received 370 mm in three hours. Note that the white dashed line on the graphs represents the expected intensity of a 1 in 2000 year event.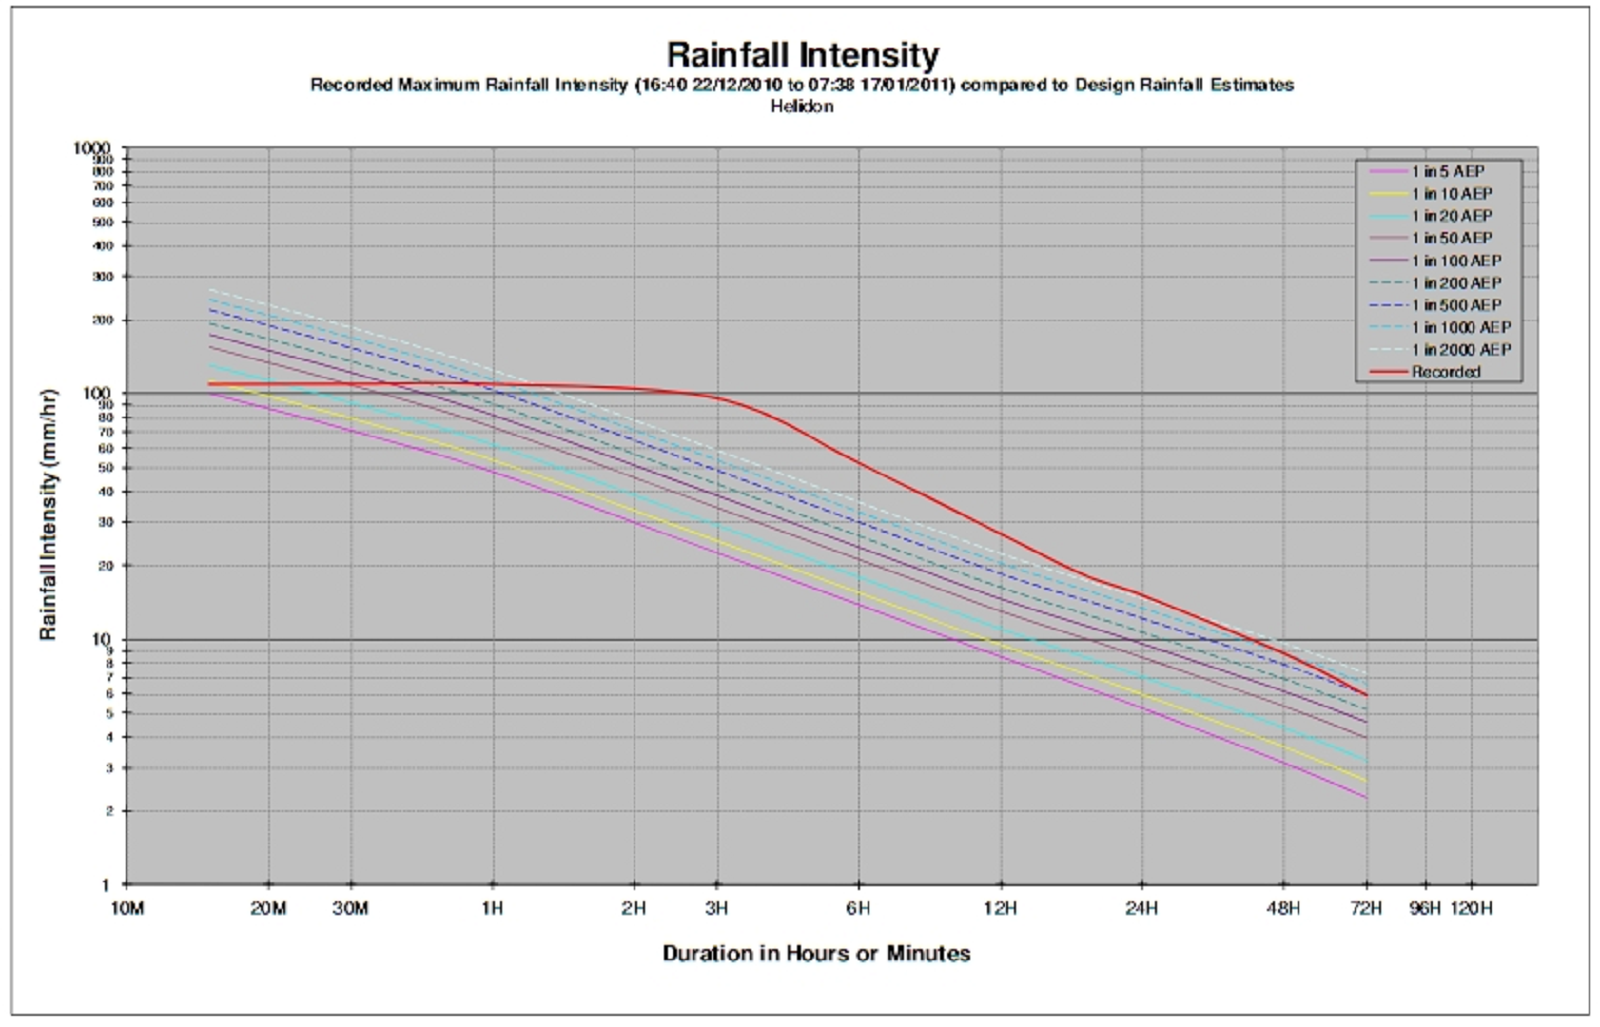

 The Helidon peak is associated with the first peak of inflows into Wivenhoe dam (dark blue line), the one at Lowood with the second peak. The dark red line indicates the peak flow at that location in 1974.
Note, some areas of the catchment did not experience so intense rainfall, so that overall the intensity of the event over the period is about 1 in 200, but it is the peak falls over the Lockyer on the 10th that destroyed the Lockyer valley, and caused most of the flooding; and directly onto the dam and surrounds on the 11th, that necessitated the massive releases from the dam. And those events had probabilities of significantly less than 1 in 2000 per annum.
The Helidon peak is associated with the first peak of inflows into Wivenhoe dam (dark blue line), the one at Lowood with the second peak. The dark red line indicates the peak flow at that location in 1974.
Note, some areas of the catchment did not experience so intense rainfall, so that overall the intensity of the event over the period is about 1 in 200, but it is the peak falls over the Lockyer on the 10th that destroyed the Lockyer valley, and caused most of the flooding; and directly onto the dam and surrounds on the 11th, that necessitated the massive releases from the dam. And those events had probabilities of significantly less than 1 in 2000 per annum.
-
Chris Colose at 12:43 PM on 11 March 2011What would a CO2-free atmosphere look like?
HumanityRules, I largely agree with you, but non-linearity in sensitivity is rather small over the ranges of climate of interest to us right now (e.g. http://www.nonlin-processes-geophys.net/18/125/2011/npg-18-125-2011.pdf ). Certainly you don't want to compare snowball Earths to say, the PETM directly, but I haven't seen anything suggesting it's a big deal for evaluating modern global warming. The effect isn't absolutely zero. Colman and McAvaney (2009) did this type of experiment from 1/16th to 32x modern CO2 and found a weaker sensitivity in the warm climate than in the cold cases, but it's not a large effect over a few degrees about the modern climate, so you don't really lose much by using the past as a guide to the future. The albedo feedback does get weaker in the warm simulations, but the water vapor grows in strength in warmer climates as well. The Colman and McAvaney paper have the lapse rate feedback increasing in strength too, essentially offsetting the water vapor feedback over most of the range (So the WV+LR feedback is positive the whole time, but not acceleratingly so), but I'm pretty skeptical of that. Eventually the water vapor feedback makes the sensitivity much higher, eventually getting you to a point where a runaway greenhouse is possible if your solar insolation is high enough. There's some other papers on this (e.g., Crucifix 2006, looking at the LGM vs. present) but the non-linearity is pretty small. -
michael sweet at 12:17 PM on 11 March 2011Examining Hansen's prediction about the West Side Highway
Tomurray: Do you hold Lindzen and Spencer to the same standard you hold Hansen? Remember that in 1988 Lindzen was predicting it would get colder in the next decade. Why are you still listening to him? -
Albatross at 12:12 PM on 11 March 2011What would a CO2-free atmosphere look like?
Well done Chris, you have got Lindzen there. That is just one of several misleading and/or false statements he made that day. -
bibasir at 12:03 PM on 11 March 2011What would a CO2-free atmosphere look like?
Really good article and discussion. It is a shame that someone did not answer Lindzens "guess" with some facts. Now the republicans and deniers go away thinking that CO2 is no big deal up or down. -
johnd at 11:39 AM on 11 March 2011Christy's Unconvincing Congressional Testimony
Tom Curtis at 11:27 AM, there is one dam that is being left out, and that is the city itself, and all the other infrastructure and changes that have occurred in the various water courses that artificially confines the natural flow paths. It is a common change that has happened on every water course where human occupation occurs. Geography has as much influence as the weather on all outcomes except for the timing of the events. -
Chris Colose at 11:39 AM on 11 March 2011What would a CO2-free atmosphere look like?
Bern, It's a good question. Impacts as well as internal heating source can certainly leave you very hot early in history, and in some cases can even push you over a threshold for the runaway greenhouse (tidal interaction with the Moon might have been a major heating source for Earth’s climate too in the first few millions of years). The bombardment period is relatively short though, and certainly the sun was a lot less luminous for a large deal of time when impacts were no longer critical. There's a lot to explore about this super-early stuff though in the context of habitability studies. The other thing is that not all stars evolve like our sun. M-type stars which constitute some 75% of all the stars out there are much more stable over geologic time (the lifetime on the main sequence for a star is inversely related to its mass, usually to a third or fourth power). M-stars are smaller and have a low effective temperature (only a few thousand degrees, in contrast to our own sun which is 6,000 K when it becomes optically thin enough for photons to escape) and so potential habitable planets need to be a lot closer to M-types. But with weak (and stable) luminosity, getting them out of a snowball state once they're in can be very tough. The volcanic outgassing of CO2 that helped Earth recover from snowballs in the past might be less meaningful, since a lot of these planets are so close to the sun that they are tide-locked (always having the same face to the sun) or at least close to it, so on the cold night side CO2 could condense out of the atmosphere faster than it is replenished by outgassing. -
scaddenp at 11:36 AM on 11 March 2011What would a CO2-free atmosphere look like?
"I was hoping you could help with understand something. I've started to think that climate sensitivity (CS) is not a constant figure through the history of the earth." A good question and one I would like to know answer to as well. It certainly seems to me that a planet of mostly ice would have a much higher sensitivity than one that is warm and ice-free. (change in albedo feedback - and change in water vapour feedback). PETM features are difficult to explain with sensitivity of around 3 (Zeebe, Zachos and Dicken 2009) - either its higher then or atmosphere has more methane. -
Tom Curtis at 11:27 AM on 11 March 2011Christy's Unconvincing Congressional Testimony
johnd @10, no! I make it seem, as it is, inappropriate, indeed dishonest, to compare flood levels from different periods without noting the effects of dams built on the river. If you want to defend that practice, please say so. I also rebut the casual repetition of false claims about the flood. Again, if you want to defend those false claims, speak up. Finally, I point out that the events of 2011 are extraordinary by any measure. But, if you had read my linked blog, you would have seen that those of 1893 were even more extraordinary by many measures. Wild weather and floods are a part of Brisbane's history. The only thing that is changing in that regard is that now mere thunderstorms are bringing floods comparable with those brought by cyclones in the past. All I can say is God help us when a cyclone next hits Brisbane in a La Nina year. -
What would a CO2-free atmosphere look like?
Chris Colose - Thank you! This is an excellent and thought-provoking thread. As a further investigation into this, for all concerned - looking at the historic (ice core) temperature record, it appears that temperatures rise (in the Earth system) much faster than they fall. Is this due to differences between the sequestration rates and release rates (clathrates, vegetation rot, vs. weathering, ocean release/uptake) upon phase change initiation? -
Chris Colose at 11:17 AM on 11 March 2011What would a CO2-free atmosphere look like?
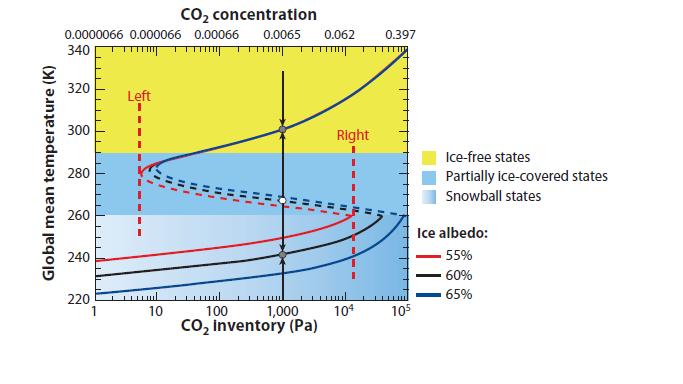
On the interpretation of the bifurcation graph, a thing to note is that for very low or very high CO2 levels, the equilibrium states correspond to snowball or ice-free states, respectively. In between however, there are three solutions (indicated by the circles on the diagram). The intermediate solution (white circle) is an unstable one which separates the attractor basin of the upper warm solution with the colder ice-covered solution. It is here that nudging the climate into a warmer or colder direction will make it head to that new state rather than tending to bounce back to where it was. For further clarification, I'm putting a supplementary hysteresis loop (also in the Pierrehumbert paper) below: Here's an example situation to help read this. Suppose we start off in the warm climate state on the upper branch labeled W1. Now suppose you gradually lower the CO2 a bit. In this case you will get just a bit colder, say evolving toward W2, or decreasing the CO2 a bit more, to W3. This is a steady cooling you expect from lowering CO2, but it isn't an irreversible jump, and if CO2 returns to initial conditions you can return back to W1.
However, suppose we decrease CO2 a lot, such that we reach W4 along the upper branch. This is a rather unstable case (like a ball on the top of a sharply peaked hill just getting ready to be nudged), and further tendency to cool will cause an abrupt jump to the S1 state.
Physically, this is where an ice line starts to advance and the albedo feedback becomes very powerful. Also note that the water vapor feedback becomes negligible once you get tropical temperatures near freezing.
Now if you return CO2 levels back to W2 likes conditions, you don't actually get to the W2 temperature. Now, you only warm a tiny bit to S2. In other words, because of the ice-albedo effect, you have multiple temperature solutions for a fixed solar irradiance and CO2 levels, and what state you're in also depends on the history to get there.
Just how "left" and "right" the boundaries are of the hysteresis loop in the diagram in my post is ultimately critical in understanding how to get in and out of the snowball state. The Pierrehumbert diagram doesn't come from a full-blown GCM, and uses some simple parametrization (for example, what threshold global temperature is appropriate for ice-free conditions? He uses 290 K, but that's an assumption too. Also, how "dirty" is the ice, etc) so I wouldn't try to look an individual numbers too close with a magnifying glass, the point is the concept.
Here's an example situation to help read this. Suppose we start off in the warm climate state on the upper branch labeled W1. Now suppose you gradually lower the CO2 a bit. In this case you will get just a bit colder, say evolving toward W2, or decreasing the CO2 a bit more, to W3. This is a steady cooling you expect from lowering CO2, but it isn't an irreversible jump, and if CO2 returns to initial conditions you can return back to W1.
However, suppose we decrease CO2 a lot, such that we reach W4 along the upper branch. This is a rather unstable case (like a ball on the top of a sharply peaked hill just getting ready to be nudged), and further tendency to cool will cause an abrupt jump to the S1 state.
Physically, this is where an ice line starts to advance and the albedo feedback becomes very powerful. Also note that the water vapor feedback becomes negligible once you get tropical temperatures near freezing.
Now if you return CO2 levels back to W2 likes conditions, you don't actually get to the W2 temperature. Now, you only warm a tiny bit to S2. In other words, because of the ice-albedo effect, you have multiple temperature solutions for a fixed solar irradiance and CO2 levels, and what state you're in also depends on the history to get there.
Just how "left" and "right" the boundaries are of the hysteresis loop in the diagram in my post is ultimately critical in understanding how to get in and out of the snowball state. The Pierrehumbert diagram doesn't come from a full-blown GCM, and uses some simple parametrization (for example, what threshold global temperature is appropriate for ice-free conditions? He uses 290 K, but that's an assumption too. Also, how "dirty" is the ice, etc) so I wouldn't try to look an individual numbers too close with a magnifying glass, the point is the concept.
-
Bern at 11:17 AM on 11 March 2011What would a CO2-free atmosphere look like?
Great article Chris, I quite enjoyed reading it. Regarding this bit: "This is a big problem in planetary habitability studies, especially if a planet succumbs to a snowball fate early in its history when the sun is faint. Once you begin to melt ice however, the temperature jumps rapidly to a very hot solution." Do these studies include the effects of asteroid impacts? As I understand it, the impact rate was substantially higher early in the Earth's history. Small impacts would result it localised heating, but larger ones can provide quite substantial 'kicks', both in terms of heating from the kinetic energy, and in terms of very rapid increases in CO2 levels. There's also the debris that would be spread globally, which would significantly affect albedo, and these combined effects could lead to substantial warming after the initial aerosol cooling subsided. -
Alexandre at 11:14 AM on 11 March 2011What would a CO2-free atmosphere look like?
HumanityRules #9 Good question. I often wondered if the persistent uncertainty range of CS, particularly the long tail at that longer geological study, could be due to such differences you mentioned. -
johnd at 11:08 AM on 11 March 2011Interactive animation of the climate change impact on agriculture
Marcus at 09:11 AM, who the NFF represents comes both directly, and indirectly through the various state bodies, and in turn the various industry bodies that do closely represent individual farmers. It would be interesting to find out if ordinary farmers consider that the Federal Government or the IPCC more closely represents their views. With regards to your mention of multi-generational family farms, because of the post WW2 soldier settlement scheme, in many areas of Australia, multi-generational means that a large number of family farms are only second generation. When they compare the conditions the present generation are facing, with that their parents faced, then obviously they are confined to a 50 -60 year period, but more importantly a period that their parents enjoyed that was not the normal when compared to what is known about Australia's longer term variable climate. It is interesting that some of those present day farmers whose family holdings extends beyond two generations, are finding that some of the conditions they have experienced were similar instead to what confronted their grandparents. With regards to the 30 year period you mentioned, which is generally taken to be the length of time that will represent a climate cycle rather than weather cycles. I think it is about time that this is re-evaluated as to whether it is still appropriate or not. When it was adopted about 100 years ago, the knowledge of weather and climate, both of then and past, was somewhat limited compared to today, as was the ability to measure and quantify all the relevant parameters. Like the concept of a flat earth, it came about reflecting the level of scientific understanding of the day. Obviously our understanding of both has progressed somewhat since those early days, and perhaps we should look to adopting a more appropriate time frame to define climate. -
muoncounter at 11:07 AM on 11 March 2011Examining Hansen's prediction about the West Side Highway
Tom, When you don't have substance, go with the rhetorical shortcuts. Here's a more recent discussion of the same work, including a more detailed map of lower Manhattan: A Columbia University study concluded that as sea levels rise, large parts of Lower Manhattan including Battery Park City, part of the World Trade Center site, and the Seaport will experience 10-foot floods after large storms.
1988? Yup, that's what it says up top. For Watt$ to be combing over this is a joke.
A Columbia University study concluded that as sea levels rise, large parts of Lower Manhattan including Battery Park City, part of the World Trade Center site, and the Seaport will experience 10-foot floods after large storms.
1988? Yup, that's what it says up top. For Watt$ to be combing over this is a joke.
-
dana1981 at 11:06 AM on 11 March 2011Christy's Unconvincing Congressional Testimony
Ian #13 - thanks for the link. Very good point from Santer about the (mis)use of the debunked Douglass et al. paper. I got hung up on the (worse, IMO) mistake of calling the 'hot spot' anthropogenic, and glossed over that error. Just goes to show what a horrendous Gish Gallop Christy's testimony was. We couldn't even catch all the errors therein in this long rebuttal! -
HumanityRules at 11:04 AM on 11 March 2011What would a CO2-free atmosphere look like?
Chris, I was hoping you could help with understand something. I've started to think that climate sensitivity (CS) is not a constant figure through the history of the earth. The impact of forcings in the form of feedbacks can be markedly different given the prevailling situation especially in the more extreme situations you describe in the final paragraph (snowballs, the PETM, glacial-interglacial cycles). For example the cryospheres in these periods will be very different with very different ice albedo feedback, another issue might be land cover and the biosphere, maybe you can think of more situations. I'm concerned that when scientist attempt to make CS estimates are they making estimates for the version of earth that was prevailing at the time and that this is different to the version we are living through now. Can you help with were I'm going right or wrong and describe how scientists deal with that problem (if it exists)? -
Riduna at 11:02 AM on 11 March 2011The Earth's Sixth Mass Extinction May Be Underway
As far as we know, there have been 5 events causing mass extinction of biota. Those events all have at least 5 things in common. 1. Their effect was global 2. All caused atmospheric changes 3. In geological terms they occurred rapidly 4. All resulted in loss of >50% of plant and animal species 5. All were characterised by destruction of habitat. The most serious of these events was the Permian Extinction which resulted in the loss of >90% of plant and animal species. So severe was this event that rebound of life-forms took 15 million years. In this and other extinction events, deep ocean warming, possibly caused by warming of the earths mantle, resulted in the melting of clathrates. This resulted in triggering of the so called “Methane Gun”, the release of massive amounts of methane from the ocean bed over a prolonged period, though possibly only a few centuries. As this methane percolated from the ocean bed to the surface, it oxidized to form CO2 and in the process deoxygenated ocean waters, causing the death of marine flora and fauna on a massive scale. Both gases may have become atmospheric pollutants, though possibly not as serious as the release of aerosols from volcanism or asteroid collision. Atmospheric pollution would have prevented or at the very least limited photosynthesis and produced rapid cooling, at some stage countered by diminution of aerosols and increase of CO2 and other greenhouse gases. The most vulnerable to extinction events are plants and animals unable to rapidly adapt to increasing atmospheric pollution, those with small populations or large body size and those dependent on limited diet. It is not clear that we are now at the start of an Extinction Event but we may well be, though on this occasion one triggered by the human species rather than “natural” volcanism. What is clear is that if unchecked in the very short term, greenhouse gas pollution will cause relatively rapid global warming having the same effects as those characterising earlier extinction events. Shakhova (2010) has already reported that warming of the ocean and seabed off the Siberian coast is already beginning to melt methane clathates. The result is that atmospheric concentration of methane in the Arctic has already reached the highest levels known in 400,000 years. No less concerning is her estimate that destabilisation of offshore permafrost could result in accelerated melting of clathates with an estimated capacity to release 70 billion tones of methane into the ocean. In addition, melting of Siberian marshland permafrost has potential to increase this total. Significant quantities of methane from shallow offshore waters are likely to reach the atmosphere without oxidizing. The bulk, from deeper water, would oxidize before reaching the surface, reducing oxygen in the Arctic Ocean. Both would add to the level of CO2 in the atmosphere further accelerating global warming, placing the environment of biota under increasing stress. It is possible that we may not be approaching the next Extinction event but the signs are ominous and the past provides a stark warning of what lies ahead unless we act promptly to curb greenhouse gas emissions. -
Albatross at 11:02 AM on 11 March 2011Examining Hansen's prediction about the West Side Highway
Not to be pedantic Muoncounter, but this is about what was said in 1988, not 1998. But I agree with your point, it is absurd, and pathetic that people are having to debunk this nonsense being spread by WUWT and others. Hopefully concrete in cheap post 2050 to increase the height of the the sea walls-- hmm, but making concrete is CO2 intensive.....oh dear, another positive feedback loop. -
Tom Curtis at 10:54 AM on 11 March 2011Examining Hansen's prediction about the West Side Highway
Muoncounter @55, interesting, but Hansen still consistently predicts greater sea level rises than the consensus position. It is, therefore, certainly justified to examine his independent predictions, so long as you actually do so rigorously (see 54). Of course, the deniers are simply taking rhetorical short cuts rather than actually examining Hansen's predictions. -
muoncounter at 10:50 AM on 11 March 2011Examining Hansen's prediction about the West Side Highway
This is getting more and more absurd. In a normal scientific review process, the 1998 interview would be long forgotten, as it was superseded by this more recent research brief. The two models suggest that ocean waters in this area could rise another 18 cm to 60 cm by mid-century, as the planet warms. By the 2080s, sea level could climb by 24 cm to nearly 110 cm ... As sea level rises, flood levels produced by the 100-year storm could reach 3 to 3.8 meters by the 2050s, and between 3.2 to 4.2 meters by the 2080s. --emphasis added So its not sea level rise alone, its the combination of sea level rise and the 100 year storm that floods the West Side. -- Figure 2
... the current 100-year flood return period would shorten dramatically. By the 2080s, the likelihood of a flood engulfing the area in blue (Figure 2) would be once in 50 years, given present rates of sea level rise, and as often as once every 4 years, in the worst-case scenario.
Given the huge percentage of NYC's infrastructure that is underground, this should be a serious concern, because there is no 3 meter sea wall around lower Manhattan. Instead its become a denialist playground. Go figure.
-- Figure 2
... the current 100-year flood return period would shorten dramatically. By the 2080s, the likelihood of a flood engulfing the area in blue (Figure 2) would be once in 50 years, given present rates of sea level rise, and as often as once every 4 years, in the worst-case scenario.
Given the huge percentage of NYC's infrastructure that is underground, this should be a serious concern, because there is no 3 meter sea wall around lower Manhattan. Instead its become a denialist playground. Go figure.
-
HumanityRules at 10:49 AM on 11 March 2011What would a CO2-free atmosphere look like?
Chris Colose, I'd agree with you the Lindzen picked a number off the top of his head but the wider issue of CO2 as a GHG is not disputed by Lindzen (video 26-27mins). -
Tom Curtis at 10:48 AM on 11 March 2011Examining Hansen's prediction about the West Side Highway
HR @51, we absolutely believe the scientific community should be held up to scientific scrutiny. The first step in that process is to examine the predictions made in scientific articles or conference proceedings rather than equivalent predictions made of the cuff in interviews. It is very clear that the former will be more precise, and will more accurately reflect the considered views of the scientist. (If the of the cuff remarks widely differ from the considered views, that raises a separate issue, but no one has suggested that to be the case.) The second step is, where there is any ambiguity as to what was meant (which is certainly the case in this example) is to clarify with the author the actual intended meaning. Did Hansen mean 40 years regardless of CO2 levels? Did he mean 40 years, provided that CO2 levels had doubled? Or did he mean 40 years after CO2 levels had doubled? The exact interpretation makes a very large difference as to whether or not the prediction has been (or will be) falsified in 2018. Neither WUWT nor you have taken either of these steps. The notion that you are trying to hold Hansen up to scrutiny is therefore nonsense. In fact, what WUWT appears to be doing is to raise a straw man of Hansen's views in order to make him the subject of ridicule. Finally, if you want to subject Hansen's views to genuine scientific scrutiny, you need to remember that any prediction is based on multiple claims. Because the purpose of scientific scrutiny is to test those claims, where some of those claims are already modified, the prediction needs to be altered accordingly. Let's assume (contrary to what I believe is the most natural interpretation), that Hansen predicted that: "If CO2 levels double by 2028, the West Side Highway in New York will be under water." The theory underlying that prediction is based on Hansen's model work of that period. So it includes the sub-beliefs that: a) CO2 levels can plausibly to double by 2028; b) Climate sensitivity is 4.2 degrees C per doubling of CO2; and c) A 4.2 degree C rise of global temperatures above preindustrial levels will raise sea levels sufficiently to flood the West Side Highway. For scientific scrutiny, (b) is now irrelevant. The evidence, partly published by Hansen himself, shows the climate sensitivity is more probably 3 degrees C. Now, should we test Hansen's predictions without substituting for (b), (b') that climate sensitivity is 3 degrees C, and altering the prediction accordingly, then all we test in the prediction is the conjunction of (a), (b), and (c); which is boring because we already know (b) is probably false. In other words, if in fact the West Side Highway is not under water in 2028, all we learn is that either CO2 has not doubled, or climate sensitivity is lower than 4.2, or sea rise at 4.2 degrees C is not sufficient to flood the West Side Highway. As we are already fairly certain about the second of those possible conclusions, we learn virtually nothing. So, if you really want to examine Hansen's position: 1) Find, if possible, an equivalent prediction from the period in his primary literature; 2) Clarify any ambiguity if any; and 3) Adjust the prediction to allow for recent advances in knowledge. And if you are not prepared to do that, you are not holding Hansen up to scientific scrutiny - you are indulging a rather tawdry rhetorical ploy. Just don't expect us to be deluded by it. -
scaddenp at 10:23 AM on 11 March 2011Dispelling two myths about the tropospheric hot spot
Well the Douglass et al paper ignored radiosonde biases despite the authors apparently being aware them. See Santer et al to see why that paper disappeared. The other two I am unaware of. Got a link to them? Cant find either in easily in google scholar. -
GFW at 10:20 AM on 11 March 2011What would a CO2-free atmosphere look like?
Ranyl, I think the dashed lines are not "real" states. What really happens, if if you're on one of the lower solid lines and you increase CO2 so much that you run out of solid line, then the temperature rapidly increases until you reach the upper solid line at the same CO2 level. If CO2 now drops (because all that melted ice has exposed rock that can weather) you slide down the upper solid line. If it drops enough, you "fall" from the upper solid line to the lower solid line (for the right ice albedo). -
Ian Forrester at 10:18 AM on 11 March 2011Christy's Unconvincing Congressional Testimony
Michael Tobis has some scathing comments from Ben Santer on Christy's testimony. -
RickG at 10:12 AM on 11 March 2011Examining Hansen's prediction about the West Side Highway
HR: It's 17 years until Hansens speculation, but more generally the satellite data is still failling to show anything but a linear rise. Come on HR, you have been shown time and time again that Hansen did not put a time frame on the sea level rise. The reference was a doubling of CO2. There's not a single scientist on the planet speculating that a CO2 will double by 2028. What does it take for you to understand that? -
Tom Curtis at 10:10 AM on 11 March 2011What would a CO2-free atmosphere look like?
Chris, I enjoyed the article, and hope it is to be the first of many on this site. Can you confirm that the sections of the bifurcation graph with dashed lines are transition states? That is, once the CO2 level reaches high enough a level to start melting ice in a snowball earth scenario, the temperature will continue warming until it reaches that of the equivalent for the equivalent CO2 level in the ice free state; and if CO2 levels drop below the minimum to maintain the upper solution, the earth would cool to a snowball state at the appropriate temperature for that CO2 level? Are they also unstable state? Ie, if the glaciation and CO2 levels where those at the white dot on the graph, could an equilibrium be maintained, or would it inevitably transition to one of the grey dots due to changes in albedo? Finally, I notice that in the non-snowball Earth case, at 666 ppm the model clearly indicates the Earth to be ice free. As the model was using less than current insolation, doesn't this mean the model is predicting an eventually ice free Earth for doubling of CO2 from current levels? -
Albatross at 09:54 AM on 11 March 2011Examining Hansen's prediction about the West Side Highway
HR @49, "If your data is correct then New York should be one of the spots on the earth were accelerating SLR should be showing up earliest." First off, they are not "my" data. Second, that is your interpretation of the paper which is talking about future GSL. Nice try though. That said, this satellite-derived map of GSL, does show a hot-spot for GSL rise (> 5 mm/yr) off the northeast coast of Canada for the period 1993-2009. [Source here]
-
HumanityRules at 09:50 AM on 11 March 2011Examining Hansen's prediction about the West Side Highway
45 Phila There is nothing I can do if you feel the climate science establishment shouldn't be held to scutiny. There is nowhere for our discussion to go from here. Again your appeal is that you want the discussion to be limited to what you think is relevant, you don't seem to be able to see that. There is plenty I disagree with on this site but I never(I think!) try to limit the scope of the discussion. Finally the title of the article is "Examining Hansen's prediction about the West Side Highway". That's what I'm trying to do, you seem to think the title is "Bash WUWT". Look if John wants to post an article with that title I'd be happy to join the conversation there if I thought I was going to get something from it. -
Tom Curtis at 09:40 AM on 11 March 2011Examining Hansen's prediction about the West Side Highway
tomurray @43, I have read the original post at WUWT. I noticed, for example how they carefully showed the windows of the offices of not only Hansen, but also Schmidt (who was totally unconnected to the article), two men known to have received death threats. (I also read their very weak defense of that action in the comments.) I also noticed how they are taking an ambiguous prediction from a casual interview rather than the equivalent prediction from Hansen's scientific work (which would be precise, and not in need of interpretation) as the basis of their commentary. Finally, I also notice that you have set up a standard whereby if what Hansen has predicted for the 2090's is not fulfilled by the 2010, then his work (all of it, apparently) can be dismissed. Finding pretexts to dismiss evidence may be preferable (for some) to actually understanding the evidence. However, it does not impress. -
HumanityRules at 09:37 AM on 11 March 2011Examining Hansen's prediction about the West Side Highway
25 Albatross Albatross all that modelling work is fine but did you look at the data presented by Charlie A in #20. If your data is correct then New York should be one of the spots on the earth were accelerating SLR should be showing up earliest. I don't see it in the on the ground data, it looks pretty much linear. When are we going to start to see this exponential growth? It's 17 years until Hansens speculation, but more generally the satellite data is still failling to show anything but a linear rise. -
Albatross at 09:35 AM on 11 March 2011Examining Hansen's prediction about the West Side Highway
Tomurray, "He needs to be right all of the time." No, that is a fallacy. Applying your logic we should not be funding the National Weather Service in the USA to issue warnings for severe weather because they are not correct 100% of the time. Yet, there is immense value in their warnings. Same goes for medical doctors-- and they get payed much, much more than does Hansen. You are being unrealistic and are not grounded in reality. I hope you now realize the folly of your reasoning. I strongly suspect that you are placing unrealistic expectations to set someone up for a fall, just so it can reinforce your skewed perception of reality and dismiss their inconvenient findings. I do agree that Hansen should be held to a high standard, and he is, pretty much every word he says is scrutinized. What would be disappointing (and telling) is if you did not apply your critique or skepticism equally, that is what a true skeptic would do. So I find it odd that you do not concede that Watts is misrepresenting what Hansen actually intended to communicate. And let us not be naive, Watts is embarking on an orchestrated misinformation campaign and relishes in defaming climate scientists. -
Gordon1368 at 09:23 AM on 11 March 2011Examining Hansen's prediction about the West Side Highway
@46 tomurray In fact, he does defend all of his positions within the scientific community. There is no error in his statement. If CO2 doubles, whenever it doubles, sea levels will rise a meter. No one doubts that. You are grasping at straws, which only shows how weak your position is. -
ranyl at 09:21 AM on 11 March 2011What would a CO2-free atmosphere look like?
 Interesting post Chris.
This graph is fascinating, if you raise CO2 in the partially ice covered state and follow the dashed lines a rising CO2 results in a global cooling which is none mechanistic.
Therefore presuming a rising temperature with a rising CO2, could the increase go vertically so to speak?
Could a rising temperature due to radiative forcing (like the changig alebdo effect)in the partially ice covered earth cause jumps in temperature?
Can temerpatures of the top line be reached before the ice melts followed by the melt?
Antarctica is going to take a long time to melt even if the world rose several degrees c.
What does this sort of graph mean for climate sensitivity?
Interesting graph, when is the Pierrehumbert et al., 2011, accepted paper being published?
Moderator Response: [mc] Use width=500 or smaller within img tags.
Interesting post Chris.
This graph is fascinating, if you raise CO2 in the partially ice covered state and follow the dashed lines a rising CO2 results in a global cooling which is none mechanistic.
Therefore presuming a rising temperature with a rising CO2, could the increase go vertically so to speak?
Could a rising temperature due to radiative forcing (like the changig alebdo effect)in the partially ice covered earth cause jumps in temperature?
Can temerpatures of the top line be reached before the ice melts followed by the melt?
Antarctica is going to take a long time to melt even if the world rose several degrees c.
What does this sort of graph mean for climate sensitivity?
Interesting graph, when is the Pierrehumbert et al., 2011, accepted paper being published?
Moderator Response: [mc] Use width=500 or smaller within img tags. -
Marcus at 09:11 AM on 11 March 2011Interactive animation of the climate change impact on agriculture
John D "I have no doubt that you associate and talk to others who share similar views as yourself. Whether or not they are representative or not is another matter. Are you also sure they are not concerned more about short term weather events such as droughts?" First of all, my work doesn't allow me to *choose* who I associate or talk to-any more than it does my colleagues-yet still the majority of the farmers we come in contact with express a deep level of concern about global warming-not short term weather effects, as you suggest, but explicit mention of global warming (though they do mention its impacts on things like droughts, which most of them have noticed getting worse over the last 30 years). Second of all, do you *honestly* think that an organization like the NFF genuinely represents the view of the majority of ordinary farmers? That's like saying the ACTU represents the view of the majority of blue-collar workers. Indeed, the view I get from the farmers themselves is that the NFF really only represents the views of the so-called "agri-businesses", or "factory farms", not the views of multi-generational family farms. -
muoncounter at 08:56 AM on 11 March 2011A Scientific Guide to the 'Skeptics Handbook'
KR, I second your props to John. Regular contributors to this site: See the Organizational Nominees at George Mason University's 2011 climate change communicator award. Vote early, vote often! -
A Scientific Guide to the 'Skeptics Handbook'
Jo Nova recently reposted her handbook - apparently her site has received some attention in the news recently, and she wanted to call attention to her write-up. I commented there, and pointed people at some SKS threads, including The Scientific Guide to Global Warming Skepticism. I expect the number of thumbs-down on my post to soon reach the point of hiding my post, which paradoxically calls even more attention to it. John Cook - fantastic work on this site. I understand it's a labor of love, and what a labor it is. You are to be congratulated on your devotion to the future and to your children (and their children's children). I don't think that gets said often enough; Thank you. -
tomurray at 08:32 AM on 11 March 2011Examining Hansen's prediction about the West Side Highway
Actually, Phila, Hansen should be held to a higher standard. He has the titles. He gives expert testimony before congress. He is cited by NOAA, IPCC, etc. as an expert. He needs to be right all of the time. It's not "unbalanced" to expect that he be able to defend all of his positions. He shouldn't be making them if he's not sure. Otherwise, why are we paying him? Or are you admitting the uncertainty of the whole subject? -
What would a CO2-free atmosphere look like?
logicman - I believe the increased albedo would lower retained energy enough to keep the Earth in a stable ice-covered state, although I haven't run the numbers - it might be worth looking at a simple climate model or two to see. That would hold until either Milankovitch effects or volcanic activity (unbalanced by weathering, as most available rocks would be covered) increased CO2 enough to lead to a feedback cycle that would take the would warm things up, releasing CO2 from the oceans. Still - this is a Gedankenexperiment thread. It's sufficient to show that if a variable is changed the current world would not have the same state as it does now. -
logicman at 07:50 AM on 11 March 2011What would a CO2-free atmosphere look like?
"... if the Earth were magically ice-covered today, this would be a completely stable situation and there would be no tendency to escape that state unless the greenhouse effect was substantially enhanced or the sun got brighter." By definition, it would be a desert planet, just as much of Antarctica is, by definition, a desert. Now add what I like to call the Best effect - after the Elizabethan scientist George Best who first published a description of it: insolation at tropical levels at the poles in their respective summers. Following tropical-level melting at the equator and North polar seas, warm water would put some minimal GHG into the atmosphere. Over a long enough time, the 'compound interest' of GHG - at first from the oceans, later from land - would lead to a planet with much less ice everywhere except Antarctica. George Best -
Phila at 07:49 AM on 11 March 2011Examining Hansen's prediction about the West Side Highway
HR: Phila it's not being personnal to critically examine what a scientist says about the science whether that is speculation or predictions. IMO, it is indeed personal when that "critical examination" obsessively targets high-profile climate scientists, while giving far more error-prone "skeptics" a pass. The result of this approach is that someone like Hansen has to hit a bullseye 11 times out of 10, while "skeptics" aren't even required to aim at the target. (As an added bonus, they get to reject any claim about AGW that strikes them as "alarmist," which is a cute way of "winning" every debate before it properly begins.) If you can come up with some other credible explanation for this demonstrably unbalanced approach than a desire to discredit the science by attacking individuals -- and portraying any alarming scenarios as unscientific by definition -- I'm all ears. In fact if you and others say that this has nothing to do with science then I'll drop it. The balls in your court. I can understand why you'd want to reduce this debate to a false dilemma. Presumably, you can understand why I reject that approach. Per Tom Curtis @39, "That criticisms of such comments seems so important to deniers suggests they have nothing substantive to say about the actual science." Which was the point of my initial comment, as well. -
Ricki at 07:34 AM on 11 March 2011Christy's Unconvincing Congressional Testimony
PS. Great to see hard data on the Brisbane flood, thanks Tom. -
Ricki at 07:32 AM on 11 March 2011Christy's Unconvincing Congressional Testimony
Actually, there is plenty of recent science that suggests intensity is increasing. I believe it is, but it would be hard to proove yet. The two recent papers regarding precipitation go a long way to prove it. A 1:2000 event locally is quite feasible in probability terms - an analysis of the data would be needed in depth. It is clear though that we are in for more of these swings in the weather. Perhaps we will be back to drought in a year or two and be wishing we still had all that water. The problem is that we just don't know which way the climate system will head for Australia. The models are based on our current understanding only. The additional moisture in the atmosphere will drive more intense/energetic storms, but whether they are over Australia or not is still unknown in my opinion. We are pushing the climate hard towards the unknown and we have to do something about it. Not listen to those who want to delay action! -
Climate Emergency: Time to Slam on the Brakes
Fred Staples - Your last post contains a huge list if misconceptions and disproven skeptic arguments; enough that it could qualify as a Gish Gallop. Taking it in the light of a well intentioned post, I would suggest you read: - Temp record is unreliable - It's Urban Heat Island effect - The first global warming skeptic (Angstrom) - 2nd law of thermodynamics contradicts greenhouse theory (Read it again - please!) - The Imaginary 2nd law of thermodynamics - The Real 2nd law of thermodynamics - What caused early 20th Century warming - Why did climate cool in the mid-20th Century - CO2 is not the only driver of climate - There's no tropospheric hot spot And finally, before posting other objections to the clearly established science, I suggest you take a look at the Most Used Skeptic Arguments and see if it's already been discussed. I'm not going to bother writing a point-by-point rebuttal of your post; that's already been done on those various pages.Moderator Response: Thanks. Now there have been sufficient pointers to relevant Argument threads, for both Fred and everybody else to comment there rather than here. I'll start deleting any further off topic comments that appear here. -
Albatross at 04:42 AM on 11 March 2011Climate Emergency: Time to Slam on the Brakes
Fred, When you first mentioned that the "mid-troposhere was not warming" @70, you said nothing about the fact that you were looking only at equatorial temperatures. Now we hear that you cherry-picked temperatures in the tropics, when you know very well we are dealing with global warming (AGW), and that the greatest warming has been in the mid and high latitudes (as predicted by AGW theory). You also mistakenly claiming that the alleged missing 'anthro' equatorial hot spot refutes the theory of AGW, when in fact you should know that the equatorial hot spot is not a signal of anthro warming, one should see the same hot spot regardless of the source of warming. Also, you talk about mid-tropospheric temps and do not show data for 500 mb, which is considered to be the mid-troposphere in meteorological circles. If you want to debate the equatorial hot spot, please take that tot he appropriate thread. The NOAA and RATPAC data show that globally tropospheric temperatures are increasing. Additionally, the RAPAC data show that globally (since 1958) the 850-300 mb layer is warming faster than the instrument-based surface temperatures. To dismiss that fact is to be in denial. I'm with NOAA and the climate agencies on this one, but thanks for trying to obfuscate-- readers here will see right though that though. You will be guaranteed success at WUWT. And lastly, please stop wasting everyone's time and cluttering the threads by parroting long debunked "skeptic" myths. Thanks. -
Albatross at 04:23 AM on 11 March 2011Interactive animation of the climate change impact on agriculture
And for those who claim that plants do better in CO2 "enriched" environments under water stressed conditions, the observations (from a global network of flux towers) show otherwise. From Jung et al. (2010, Nature): "Hence, increasing soil-moisture limitations on evapotranspiration largely explain the recent decline of the global land-evapotranspiration trend. Whether the changing behaviour of evapotranspiration is representative of natural climate variability or reflects a more permanent reorganization of the land water cycle is a key question for earth system science." More here. This research is corroborated by independent research (using satellite data) conducted by Zhao and Running (2010, Science) who found that: "The past decade (2000 to 2009) has been the warmest since instrumental measurements began, which could imply continued increases in NPP; however, our estimates suggest a reduction in the global NPP of 0.55 petagrams of carbon. Large-scale droughts have reduced regional NPP, and a drying trend in the Southern Hemisphere has decreased NPP in that area, counteracting the increased NPP over the Northern Hemisphere. A continued decline in NPP would not only weaken the terrestrial carbon sink, but it would also intensify future competition between food demand and proposed biofuel production." NPP= Net Primary Production, a measure of "the amount of atmospheric carbon fixed by plants and accumulated as biomass". That is, photosynthetic activity. -
Fred Staples at 04:22 AM on 11 March 2011Climate Emergency: Time to Slam on the Brakes
As promised, perhaps I can reply to some of the individual comments on my posts.. KR, 51, I agree that there is no significant difference between the trends in all the main records of global temperature anomalies. They all suggest that increasing CO2 did very little until 1979, when it had reached 350ppm. I know how much quality control is required to record accurate temperature measurements. You might like to try it in your own house (not forgetting the loft), and then try the garden. You car temperature gauge will demonstrate the urban heat island effect every time you drive through a town (the M4 into London is very flat, if you want a specific reference). Sea covers 75% of the globe. Do you know how sea temperatures were measured before the recent instrumented projects. Ships with buckets and thermometers. RickG, 52, The Physics of infra-red absorption by CO2 is well known, and calculable both by the wave and particle views of photons. (Radiation, page 252, by Grant W Petty, University of Wisconsin Madison if you do not accept the dual wave /particle theory) Angstrom demonstrated the saturation effect about 100 years ago, when he found that CO2 concentration made little difference to atmospheric warming. Woods demonstrated that back-radiation from an absorbing medium will not warm the interior of a greenhouse. Do you think that 100% CO2 will warm dramatically faster than air? Have a look at this high school experiment http://www.espere.net/Unitedkingdom/water/uk_overview.htm. The application of CO2 to AGW is where the problems begin -trapped heat, warming from back-radiation, little silver bullet photons, dependence on the lapse rate, etc. Many, perhaps most, of the explanations offered on the internet directly violate the second law of thermodynamics.. There were people predicting global warming in the seventies, BH, but they were not taken seriously. CO2 is certainly well mixed, but its absorption is swamped by water vapour in the humid lower atmosphere. It is the CO2 action (and re-action) that takes place in the dry mid and upper troposphere that is said to be responsible for surface warming. Hence the problem with the UAH temperatures. The observed trend difference between the upper and lower air temperatures is absolutely not to be expected. Exactly the opposite is to be expected. The temperature difference itself is due to the lapse rate, as you can see when you drive your car up a hill. Adelady, 54, there were no unnoticed signs (of CO2 impact) 60 or 80 years ago. The point is that there were no signs at all.. 55 Muoncounter. I will accept your views on past temperature movements (pre 1979) if y0u accept that they had nothing to do with increasing CO2 concentrations. 61 Villabolo If you are right, we are going to see some sharp temperature increases as the CO2 emmissions during the western industrial revolution take hold. We can expect to move up the Hansen A line, 66. If you are wrong, temperatures will continue to plod along the Hansen C line, while CO2 move close to the A line. As the CO2 and temperature lines diverge, support for AGW will wane. 76 Albatross, I analysed the HadAT Radio-sonde data myself, two years ago, from 1958 to 2009. The tropospheric lapse rate continues up to about 10 Kms, which corresponds to the HadAT 300/200hPa charts. I wanted to test the significance of the warming (and cooling) in the record, at the 5% level, by calculating the point when change becomes significant in years back from the (then) present. The results were interesting: 11 Kilometers ( 200 hpa) : 51 years (no significant warming) 9 Kilometers (300hpa) : 27 years 1.45 Kilometers (850hPa) : 13 years For significant cooling, (steps, flat periods, and volcanoes included), 29 years at 13.47 kilometers. So, low down, but still well above the surface layer, warming is clear. Higher up it falls away, and is not significant at the top of the troposphere. This is less conclusive than the UAH measurements, but it supports my argument. I will bring these results up to date. Propaganda, 80, is not necessarily false, but it is still propaganda. I seek to do no more than bring some balance to this blog. I will, if anyone is interested, reel off anecdotal evidence on the sceptical side of the argument, but that too, is propaganda. 83 I really dislike thought experiments. Thinking, of course, is welcome. 91 James Wright. I did not claim that (if I did it was a mistake). I do not know the temperature of the medieval warm period (although I have seen the same plots as everyone else). I do know that it was not caused by increasing CO2 levels. I also know that it was very cold in the Little Ice Age. Incidentally, when the Hockey stick was first published, George Monbiot in the Guardian abolished both. Propaganda again.Moderator Response: I told you to respond on the appropriate threads, not here. Please copy your individual replies to those relevant threads. Then I will delete this comment from this thread. -
muoncounter at 04:19 AM on 11 March 2011Examining Hansen's prediction about the West Side Highway
"Whether this is a prediction or speculation is irrelevant, it's helped shape the wider debate of climate science" This is a valuable insight into the denier's view of what constitutes the 'debate.' I suspect that if someone asked Dr. Hansen the time and his watch was 5 minutes slow, the deniersphere would still be trumpeting 'Hansen can't tell time!' 5 years later.
Prev 1876 1877 1878 1879 1880 1881 1882 1883 1884 1885 1886 1887 1888 1889 1890 1891 Next


