Climate Science Glossary

Term Lookup

Enter a term in the search box to find its definition.

Settings

Use the controls in the far right panel to increase or decrease the number of terms automatically displayed (or to completely turn that feature off).

Term Lookup

Settings


All IPCC definitions taken from Climate Change 2007: The Physical Science Basis. Working Group I Contribution to the Fourth Assessment Report of the Intergovernmental Panel on Climate Change, Annex I, Glossary, pp. 941-954. Cambridge University Press.

Home Arguments Software Resources Comments The Consensus Project Translations About Support

Twitter Facebook YouTube Mastodon MeWe

RSS Posts RSS Comments Email Subscribe


Climate's changed before
It's the sun
It's not bad
There is no consensus
It's cooling
Models are unreliable
Temp record is unreliable
Animals and plants can adapt
It hasn't warmed since 1998
Antarctica is gaining ice
View All Arguments...


Username
Password
New? Register here
Forgot your password?

Latest Posts

Archives

Measuring CO2 levels from the volcano at Mauna Loa

Posted on 25 October 2010 by Andy Skuce

The observatory near the summit of the Mauna Loa volcano in Hawaii has been recording the amount of carbon dioxide in the air since 1958. This is the longest continuous record of direct measurements of CO2 and it shows a steadily increasing trend from year to year; combined with a saw-tooth effect that is caused by changes in the rate of plant growth through the seasons. This curve is commonly known as the Keeling Curve, named after Charles Keeling, the American scientist who started the project.

Why Mauna Loa? Early attempts to measure CO2 in the USA and Scandinavia found that the readings varied a lot due to the influence of growing plants and the exhaust from motors. Mauna Loa is ideal because it is so remote from big population centres. Also, on tropical islands at night, the prevailing winds blow from the land out to sea, which effect brings clean, well-mixed Central Pacific air from high in the atmosphere to the observatory. This removes any interference coming from the vegetation lower down on the island.

But how about gas from the volcano? It is true that volcanoes blow out CO2 from time to time and that this can interfere with the readings. Most of the time, though, the prevailing winds blow the volcanic gasses away from the observatory. But when the winds do sometimes blow from active vents towards the observatory, the influence from the volcano is obvious on the normally consistent records and any dubious readings can be easily spotted and edited out (Ryan, 1995).


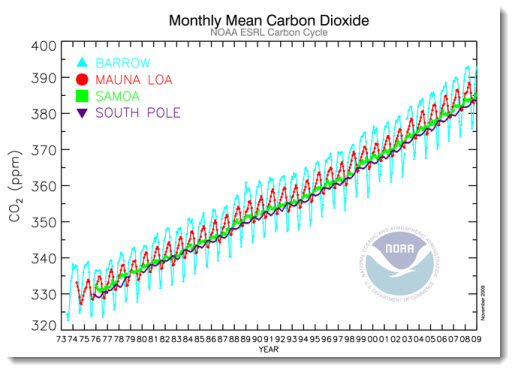
Importantly, Mauna Loa is not the only atmospheric measuring station in the world. As the graph from NOAA shows, other stations show the same year-after-year increasing trend. The seasonal saw-tooth varies from place to place, of course, but the background trend remains steadily upwards. The Keeling Curve is one of the best-defined results in climatology and there really are no valid scientific reasons for doubting it.

Further reading: Spencer Weart's The Discovery of Global Warming describes Charles Keeling's research efforts in more detail. Weart also has a separate article on Keeling's struggle to fund his research.

This post is the Basic Version (written by Andy S) of the skeptic argument "Mauna Loa is a volcano". Note: an advanced version of this argument is in the works and should be published soon.

0 0

Printable Version  |  Link to this page

Comments

Comments 1 to 28:

  1. Might be worth adding that being in the middle of the ocean means in effect that the observatory is sampling well-mixed air. What about the samples from Tasmania - is it on one of the islands? Not sure how many years but it would add another geographic centre to the graph.
    0 0
  2. David Horton, the station in question is on Cape Grim-as I recall-& they've been operating since the 1970's. They're seeing a Keeling Curve as well. So that's a total of 5 measuring stations all showing the exact same things-yet some denialist will *still* try & argue the case with you!
    0 0
  3. New Zealand's NIWA have been collecting atmospheric CO2 data since 1970 and CH4 since (I think) the late 80's. Long story but local denialists are in denial about the local atmospheric temperature data but are mostly silent about CO2.
    0 0
  4. the prevailing winds are offshore breezes, which bring clean air from high in the atmosphere down to the observatory Is that accurate? Offshore breezes bring in air from the direction of the ocean, but not necessarily from "high in the atmosphere." I think you're mixing up the onshore/offshore pattern with a slightly different diurnal pattern. During the day, the wind at Mauna Loa tends to be upslope (upward from the island), while at night the wind tends to be downslope (downward from the atmosphere). Changes in temperatures drive both patterns, but it's the downslope effect, not the offshore effect, that brings down air from higher in the atmosphere. That's been my understanding, anyway.
    0 0
  5. Well, in Mauna Kea and Mauna Lea, plant stop at 3000 m. This the normal height of the boundary layer. At night, this layer is normally much thiner due to reduction of convection. Astronomer make use of this and put telescope on the top of Mauna Kea for that reason. Actually, on top of Mauna Kea, the air flow is coming strait from the pacific ocean. This is why it is so stable, which provide a good seeing. Similar situation occur in Mauna Loa but since the altitude is lower, the effect is less obvious.
    0 0
  6. chrisd3 "at night, the prevailing winds are offshore breezes" i guess he means going offshore, although you're right that usually it is intended the other way around. Yvan Dutil the Mauna Loa Observatory is at 11,135 ft which should be something like 3300 m (will the descendants of the anglo-saxons ever convert to the SI units? :)). It should be high enough.
    0 0
  7. Re: Offshore/onshore breezes The accepted understanding is that onshore breezes are those winds that normally flow toward the land from the sea during daylight hours, as the land will typically be much warmer during the day. At night, the land loses its heat through radiative processes, and the winds change to downslope: the sinking cooler air moves toward the sea, moving offshore from the land to the sea. The Yooper
    0 0
  8. Daniel #7:
    onshore breezes are those winds that normally flow toward the land from the sea
    Quite right. As a former sailor, I'm quite ashamed that I didn't even notice that, and even repeated it. The sentence should say "onshore" rather than "offshore." But still I don't think it's the onshore/offshore direction that brings air down from the upper atmosphere.
    0 0
  9. chrisd3, the Mauna Loa Observatory is already high enough to be a good place to measure background CO2 concentration, unless air coming from lower elevations "contaminate" the readings. At night, or whenever there's no upslope wind, there's no reason for concern. Whether the air comes from higher up (which is often true) or from the same level is irrelevant.
    0 0
  10. Re: chrisd3 (8) As a former nautical cartographer, I didn't realize that it wasn't common knowledge about such breezes. You and Kevin McKinney should share sailing backgrounds sometime.
    0 0
  11. Thanks for the comments. I replaced "offshore breezes" with different wording that I hope will be unambiguous. I also reworded the latter part of that sentence to make it more clear that at night the observatory samples well-mixed high altitude air from the Central Pacific rather than the lower altitude air that has come upslope from the lower reaches of the island and which may be slightly depleted in CO2 due to the effects of the vegetation there. Some of this will be discussed in more detail in a forthcoming Advanced Version of this rebuttal.
    0 0
  12. For those wondering about how the offshore breeze results in higher air descending to the mountaintop, it's just fluid continuity. If air at or below the mountaintop is flowing outward, something has to replace it ... which means air from higher up. While air is not a "perfect fluid", divergence still has to be pretty darn close to zero :-)
    0 0
  13. Mauna Loa and other sampling sites provide an interesting record of increasing atmospheric CO2 but how much of it is the result of human activity (and how is that determined) and how much is from other sources? Global warming arises from the increased presence of greenhouse gases (CO2-e) in the atmosphere, CO2 being only of them. Do Mauna Loa and other stations measure the concentration of other greenhouse gases in the atmosphere? Measuring CO2 concentration only provides part of the picture. For example, as global temperatures rise melting permafrost and ice, methane is released from subsurface decaying material. When ocean water warms it is less able to absorb atmospheric CO2 and increases its release of that gas into the atmosphere. Are these effects identifiable and are they measured? When we talk of the importance of keeping the concentration of CO2 in the atmosphere to less than 450 ppm, should we not be stressing the importance of keeping the concentration of CO2-e in the atmosphere to less than 450 ppm?
    0 0
  14. I don't think the sea breeze has much of an effect on Mauna Loa. What does have a big effect is the inversion layer. From their website "MLO also protrudes through the strong marine temperature inversion layer present in the region. This inversion layer acts like a lid and keeps the lower local pollutants below the observatory." I am not an expert but I do live in the area. Often the lower level winds and the winds aloft are blowing different directions, which can make for interesting cloud watching. Jerry
    0 0
  15. Re: Agnostic (13) Whenever I have a question (and having an enquiring kinda mind, I have many [questions, not minds; multiple minds would be silly, wouldn't it? Shut up and let the man talk!]), I like to go straight to the source. In this case, the Earth System Research Laboratory that operates the Mauna Loa facility in question. There one would thus find a full panoply of measurements of various and sundry greenhouse gases in full regalia. But that's me. As far as your last question, given your earlier worthy comment on that subject, that would seem to be a rhetorical question. But yes, that would be the reaction of sensible people. Which is why our politicos in America will procrastinate until it's too late. Prevention is out the window. All we will be able to do is to adapt as best able. Asbestos underwear, anyone? The Yooper
    0 0
  16. #13: "Do Mauna Loa and other stations measure the concentration of other greenhouse gases in the atmosphere?" Yes, although not all sites around the world measure all species. Look at NOAA's data viewer where you can select among CO2, CO, CH4, O3, SO2, NOx, etc.
    0 0
  17. The only problem with the Mauna Loa station is the spelling. Otherwise it provides solid results on the global CO2 levels. It should also be noted in later versions that the US typically has higher levels of CO2 than the station in Hawaii. In fact, most industrial countries have higher levels than the middle of the Pacific Ocean.
    0 0
  18. #17: "most industrial countries have higher levels than the middle of the Pacific Ocean. " Excellent: Direct, verifiable, repeatable experimental evidence of the fact that atmospheric CO2 increases because of fossil fuel consumption.
    0 0
  19. ATTN: All FYI After analysis, the concentration for CO2 in a sample of local air is reported for purified dry air (PDA) which does not occur in the earth’s atmosphere and is comprised of nitrogen, oxygen, the inert gases, which are the fixed gases, and CO2. The composition of PDA (i.e., the relative amounts of the fixed gases and CO2) is fairly uniform through out the atmosphere and is independent of location, elevation, pressure, temperature, humidity, biological and human activities except for minor local variations in particular with respect to CO2. This is the origin of the term “well-mixed atmospheric gases.” For PDA at STP (i.e., 273.15 K and 1 atm. pressure), there are presently about 390 ml, 17.4 millimoles, 766 mg, or 0.000766 kg of CO2 in 1 cubic meter. The density of PDA at STP is 1.29 kg per cubic meter. The concentration of CO2 in PDA is 390 ppmv. In real air there is no uniform distributon of the masses of the consituents including water vapor and clouds in the atmosphere in space and time as is shown by daily weather maps of the various regions of the earth. High pressure cells have more mass of the gases than do low pressure cells, and thus there is no uniform distribution of CO2 in the atmosphere. Air containing water vapor is less dense than dry air and has less mass of the fixed gases and of CO2 both of which will vary with humidity. Mountains are a prominent geological feature of the continents and the density of the air in them is less than at sea level and diminishes rapidly with elevation. Real air is the term for local air at the intake ports of an air separation plant and usually contains aersols, reactive gases, volatile organic compounds, water vapor, fog, rain, snow, CO2, nitrogen oxygen and the inert gases which are the fixed gases and comprise about 99% of PDA. The metric used for CO2 in climate model calculations is ppmv and is incorrect since the concentration of CO2 is only valid for PDA. The metric that should be used is either mass per unit volume or moles per unit volume. This is flaw in climate model calculations since the mass of the air is complex function of the variable mentioned above. The mass of CO2 per unit volume in local air will usually be less for elevation upto ca 30,000 ft. (i.e., the height of the tallest mountains) than that calculated for PDA. Climate models that use concentation of CO2 for PDA will give results that are to slighty too high. Moist tropical air (e.g.,90 deg F and 100% humidity) can contain 20% less CO2 than PDA. For much useful into on the properties air go to Universal Industrial Gases Inc.'s website at http://www.uigi.com/air.html By Harold, the chemist.
    0 0
  20. Early attempts to measure CO2 in the USA and Scandinavia found that the readings varied a lot due to the influence of growing plants and the exhaust from motors. the prevailing winds are offshore breezes, which bring clean air from high in the atmosphere down to the observatory This not completely precise. The influence e.g. of wind on measurements of CO2 for a long time ago was a scientist of Luxembourg physicist dr. F. Massen (Seasonal and Diurnal CO2 Patterns at Diekirch., 2007; and Pattern of CO2 and other atmospheric gases during a cold weather inversion., 2009.) Interestingly, he concluded that this effect can be estimated also for measurements over land and ... that the measurements from Mauna Loa, Barrow vs. example, can be used to statistically based validation of old - historical measurements of CO2, leading to the paper: Accurate estimation of CO2 background level from near ground measurements at non-mixed environments., 2009). In this work a more precise description of why it is the type of Mauna Loa station gives the best results: ” The daily pattern of the CO2 mixing ratio depends essentially on the presence and/or the strength of the near ground inversion layer. This layer (which exists mostly at night, during the morning hours or at late afternoon) prevents a thorough mixing up of the atmosphere and coincides usually with large CO2 peaks (Massen, 2007). During the midday hours, solar heating is normally at a maximum and creates the strongest convective air movements. As a consequence, the atmospheric boundary layer is well mixed up, and CO2 mixing ratios fall to their daily minimum. This minimum is seen as the most representative measure of the regional CO2 background level. The inversion periods are much shorter and less intense at the border of open sea or at smaller islands, where a quasi continuous breeze mixes up the boundary layer at most periods of the day. As a consequence, the daily CO2 variation is much lower at these locations; that are considered as the most suitable for background CO2 measurements.”
    0 0
  21. Arkadiusz: Thanks for those links. The paper by Massen and Beck contains the following figure, comparing CO2 readings for a station in Luxembourg and at Mauna Loa over the same four days in July, 2006. The graphs show the variations through the day at both stations, with the variations at Mauna Loa being much smaller. The dips in the afternoon readings on two of the days at Mauna Loa are probably due to upslope breezes bringing air from the lower reaches of the mountain that is slightly depleted in CO2 due to plant respiration. Note that the figure caption warns us that the scales are different.I digitized the two CO2 curves and plotted them at the same scale so that they can be directly compared, as shown below. This illustrates how steady the Mauna Loa CO2 readings are relative to inland stations like the one in Luxembourg.
    0 0
  22. #21 "relative to inland stations like the one in Luxembourg." Andy, Nice job. The Massen and Beck paper is one of a number that conclusively demonstrate via experiment the anthro contribution to atmospheric CO2. Diurnal and seasonal patterns match traffic density: The last peak coincides with a NO maximum, sign of the Monday morning commuter traffic; the Monday CO2 peak exceeds the Sunday peak by about 40 ppm. Other authors (notably Idso 1998 and 2002) describe an urban 'CO2 dome' over major cities (in Idso's case, Phoenix, Arizona). It is quite stunning to see local CO2 concentrations touching 500-600 ppm at times when the MLO background was in the 360s.
    0 0
  23. Wow – One of the reasons famous volcanoes Mauna Loa was selected as a CO2 monitoring spot was because it was so far from, well, everything and atmospheric gases would be well mixed by the time they reached Mauna Loa. If it winds up that Mauna Loa is well placed to measure ocean absorption of CO2, that would be off the irony scale!
    0 0
  24. Nice non-technical summary article on the history of atmospheric CO2 measurements at climatecentral. The Mauna Loa volcano rises high above the Pacific on the Island of Hawaii. “Here, the background concentration of carbon dioxide should not be influenced by forests or soils, or an inversion or the weather,” Tans says. “All that is stripped away.”
    0 0
  25. Claim: 

    "the prevailing winds are offshore breezes, which bring clean air from high in the atmosphere down to the observatory"

    Truth: 

    This is absolute nonsense. The typical wind currents on the big island are in fact that exact opposite of what you claim. Air currents blow across Kilauea which has been in constant eruption since 1983 and creates a "plume" which has a clear effect on Mauna Loa. So much so that it's created a phenomena called "Vog" that is a major health risk to residents.

    http://www.soest.hawaii.edu/met/Faculty/businger/poster/vog/

    0 0
  26. Andrew LB @25:

    1)  The active volcano (Kilauea) is located on the South East side of the Island, and South East of Mauna Loa itself.  As can be seen below, the prevailing winds at the site of the observatory (on the ridge between Mauna Loa and Mauna Kea) flow from the east, and do not pass over Kilauea.  The prevailing winds passing over Kilauea (map area) are to the South West, and carry fumes away from the observatory.

    This is illustrated well be the modelled plume for January 26th (of uncertain year), which (as you can see) comes nowhere near the observatory site.

    Both of these figures are drawn from the page to which you linked, and show clearly your claim that the observatory is typically affected by the plume is false.

    2)  The summit of Kilauea is only 1,247 meters above sea level.  According to the site to which you linked, the plume affects an altitude "from 151 meters to 2452 meters".  This is shown anecdotally by the photo from the site to which you linked, which shows the inversion layer distinctly lower than the summit of Mount Haleakala (3,037 meters).  That in turn is significantly lower than the 3,397 meters of the observatory.  Doing the maths, we find that the plume typically does not rise to within 940 meters of the observatory.  So, once again, your source refutes your claims.

    3) The site you link to is an old site, with its first appearance on the wayback machine dating to January 21st, 2003.  

    0 0
  27. Andrew B, even setting aside Tom's maps and analysis, showing that the claim of the Kilauea plume impacting readings at Mauna Loa is fiction... shouldn't the fact that there are not regular large swings in the Mauna Loa data, as winds blow or clear the plume over the observatory, have been enough to see that it was nonsense? Shouldn't the fact that readings at Mauna Loa match those at numerous other sites around the planet have been enough to see that it was nonsense? Shouldn't the fact that thousands of scientists around the world have accepted the accuracy of the Mauna Loa data for decades now, with only random bloggers claiming otherwise, have been enough to see that it was nonsense?

    Here's some nice people at NASA helpfully providing additional reasons the claim is bunk;

    http://earthobservatory.nasa.gov/blogs/climateqa/mauna-loa-co2-record/

    0 0
  28. jg recently created a neat graphic showing why Mauna Loa is a very good spot to take CO2 measurements.

    MaunaLoaSampling

    The relevant rebuttal "Mauna Loa is a volcano" was updated with it a short while ago. It also includes a cleaned up and improved version of the NOAA-graphic of CO2-concentrations measured in different places of the earth.

    CO2Measurements

    0 0

You need to be logged in to post a comment. Login via the left margin or if you're new, register here.


The Consensus Project Website

THE ESCALATOR

(free to republish)


© Copyright 2024 John Cook
Home | Translations | About Us | Privacy | Contact Us