


 Arguments


Recent Comments
Prev 1902 1903 1904 1905 1906 1907 1908 1909 1910 1911 1912 1913 1914 1915 1916 1917 Next
Comments 95451 to 95500:
-
Tom Curtis at 12:16 PM on 2 March 2011Roy Spencer’s Great Blunder, Part 2
Peter Offenhartz @17, you may well be interested in the post on Theory and Experimant at Science of Doom. It contains (amongst other gems) this illustration of the effect of doubling CO2 on radiative forcing: As you can see, most of the effect is in the wings of the 15 micron trough, although there is a slight deepening of the trough in the center, which is the second largest effect. Some other absorption bands currently barely detectable in atmospheric spectrums also start to strengthen.
This is the non-equilibrium response. As the Earth warms to restore equilibrium, there will be an increase in radiation at all frequencies, so that in the equilbrium case, there would be more radiation from the center of the 15 micron band, not less.
Although KR has found mention of 215 K as the brightness temperature at the center of the 15 micron band, I have noticed it as being centered around 220 K, with tropical spectra above that, and polar spectra below.
As you can see, most of the effect is in the wings of the 15 micron trough, although there is a slight deepening of the trough in the center, which is the second largest effect. Some other absorption bands currently barely detectable in atmospheric spectrums also start to strengthen.
This is the non-equilibrium response. As the Earth warms to restore equilibrium, there will be an increase in radiation at all frequencies, so that in the equilbrium case, there would be more radiation from the center of the 15 micron band, not less.
Although KR has found mention of 215 K as the brightness temperature at the center of the 15 micron band, I have noticed it as being centered around 220 K, with tropical spectra above that, and polar spectra below.
-
Tom Curtis at 12:01 PM on 2 March 2011Various estimates of Greenland ice loss
Climatewatcher @15, that graph is currently being discussed on the Crux of a core thread. Essentially its problems for your use are that the most recent temperature from the ice core itself is actually 1855. The red spike at the end is supposed to show global temperature increases to the present, but they do not show global temperatures since 1855, and nor should global temperatures be compared with regional temperatures. Based on a recent analysis of Greenland temperature records, the decadal average of temperatures in Greenland has increased by approx 1.5 degrees C since the 1850's, so current tempertures on that graph should be around -30.5 degrees C, or about the peak of the MWP. 2010 temperatures are another degree warmer than that, or about equivalent to the peak of the Roman Warming. That means the current warming in Greenland is unparalleled in magnitude and abruptness in the last 6,000 years. What is more, the overall decline in Greenland temperatures evident in your graph has a well known cause, the decline in arctic summer insolation related to the Milankovitch cycles. Summer insolation is still declining. To what, then, do you attribute the sudden reversal of thousands of years of cooling? -
Peter Offenhartz at 11:57 AM on 2 March 2011Roy Spencer’s Great Blunder, Part 2
@KR (16) MANY THANKS for pointing me toward the Daniel J. Jacob reference at Harvard. His article is at once brief, comprehensive, and clear. As you note, the main CO2 effective emission temperature is about 215K, which is, I'll bet, right at the knee in the lapse rate curve, which means that rising CO2 concentrations will have little climate effect IN THE MAIN ABSORPTION PEAK. Lest anyone think I've become a global warming skeptic, the real action from changing CO2 concentrations must be taking place on the absorption wings, where the effective temperature is much higher and where rising CO2 concentrations should indeed cause a falling emission temperature. This picture clarifies my understanding considerably, but I'll have to spend more time studying Jacob's chapter. Thanks again KR. -
Charlie A at 11:35 AM on 2 March 2011Crux of a Core, Part 1 - addressing J Storrs Hall
The author of the post being rebutted has a "rebuttal to the rebuttal" posted at http://wattsupwiththat.com/2011/03/01/rebuttal-to-the-skeptical-science-crux-of-a-core/#more-35045 If you have an open mind and would like to be informed, I suggest clicking on over and taking a look. -
dorlomin at 11:08 AM on 2 March 2011Crux of a Core, Part 1 - addressing J Storrs Hall
The author of the post being rebutted, J Storrs Hall, has taken exception to not being addressed as doctor and feels this is a deliberate slight upon him. Perhaps the author would be so good as to address this as a courtisy to Dr Halls wishes? -
KR at 11:04 AM on 2 March 2011Roy Spencer’s Great Blunder, Part 2
Peter Offenhartz - From Daniel J. Jacob, Harvard, working from CO2 emission lines rather than H2O: The 15 mm blackbody temperature in Figure 7-8 is about 215 K, which we recognize as a typical tropopause temperature. It looks like the CO2 effective emission altitude is around 10km or so. -
Trueofvoice at 10:45 AM on 2 March 20112nd law of thermodynamics contradicts greenhouse theory
Damorbel is doing here exactly what he has been doing on the Wikipedia Temperature talk page. He makes repeated objections based on his flawed understanding of the subject, then accuses others who have taken the time to correct his nonsense of attempting to distort the issue. He has absolutely no interest in understanding anything you guys may say to him. He simply wants to argue. -
From Peru at 10:37 AM on 2 March 2011Roy Spencer’s Great Blunder, Part 2
Re:#6.michael sweet Thanks you for the link to the wiki article showing how deep the anti-scientific beliefs of Roy Spencer reach. Roy Spencer accuse climate scientists of a "Great Blunder" in which he blames recent warming on ocean cycles like PDO and ENSO instead of greenhouses gases. He is dead wrong because in the past, the ENSO-PDO climate connection brokes down: during the so-called Medieval Warm Period, the Tropical Pacific was in a protracted COOL state, dominated by a NEGATIVE PDO: Variations in the Pacific Decadal Oscillation over the past millennium And a LA NIÑA protracted dominance: Fossil coral snapshots of ENSO and tropical Pacific climate over the late Holocene Proving that radiative forcing (in the case of the MWP, solar + volcanic) is by far the main driver of climate, not internal oceanic oscillations like ENSO and PDO like people like Roy Spencer want us to believe. Saying all this, I can also show that Roy Spencer, not having enough with spreading nonsense about the climate science, it is an advocate of a pseudoscience far worse than climate "skepticism": intelligent design, that is just a Trojan Horse for Creationism (or as can be described better, evolution denialism). The wiki page given by michael sweet links to this "gem" written by Roy Spencer in the right-wing magazine TCS daily: Faith-Based Evolution The nonsense seen here can be quoted: "Twenty years ago, as a PhD scientist, I intensely studied the evolution versus intelligent design controversy for about two years. And finally, despite my previous acceptance of evolutionary theory as "fact," I came to the realization that intelligent design, as a theory of origins, is no more religious, and no less scientific, than evolutionism." "While similarities between different but "related" species have been attributed by evolutionism to common ancestry, intelligent design explains the similarities based upon common design. An Audi and a Ford each have four wheels, a transmission, an engine, a gas tank, fuel injection systems ... but no one would claim that they both naturally evolved from a common ancestor." Can we trust a "scientist" that wrote such a piece of disinformation? This is not a matter of religious beliefs. The problem here is that he believes that "intelligent design" is a valid scientific theory and should be teached alongside mainstream evolution. This is just crazy. Strange that many climate "skeptics" are also evolution "skeptics". I suspect an ideological, right-wing common root on both positions.Moderator Response: [DB] Fixed link. -
actually thoughtful at 10:14 AM on 2 March 2011Various estimates of Greenland ice loss
Climatewatcher- what does it mean that the temperatures go up as you go down the right axis. Is the negative sign to be believed? Or does your data show that the medieval warming period was over 1C higher than now? To what do you attribute that sharp spike in red on the right side of your graph? -
Peter Offenhartz at 09:43 AM on 2 March 2011Roy Spencer’s Great Blunder, Part 2
@hank(12) Thanks. I'll have a look at your reference when I have some time. @KR (13) I know the mean height for outgoing LW radiation is 4-5 km (that's where the H2O concentration gets very low, due to cooling), but I'm interested in the height for the CO2 band, since CO2 concentration relative to O2 and N2 doesn't change with altitude. I'll keep trying. Thanks. -
dana1981 at 09:14 AM on 2 March 2011How We Know Recent Global Warming Is Not Natural
Jesus - if climate sensitivity is 2°C (0.54 Wm-2K-1), it means the equilibrium warming from the CO2 forcing thus far is: 0.54*5.35*ln(390/280) = 0.96°C. Now certainly it's possible to come up with some convoluted argument that less than 0.4°C surface warming thus far has come from the CO2 radiative forcing that will result in 0.96°C surface warming at equilibrium. You could argue that ocean thermal inertia is huge (but "skeptics" argue that it's small). You could argue that there is a large aerosol forcing offsetting the CO2 warming, and a large unaccounted for 'natural' forcing causing more warming than CO2 (but again, "skeptics" usually argue that the aerosol forcing is small). But realistically, if sensitivity is no less than 2°C, you can't come up with a plausible argument that CO2 isn't responsible for most of the warming we've seen this century. I've got another article on a very similar subject that will be published later this week, called "Climate Sensitivity: The Skeptic Endgame". -
RickG at 08:43 AM on 2 March 20112nd law of thermodynamics contradicts greenhouse theory
@449, Agreed, especially with your last comment. -
ClimateWatcher at 08:39 AM on 2 March 2011Various estimates of Greenland ice loss
Not particularly remarkable when one considers Greenland temperatures through out the Holocene: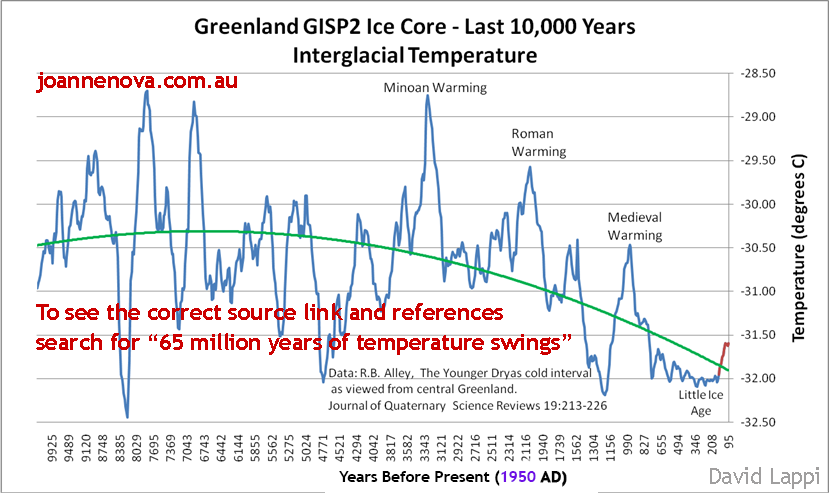
-
KR at 08:28 AM on 2 March 20112nd law of thermodynamics contradicts greenhouse theory
Folks - we've now had 'natural cycles', 'cosmic rays', 'heat of compression', 'it's the sun' and 'thermodynamics and temperature are poorly defined'. And that's just in the last three days. Before that there was 'albedo', multi-layer insulation, 'sunlight can't make it out of the water', 'constant disequilibrium', 'elastic collision of photons', and the lovely bit of obfuscation, "All materials, even gases, have a refractive index >1, consequently no material substance can behave according to the definition of a black body". And without really defending any one position - just moving to the next whenever getting nailed down in contradictions - not the behavior of someone who actually deeply believed anything they were stating. damorbel is, I believe, a troll. His sole purpose here appears to avoid any answers or conclusions, rather than to reach one. I suggest we not feed the troll... -
scaddenp at 08:18 AM on 2 March 20112nd law of thermodynamics contradicts greenhouse theory
I'm still waiting to see whether damobel would change his mind if an experiment showed a result that was incompatible with his application of 2nd Law (and compatiable with standard radiative physics textbooks). -
muoncounter at 07:34 AM on 2 March 20112nd law of thermodynamics contradicts greenhouse theory
damorbel: "Svensmark's cloud generating cosmic rays" Wow, you think that thermodynamics is 'wildly misunderstood,' but you accept Svensmark as a 'powerful effect'? The GCR->clouds->cooling idea fails rigorous scrutiny; even the CERN CLOUD experiment, tailor made by Kirksby to test the idea, is producing "underwhelming" results. See Its cosmic rays. Are we on ABC territory here? Anything but CO2? -
KR at 07:28 AM on 2 March 2011Roy Spencer’s Great Blunder, Part 2
Peter - Excellent question. Science of Doom has a page on that very topic here: Height of emission of OLR and DLR. Outgoing LW radiation occurs at an average of 5km near the tropics and 4km near the poles, as judged by spectra and the Stefan-Boltzmann law. This is well below the altitude of temperature reversal in the lapse rate. -
hank at 07:27 AM on 2 March 2011Roy Spencer’s Great Blunder, Part 2
> At what height (and temperature) is this "top" There's no "top" in that sense -- most of the total heat radiates away from lower down. You can find infrared photographs from satellites and see that. The air is so thin near the "top" that relatively very few molecules exist to radiate -- and those radiate in all directions of course. Here's someone working on building an explanation starting from a simple model and working up to a multiple-layer model and explaining why that's useful: http://how-it-looks.blogspot.com/2010/05/multi-layer-model-of-carbon-dioxide.html -
michael sweet at 07:22 AM on 2 March 20112nd law of thermodynamics contradicts greenhouse theory
I think I should have stayed out of this conversation, but I will answer your direct question. More CO2 does not mean more radiation into space. The increase in CO2 raises the level in the atmosphere where radiation escapes into space (see post 442 above). Since it is colder higher in the atmosphere less radiation is emitted into space and the planet warms. You are defining what is "warming" and what is "heat transfer" incorrectly. CO2 warms the lower atmosphere by reducing heat loss. This is consistant with the second law. The IPCC says the greenhouse effect "warms" the lower atmosphere 33C by reducing heat loss to space. The CO2 does not contribute energy to the system. My blanket warms me 10-15C every night by reducing heat loss from my body to my room. Where is the problem? I will leave this to the others who are trying to explain it to you, I don't think I have anything to add that they have not said before. -
DeanL at 07:17 AM on 2 March 2011Roy Spencer’s Great Blunder, Part 2
What Kevin C says @3 is extremely important. I point to SkepticalScience often and the credibility of the site and its scientific response to the issues is crucial to being useful as a weapon against deception and misconception. I'd go so far as to suggest some of the recent articles on Spencer and Monckton should be reviewed in the light of maintaining a non-political, purely science based approach at SS. I am profoundly grateful for the job John has done in adhering to this approach and I'd hate to see it derailed by a few I'll advised comments in an otherwise very well reasoned post. I think that it will still be very obvious to objective readers as to the motivations and intentions of those being critiqued and, at the end of the day, all scientists make mistakes and deserve the benefit of the doubt. Despite some evidence to the contrary, most people can discern a trend when subtly pointed out! -
bbickmore at 07:05 AM on 2 March 2011Roy Spencer’s Great Blunder, Part 2
Peter #8, I'm not the guy to answer that question, unfortunately. You'd have to find someone who is way into radiative transfer calculations. -
bbickmore at 07:04 AM on 2 March 2011Roy Spencer’s Great Blunder, Part 2
Hi Kevin C #3, I honestly tried very hard to keep the tone moderate. In any case, I certainly didn't say everything that popped into my head! In the example you bring up, note that I didn't ascribe any particular motivation for why Roy Spencer said things about his colleagues that he knows are false. For all I know, he's just never thought about it hard enough to attain some sort of logical consistency. -
Dikran Marsupial at 06:52 AM on 2 March 20112nd law of thermodynamics contradicts greenhouse theory
damorbel The "higher altitude radiation" and "backradiation" are both parts of the same theory (neither violate the second law of thermodynamics). Again you are demonstrating that you do not understand the mechanism of the greenhouse effect. I'm also not going to get drawn into a discussion of the definition of temperature, that is just another attempt at to derail the discussion. You are still avoiding answering the questions I posed in earlier posts. -
damorbel at 06:42 AM on 2 March 20112nd law of thermodynamics contradicts greenhouse theory
Re #442 Dikran Marsupial you wrote:- "If you were familiar with the basic mechanism of the GHE you would know that" I am familiar with a variety of GHE explanations including the "higher altitude radiation" one you cite which is quite different from the "backradiation" one; the one that busts the 2nd law of thermodynamics. None of these AGW - CO2 models stand up to serious examination. But I agree that there are rather too many understandings of how thermodynamics works; even simple matters like the definition of temperature are wildly misunderstood and wrongly taught, particularly at universities. -
damorbel at 06:33 AM on 2 March 20112nd law of thermodynamics contradicts greenhouse theory
Re #440 RickG you wrote:- "Then to what do you attribute AGW?" I am much happier with 'Climate Change' or even better 'Climate Variability' Most of the Sun's heat comes in at the tropics, the atmosphere and the oceans spread this over the globe by various currents that do not follow stable routes; the re is a great tendency to turbulence in fluid flow, even on a global scale. The most obvious example of this is the El Nino current which is highly unstable but there are many, many other currents all of which have powerful heat carrying capacities. Monitoring current flows would go a little way to explaining climate changes. Also Svensmark's cloud generating cosmic rays would have a powerful effect on heat transport in the atmosphere, quite enough to explain ice ages. -
Dikran Marsupial at 06:33 AM on 2 March 20112nd law of thermodynamics contradicts greenhouse theory
damorbel I see you have gone back to refusing to answer direct questions again and instead are opting for evasion instead. "Like I said to Mike Sweet, more CO2 in the atmosphere means the atmosphere become a more powerful radiator of heat, don't you agree?" Even though your question is evasion, to avoid answering my question, I'll answer it anyway. No, I don't agree. The more CO2 in the atmosphere, the higher in the atmosphere IR has to be emitted before it isn't absorbed by CO2 in the layers above. The lapse rate means this layer will be colder, and hence the less radiation that is emitted and so the atmosphere below and hence the surface will become warmer. If you were familiar with the basic mechanism of the GHE you would know that. -
damorbel at 06:23 AM on 2 March 20112nd law of thermodynamics contradicts greenhouse theory
Re #438 Dikran Marsupial you wrote:- "Do you agree with the fundamental point that the atmosphere being warmer than outer space means that the surface looses heat energy to space more slowly than it would if the atmosphere were not there?" Like I said to Mike Sweet, more CO2 in the atmosphere means the atmosphere become a more powerful radiator of heat, don't you agree? -
RickG at 06:18 AM on 2 March 20112nd law of thermodynamics contradicts greenhouse theory
damorbel: Seems to me 'AGW due to CO2' has no validity. Then to what do you attribute AGW? -
damorbel at 05:58 AM on 2 March 20112nd law of thermodynamics contradicts greenhouse theory
Re #438 michael sweet you wrote:- "The energy from the cold atmosphere is not enough to "raise the temperature" of the warmer Earth." But the IPCC says GHE is warming the Planet by 33C - up from 254K to 288K. That is not just a little bit, it's a whacking great amount. Also you wrote:- "It keeps the Earth from cooling as fast as it used to." But radiation from water and CO2 is the way the atmosphere loses heat to deep space. GHE theory says 'more CO2 absorbs more heat' (I thoroughly agree) But doesn't 'more CO2' also radiate more heat into deep space? Seems to me 'AGW due to CO2' has no validity. -
Peter Offenhartz at 05:36 AM on 2 March 2011Roy Spencer’s Great Blunder, Part 2
I think your post was excellent. I know it is hard not to say that a man IS a fool when he BEHAVES like a fool, but I think you did a pretty good job staying on the right side of the line. I have a question that is off-topic, and I hope you will feel free to relocate it elsewhere as you please. My question is about the mechanism of radiative heat transfer in the region of the strong CO2 absorption band. In this band absorption is so strong that the sky is essentially black. All outgoing radiation in the band is initially absorbed close to the surface of the earth. According to the Schwarzschild equation, the absorbed radiation is re-radiated upward and downward, so there is a balance of energy fluxes; it is not until, near the "top" of the atmosphere, that the radiation escapes entirely. Thus, the net flux in this band depends almost entirely on the temperature at the earth's surface and the temperature at this "top", both to the fourth power, of course. My question is simple: At what height (and temperature) is this "top" where the radiation flux is overwhelmingly upward? Is it above or below 10,000 meters? The reason I ask is that the lapse rate changes sign in the 10,000-15,000 meter region; rather than cool with increasing altitude, the atmosphere begins to warm (because of heat/radiation originating in the absorption of the sun's ultraviolet). The usual explanation for the CO2-caused greenhouse effect is that increased CO2 concentrations push this "top" region to higher altitudes where it is colder, and the reduction in radiative flux caused by colder temperatures causes warming at the surface. I understand this, I think. But what if this "top" is at or above 10,000 meters? That's the part I really do not understand, and I would appreciate any help in clarifying this picture. Thanks in advance! -
hank at 05:01 AM on 2 March 2011Climate sensitivity is low
Tom, I agree; same for Spencer's comparable effort at http://www.drroyspencer.com/2010/07/yes-virginia-cooler-objects-can-make-warmer-objects-even-warmer-still/ -
Jesús Rosino at 04:11 AM on 2 March 2011How We Know Recent Global Warming Is Not Natural
Thanks for your answer, dana1981. However, I don't think a low climate sensitivity opens up any window to a natural effect. If such natural factor existed, it might affect climate sensitivity (it might not), but it doesn't work the other way around, i.e., the fact that climate sensitivity was low, IMHO, wouldn't say anything about the likelihood that such natural factor existed. Consider, for example, the uncertainty in radiative forcing from aerosols. Imagine that, within the said uncertainty, aerosols happened not to have cooled the planet much, and their negative radiative forcing is in reality at the lower end of our estimate (close to zero). This would imply that total net radiative forcing would be in the upper end of our estimate (around 2.4 W/m2), and therefore climate sensitivity would be in the lower end of our estimate, with the 'percentage' of warming attributed to human activities unaffected (likely more than 100%). I'll give some numbers, in case it makes my point clearer: Let's assume that equilibrium temeprature change due to current forcing is 1.2ºC. Then, Eg.1: standard (most likely value) estimate of forcing and sensitivity is: Net forcing = 1.6 W/m2 And therefore, Climate sensitivity = 1.2 / 1.6 = 0.75 (W/m2)−1 (that means ΔT = 3.7*0.75 = 2.8 ºC for CO2 doubling) Eg.2 Weaker aerosols (less negative forcing) -> higher net forcing: Net forcing = 2.4 W/m2 --> Climate sensitivity = 1.2 / 2.4 = 0.5 (W/m2)−1 (this means ΔT = 3.7*0.5 = 1.9 ºC for CO2 doubling, with human contributiong being exactly the same) Therefore, I still think that the sentence:even a 2°C climate sensitivity would mean that humans have been responsible for more than half of the global warming over the past century
is misleading, because "a 2°C climate sensitivity" doesn't mean anything by itself about the portion of global warming attributed to human activities. -
Kevin C at 03:58 AM on 2 March 2011Antarctica is gaining ice
No-one answered my question, so I looked up Zhang 2007. From the abstract: "The model shows that an increase in surface air temperature and downward longwave radiation results in an increase in the upper-ocean temperature and a decrease in sea ice growth, leading to a decrease in salt rejection from ice, in the upper-ocean salinity, and in the upper-ocean density. The reduced salt rejection and upper-ocean density and the enhanced thermohaline stratification tend to suppress convective overturning, leading to a decrease in the upward ocean heat transport and the ocean heat flux available to melt sea ice. The ice melting from ocean heat flux decreases faster than the ice growth does in the weakly stratified Southern Ocean, leading to an increase in the net ice production and hence an increase in ice mass. This mechanism is the main reason why the Antarctic sea ice has increased in spite of warming conditions both above and below during the period 1979–2004 and the extended period 1948–2004." If I understand that, the air is warming the water leading to less freezing. However, once frozen, the ice insulates the water below, and the decrease salinity prevents convection from below bringing heat to melt it, so melting is also reduced. The reduction in melting is greater than the reduction in freezing, and so there is more ice. -
Dikran Marsupial at 03:55 AM on 2 March 20112nd law of thermodynamics contradicts greenhouse theory
damorbel re. (f) you are quibbling about the meaning of words again, rather than addressing the fundamental point. Convection and conduction cause a transfer of heat energy from the near surface to the upper atmosphere, but heat energy can only be lost to space through radiation from the upper atmosphere. Hence the atmosphere as a whole acts as an insulator. Do you agree with the fundamental point that the atmosphere being warmer than outer space means that the surface looses heat energy to space more slowly than it would if the atmosphere were not there? Please can you give an answer to h, I have already explained the basics of how the GHE works in (a)-(f). The only bit I have left out is exactly how the equilibrium temperature is determined, which is not required to refute the assertion that the GHE violates the second law of thermodynamics. If you want clarification of a particular point (a)-(f), then ask specifically. Do you agree that the atmosphere impedes energy, in the form of LW IR, being radiated from the surface from reaching space, but does not substantially impede the SW radiation from the sun reaching the Earth's surface? As to your last point. Consider two black-body objects, A and B placed close to eachother in a vacuum at 0K. Both are fractionally above absolute zero, such that the rate at which they randomly emit photons is very low, but body B is fractionally warmer than body A. We observe both bodies for a period of time that is about the same as the period between IR photons being emmitted by the cooler body. Now in some of those periods of observation, a photon will have been emitted by body B and will be absorbed by body A, making it slightly warmer. In a smaller proportion of observation intervals, a photon will be emitted by object A and absorbed by object B. In that case there has been a transfer of energy from a cooler object to a warmer object. This doesn't violate the second law of thermodynamics however, as on average there will be more intervals where the photon went from warmer to cooler than from cooler to warmer, as the warmer object will be emitting more photons. -
michael sweet at 03:45 AM on 2 March 20112nd law of thermodynamics contradicts greenhouse theory
Damorbel, The energy from the cold atmosphere is not enough to "raise the temperature" of the warmer Earth. It keeps the Earth from cooling as fast as it used to. The input energy from the sun stays the same. Since the input energy stays the same and the Earth cools slower the equilibrium temperature of the Earth goes up. The net energy flow is from the warm Earth to the cold atmosphere (as required by the second law), but the greenhouse gasses slow the cooling energy transfer. Standing on the Earth surface slower cooling with the same input energy means hotter. The GHE is not to move net energy from the cold atmosphere to the warm Earth. The GHE slows the rate at which the Earth loses heat to space. -
damorbel at 03:16 AM on 2 March 20112nd law of thermodynamics contradicts greenhouse theory
Re #434 KR you wrote:- "It does not, can not, block energy from moving between a cold object and a warm object," My question is, can the "energy [from] moving between a cold object and a warm object" raise the temperature of the warm object, as described in the GHE? If so how do you calculate it? -
Andy Skuce at 03:13 AM on 2 March 2011Preference for Mild Curry
Rust@36 I agree but it is odd that such wild and poorly thought-out uncertainty estimates--and of a critical parameter to boot--are made by the very climate scientist whose main criticism of the IPCC and others is that they address uncertainty inadequately. -
damorbel at 03:07 AM on 2 March 20112nd law of thermodynamics contradicts greenhouse theory
Re #427 Dikran Marsupial I agree (a)->(e) But then you wrote:- "(f) The atmosphere being warmer than space thus insulates the surface from space, causing it to be warmer than it would otherwise be." Insulate is not really the right word for the atmosphere. The gases of the atmosphere are free to mix and flow, convection is happening all the time, none of these produce the effects of an insulator. "g) This does not violate the second law of thermodynamics as the net transfer of heat is from the warmer surface to the cooler atmosphere." Couldn't agree more! "(h) The greenhouse effect thus does not violate the second law of thermodynamics, and Roy Spencer (amongst others is perfectly correct on this point and G&T are flat wrong)." I'd like to know how you think the GHE effect works. 2nd law of thermodynamics states that energy does not transfer spontaneously from a cold place to a hotter. For example, can energy transfer from a place at 0K to a place at 50K? If this were true I suggest that energy might indeed transfer spontaneously (in the atmosphere) from 250K to 300K but I don't see it happening somehow. -
KR at 02:04 AM on 2 March 20112nd law of thermodynamics contradicts greenhouse theory
I've actually found most of the misunderstandings of the greenhouse effect and the 2nd law of thermodynamics are intimately tied to the Fallacy of Division: that what is true of the whole is true of the constituents. "4 is even. 1 and 3 are part of 4, so they must be even too!" Each individual energy transfer - collision, molecular diffusion, photon absorption/emission - can occur in any direction. From a cold nebula to a star, from a candle to a plasma torch, from your hand to the boiling pot you mistakenly grabbed. It's only statistically, in the aggregate, that "Heat" transfer shows up, as the higher energy moves to the lower, based on the fact that there are many more energy transfer events going in that direction. The 2nd law of thermodynamics, and entropy, is a statistical law, a law of summations, not a factor in individual molecular events. It does not, can not, block energy from moving between a cold object and a warm object, adding to its energy. It's just that statistics indicate a greater number going the other way - and with molecular numbers statistics are pretty much a dead certainty. This fallacy is never more clear than with the "colder objects can't heat warmer ones", where I've seen attempted justifications such as "warm objects won't absorb low energy photons!", "destructive interference of cold photons with warm ones keeps them away", and my favorite "They just know, and the warm object doesn't accept them!" When faced with such "logic", it's a tossup whether to laugh, cry, or fetch a strong beer... --- I have to compliment fellow posters for their patience too - Dikran, les, muoncounter, everyone else. I find this website a fantastic forum for civilized discussion; I cannot think of another place where this wouldn't have degenerated into poorly written invective a long time ago. -
Daniel Bailey at 02:01 AM on 2 March 20112nd law of thermodynamics contradicts greenhouse theory
Re: JMurphy (432) Indeed. One was left with the sound of one hand clapping... The Yooper -
JMurphy at 01:54 AM on 2 March 20112nd law of thermodynamics contradicts greenhouse theory
I agree with muoncounter's moderator response above, but would also add commendations to Dikran Marsupial and les - as well as several others who tried their best to impart their knowledge. I certainly found it very educational, if only because you all had to go round and round repeating the same facts again and again, hoping it would all sink in eventually ! It worked with me, anyway... (Strange how none of the self-appointed expert so-called skeptics got inolved, though. No, actually, it's not strange at all, is it ?) -
Dikran Marsupial at 01:51 AM on 2 March 20112nd law of thermodynamics contradicts greenhouse theory
@muoncounter Not only should st. KR be commended, he should be canonised - he clearly has the patience of a saint, so he should get the honorific as well ;o) In discussions of climate, again and again we see evasion, pedantry a refusal to stick with thought experiments intended to clarify matters and a refusal to give a direct answer to a direct question (which risks giving a hostage to fortune - but those only interested in the truth are not bothered by that). The, best approach to dealing with this seems tireless patience; it is quickly evident who is there to discuss the science, but it shouldn't really be necessary.Moderator Response: [muoncounter] Agreed: St. KR it is. Forgive me if I omitted thanking anyone who has stayed with this for the long haul; haste causes carelessness. It is a shame when a thread becomes so long and convoluted that contributing posters finally say 'enough.' -
MA Rodger at 01:37 AM on 2 March 2011Arctic sea ice... take 2
A "Johnny-come-lately" comment, but I really do dislike the PIOMAS graph in this article, almost as much as the NSIDC "percentage multi-year ice" graph posted above at #38. Neither graph allows the observer to assess the significance of these measurements of ice loss. The data used to make the PIOMAS anomaly graph shows summer 2010 volumes dropping below 4,000 km3 with an annual average loss running at 900 km3 over recent years. The NSIDC graph ignores the 30% reduction in summer ice extent. With the reducing extent factored onto the graph, the conclusion looks far more stark - 700,000 km2 of old ice with an annual drop of 300,000 km2 over recent years. -
witsendnj at 01:31 AM on 2 March 2011Scientists tried to 'hide the decline' in global temperature
The tree rings started to diverge from expected growth due to increased temperatures because their ability to photosynthesize is increasingly impaired due to exposure to toxic background tropospheric ozone, the level of which is inexorably rising. http://witsendnj.blogspot.com/2011/02/rude-awakening.html yes, it's a blog! If anyone knows of tree ring data being collected in the past decade I would be very interested to see it, because it is certain to reflect radically reduced growth - if not shrinkage. -
SNRatio at 01:07 AM on 2 March 2011Roy Spencer’s Great Blunder, Part 2
I second #3, Kevin C. I think it is great to have those outspoken rebuttals, and while polemical, I don't think it is over the top at all. BUT: We need the "official" version too, from which it could be cut and pasted almost anywhere, including encyclopedies. You may think of it as being a referee for a book chapter, pointing out the problems and inconsistencies without drawing conclusions. And re Spencer's relation to mainstream science, it is enough to describe it, and make a list of problems he does not acknowledge or relate to. Leave to the readers to draw their own conclusions. Less is more. And while it may be significant for an overall assessment of Spencer's character, his religous beliefs etc must be kept as separate as possible from his scientific involvement - even if he does not always keep the separation clearly enough himself. Which, to me, implies that comments about his beliefs and extra-scientific enterprises belon in the comments - not in the article text. However illuminating such information may be! -
michael sweet at 01:04 AM on 2 March 2011Roy Spencer’s Great Blunder, Part 2
Roy Spencer has published essays stating that he thinks Creation explains the origin of life better than evolution see this Wiki article. He might agree with the Flood explaination. We need to remember that Spencer made the same accusations that everyone else was wrong and he was right with the satelite temperature data. For 10 years he insisted that his analysis showing the troposphere was not warming was correct and everyone else was wrong. In the end other scientists corrected Spencers mistakes and now the satelite record agrees with other methods. He was wrong before, why should he be correct this time around? The deniers do not care that he is always wrong, their only goal is to delay action until the problem is catastrophic.Moderator Response: [Dikran Marsupial] Dr Spencer's religious views have no bearing on the correctness of his scientific arguments, and are getting very close to being an ad-hominem. Please confine the discussion to the science and steer clear of such issues. -
KR at 01:01 AM on 2 March 20112nd law of thermodynamics contradicts greenhouse theory
damorbel - If the sun heated the Earth via heating the atmosphere (which seems to be what you are arguing), the lapse rate would be reversed and there would be essentially no convection. This is not the case. Sunlight passes through the atmosphere, heats the Earth just as the heater coil in my example did. "If you blocked the Sun off (and you can) the Earth would cool. This is because the Sun is external to the Earth and its atmosphere." - This is a complete red herring. You could turn the heater coil on the block off and on again - it doesn't change the physics of heat transfer. Claiming that is quite the horrid dodge, damorbel - you're really straining there, and I find it appalling. You've painted your argument into a corner. Energy goes from the Sun -> Earth -> Atmosphere -> Space, with the atmosphere acting as an insulator. --- Everyone, this has been quite a discussion. >400 posts on the greenhouse effect, many of which have done a good job looking at the physics. Unfortunately, damorbel, you seem willing to go to extremes to deny the radiative greenhouse effect, including that silly bit about 'turning the sun on and off' to attempt to disprove the fact that the atmosphere is heated by the Earth's surface. At this point I have to consider you to be either (a) a troll, stretching this out to claim controversy on the topic, or (b) fanatically unwilling to listen to reason and abandon your incorrect ideas on thermodynamics. Either way, damorbel, you are no longer worth my time. I believe the current thread has plenty of information for newcomers, who can clearly judge the topic (and posters) based upon what they read. I'm done here.Moderator Response: [muoncounter] KR should be commended for showing terrific patience in going this far. [DB] Seconded. I would add that I found myself learning the subject even more thoroughly as a result, so in that regard it was time not wasted. -
muoncounter at 00:52 AM on 2 March 2011Various estimates of Greenland ice loss
"I've already said that" But you didn't put that data into the txt file you linked. Hopefully its monthly, so the seasonal picture can be extended, particularly as autumn began averaging over 0C at the tail end of the Vinther data in that txt file. "easier to talk about regions where no measurements were taken" True, but irrelevant. Box has measurements from 27 stations well-distributed over Greenland. His conclusion: a lack of spatial correlation between east and west coasts. -
adelady at 00:24 AM on 2 March 2011On the reliability of the U.S. Surface Temperature Record
Am I right in thinking these people don't know the difference between an airport and a landing strip? I think I've just discovered that Orroroo "airport" would have a major impact on the climate record for the southern Flinders Ranges. Presumably Wilpena Pound Airstrip with all the tourist joyrides would have an even more direct effect. (I doubt Orroroo averages too many landings per month.) Must write to the BOM, they need to keep up to date. Glad to keep learning new things every day. -
Alexandre at 23:15 PM on 1 March 2011Monckton Myth #15: Tragedy of the Commons
About Nash: According to Ostrom's findings, Nash equilibrium turns out to be a poor predictor of human behaviour in common-pool dilemmas. It comes closer to reality when communication is absent, but it's an unrealistically pessimistic predictor overall.
Prev 1902 1903 1904 1905 1906 1907 1908 1909 1910 1911 1912 1913 1914 1915 1916 1917 Next


