


 Arguments


Recent Comments
Prev 190 191 192 193 194 195 196 197 198 199 200 201 202 203 204 205 Next
Comments 9851 to 9900:
-
rupisnark at 05:51 AM on 28 July 2019Models are unreliable
MA Rodgers @1119
Re response to @1117
♣ ….You bat the"~750 Million Units" into the long grass but there is also the "6 trillion" which is part of the talk transcript While the 750M quantity could be considered as the rough total (that's total as in down to absolute zero) heat content of the atmosphere per sq metre of the planet, the 6T quantity would be 80 times more than the equivalent for the oceans (which are usually considered the largest thermal pool the climate has to cope with). So what the 6T quantity is supposed to be, I know not. I assume it is just meant to appear very very big.
->6trillion. As a guess, could the heat content of the Earth might be the figure he is referring to? The mass of the earth is more than 4*10^6 times bigger than the mass of the water on earth, so it is within a few orders of magnitude! I have no idea how much heat transfer is going on between the oceans and the rest of the Earth, there would obviously be different speed of change issues compared to atmosphere/ocean and atmosphere/Earth’s surface. Happy to be shot done on this one if my guess is unreasonable.♣ Slide 1 of Christy (2019) says it takes the values from AR5 Fig 2.11. It is Christy's comparison, not mine.
->I was not sure whether you did or didn’t agree with my previous summary of the point:-
The imbalance of 0.6W/m2 (0.18 units?), the statement that at the surface it is in balance, and the claim that 0.5 units is caused by extra CO2 whereas 100 units is caused by H20, clouds and aerosols (and not mentioned but presumably also existing CO2).
I understand you do disagree with the 6tr figure (and 750 units).
[I may appear to be slowly going through certain points, but I have learned from experience in many different fields, that this is an effective method of reaching a proper understanding, clarifying where difference of opinion lie and exposing falsehoods (which I believe is also one of the aims of this website).]Re response to @1118
♣ The non-denialist distortions would be a more interesting subject, if you know of any.
->I am making a list of them. I will then contact the people who appear to have distorted matters to enable them to respond (and if I have misunderstood, to enable me to correct my misunderstandings). I want to see who is distorting matters, not to add to the many distortions already floating around.
♣ Whether you have the time to cope with all the nonsense served up by Christy, or not. We haven't got very far with the content of this Christy talk in more than one iteration. And there is the question of whether I (or others) could be fussed to continue untangling the garbage of you into chunks you will understand.->We have not got far because your initial response only discussed one of the many points raised in the lecture. The more points you can answer the quicker I will understand. I have come to this forum with the aim of checking for myself some claims which have extraordinary consequences and if the claims made by your side of the debate were wrong could reduce GDP in 50 years time by well in excess of current world GDP. If true it could have the widely discussed consequences.
[https://www.theguardian.com/environment/2019/jun/06/cutting-uk-emissions-net-zero-cost-1tn-philip-hammond…. I am taking a 1% reduction in global GDP pa to combat global warming… again estimates vary widely.]
If you do not wish to respond fully, I can understand that; but don’t then complain that the public are not willing to reduce their own and their children’s standard of living for a cause that have less than complete faith in.
♣ Note these Sea Surface temperatures (which C&M 2017 appears to say it uses to subtract ENSO from its TLT record) are not de-trended (as for instance the AMO is) so they do still have an AGW signal. Subtracting the NINO signals will thus also subtract some AGW signal
->I need to read further on this point. References welcome.
♣ Does C&M(1994) repeat the method of C&M(2017)? The implication is that it does (note that I have not access to C&M1994) but one difference is the UAH TLT v5.6 record was not used in 1994 as it didn't exist. The corrections to the UAH data set (mainly not the result of work by the UAH team) would have made significant changes to the 1994 result. So it is strange that C&M(2017) only finds a very small difference
->You seem to have a good point here… I will try to get hold of Christy at some point and challenge him on this and other matters. ( I have no idea if he will respond).
♣ Christy was one of six lead authors of Chapter 2 of IPOCC WG1 TAR (1990). Note the prmary finding of that chapter "The warming rate since 1976, 0.17°C/decade." This contradicts the primary finding of both C&M(1994) and C&M(2017).->He could agree with that conclusion and his 1994 and 2017 papers could still be valid, given for example that he is adjusting for Volcanic and El Nino effects and there may be other caveats in the paper; so I am not sure that it does contradict those findings.
♣ If Christy is happy to give the GWPF the time of day, he will get no respect from me!!!
->I have no idea what Christy’s views of the GWPF are. I don’t think Christy gets any respect from you anyway, given your previous comments. Again, I would rather that we just discuss issues, adding this type of comment is not helpful.
-
Rob Honeycutt at 02:33 AM on 28 July 20192019 SkS Weekly Climate Change & Global Warming News Roundup #27
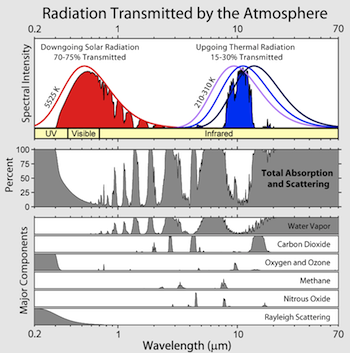
When you look at an O3 molecule you can see how it's going to have vibrational modes. I'm assuming that's what is necessary for absorption in IR frequencies.


-
MA Rodger at 22:45 PM on 27 July 20192019 SkS Weekly Climate Change & Global Warming News Roundup #27
John Seers @39,
As Eclectic @40 says, the annotated IR absorption at 9 µm in the graphic @38 is ozone (O3) but there are still O2 absorption lines in the IR just short of the visible and so should be represented on that graphic. They are at 1.27 µm and 1.06 µm. However these would not make O2 an Earthly GHG as the IR emissions from planet Earth only span 70 µm to 5 µm.
-
Eclectic at 22:21 PM on 27 July 20192019 SkS Weekly Climate Change & Global Warming News Roundup #27
JohnSeers @39 , perhaps you are looking at the diagram via a small screen.
Mine shows the Oxygen as O3 .
-
JohnSeers at 21:35 PM on 27 July 20192019 SkS Weekly Climate Change & Global Warming News Roundup #27
@Rob Honeycutt 38
"A greenhouse gas is a gas that absorbs and emits radiant energy within the thermal infrared range."
"Oxygen and nitrogen are not greenhouse gases, because they are transparent to infrared light. "
Your diagram is indeed worth a thousand words.
I notice that O2 absorbs IR which was a bit of a surprise to me. Yet it is not a greenhouse gas. Can you, or anybody, explain? Thanks.
-
icowrich at 17:40 PM on 27 July 2019Analysis: How Trump’s rollback of vehicle fuel standards would increase US emissions
California standards are critical, because no company will build a car that can't sell in California. Unless the White House can figure out a way to invalidate California emissions standards, these EPA regs won't matter.
-
Rob Honeycutt at 04:23 AM on 27 July 20192019 SkS Weekly Climate Change & Global Warming News Roundup #27
A picture is worth a thousand words. The reason IR detection can pick up a single human from an aircraft is, specifically, because they know what frequency NOT to tune the device.
-
JohnSeers at 20:04 PM on 26 July 20192019 SkS Weekly Climate Change & Global Warming News Roundup #27
36
Good answer MA Rodger. Thank you.
-
MA Rodger at 19:08 PM on 26 July 20192019 SkS Weekly Climate Change & Global Warming News Roundup #27
billev @30 &33,
I would agree with fellow commenters that you are demonstrating ignorance but perhaps we can rectify that situation.
Your assertion @30 that you see "no correlation between the periods of pause in temperature rise and EL Nino activity" would be reasonable if you could find your way to making clear which "periods of pause in temperature rise" you are referring to. We know you will be using NOAA data (although that is not of any significance) and will be considering only post-1959 data. And pretty-much all of that period sees global temperature "pauses" resulting from ENSO or volcanic activity, as per the Foster & Rahmstorf (2011) adjustments described @32.
The remainder of you comment @30 and the entirety of that @33 concerns IR transmission through the atmosphere. Your questions @30 are rather poorly framed. The amount of IR emitted by the surface that is absorbed within five feet will depend on the wavelength. In the 15 µm band absorbed by CO2 (which is a significant portion of the whole) 100% would be absorbed but then quickly re-emitted. Again it would be re-absorbed after a short distance. This in itself would make no significant difference to the temperature measurements or indeed the temperature as the energy does not hang about, it being very quickly re-emitted another small distance (up, down or sideways) where it will again be absorbed/re-emitted and on and on. The impact on temperature is trivial. (You will perhaps note that this is not the nub of the AGW mechanism.)
@33 you reference the "U.S. weather service." @26 you also mentioned this was a source of data you were referring to but I fear you are probably mis-citing the US Standard Atmopsphere (presumably the 1976 version) which is the work of NOAA, NASA & USAF. Can you provide your reference as in the circumstance it is good to be clear exactly what you are talking about.
Your major point @33 is that the abilities of "aircraft equipped with IR detection equipment" somehow is not compatable with the existence of a a greenhouse effect. You may find the responses @34 &35 a bit too involved. Very simply put, IR 'thermography' uses shorter IR wavelengths than the 15 micron band that is absorbed by CO2 and gives us AGW, shorter wavelengths where the atmosphere is less opaque. (These wave bands are often called 'windows'.)
-
Bob Loblaw at 13:18 PM on 26 July 20192019 SkS Weekly Climate Change & Global Warming News Roundup #27
scadednp has it right: billev's "questions" are getting tiresome.
Gases all absorb at very specific wavelengths. It's a fundamental aspect of spectroscopy. In comment 30, I pointed to a vendor's page on gas analyzers. By choosing the appropraite wavelength, different gases can be measured because they absorb at different wavelengths. Gases emit at different wavelengths, too - and this is how looking at distant planets can tell us their atmospheric composition.
Whaever billev thinks his "questions" apply to, it's not reality.
-
scaddenp at 12:16 PM on 26 July 20192019 SkS Weekly Climate Change & Global Warming News Roundup #27
This is getting tiresome. I find it astonishing that you continue to assert that you know more than scientists while at same time demonstrating your ignorance.
IR detection of mammals from planes etc is hugely limited by the atmosphere. This is basic. Windows of IR that dont interact with GHGs are fundamental to such detectors. Try here for the basics. Does it occur to you that attenuation of IR by atmosphere is easy to measure and we have been doing so for over 100 years? The codes used by climate science to calcualate the transmission of radiation through the atmosphere were developed by USAF. Surely you would suspect that they keen for result to be accurate?
-
billev at 11:23 AM on 26 July 20192019 SkS Weekly Climate Change & Global Warming News Roundup #27
But it is a soup comprised of miniatures that doesn't appear to have a significant effect on air temperature if you consider the air temperature measurements of the U.S. weather service. As far as atmospheric CO2's effect on the passage of IR I point to the fact that aircraft equipped with IR detection equipment are able to pinpoint the location of even single humans based on their IR signature. That doesn't argue well for the the capability of atmospheric CO2 to significantly hinder the passage of IR. This applies to my earlier question about atmospheric CO2's capability to effect IR passage between the Earth's surface and the level of standardized air temperature measuring devices around the World.
-
Bob Loblaw at 11:17 AM on 26 July 20192019 SkS Weekly Climate Change & Global Warming News Roundup #27
billev:
You can't see something you refuse to look at. For the effects of El Nino on global temperatures, look no further than this paper. Once effects of El Nino volcanic aerosols, and solar variability are removed, very little year-to-year variation is left.
For a readable summary of the Foster and Rahmstorf paper, try here. The key graphic is the following:
As for chasing the squirrel of IR radiation affecting near-surface air temperature measurements, you really are scraping the bottom of the barrel. Air temperature in the lower tens of metres is vastly controlled by ground (or ocean) surface temperature, which is heated by the sun. Air temperature measurements are taken inside radiation shields, such as the Stevenson Screen. This not only eliminates IR effects, it pretty much removes errors related to solar radiation heating, which is a far more important issue. We've only known about these sort of issues since the mid-1800s.
You're not catching up - you're falling even farther behind. Yesterday, it was 1964 information you were missing. Now it's 1864 information. As one of my colleagues says "he's so far behind he thinks he's in the lead".
-
Eclectic at 10:00 AM on 26 July 2019Skeptical Science New Research for Week #29, 2019
Garb @2 ,
it would be good if you could check the paper in "opinione.it" [which does not sound much like a peer-reviewed scientific journal ~ where serious scientific is published!] and pull out for us, one or two or three scientifically-valid points of evidence negating the mainstream climate science the last 150 years or so.
A decade or two ago, a petition was raised by 31,000 American scientists [or at least, people having some sort of science degree] who asserted that the climate science was wrong. The petitioners ranged from "A" a biologist, to "Z" a wood engineer. Hardly any had specialist climate experience or did research in the climate field.
More importantly, the petitioners did never then, or up to today's date, produce any genuine evidence to back up their assertion. We can only think that their statement was an expression of crackpot ideation (sorry, I don't know the correct Italian translation of crackpot) or was an expression of their extremist political beliefs. [By definition, political beliefs must be extremist, if they disregard the scientific reality.]
It will be interesting to discover whether these 90 Italian scientists have anything to show. Unlikely, I would have thought ~ since there has been nothing published in the scientific literature to negate the "anthropogenic impact".
( Also interesting, that these 90 Italian scientists would be going against the Pope's own well-informed opinion on climate science . . . and against the Pope's council of senior scientists . . . and against all the leading august scientific bodies, worldwide. Perhaps they are 90 Galileos, who have been hiding themselves in a secret chamber for 30 years !!! ]
-
Philippe Chantreau at 09:33 AM on 26 July 2019Skeptical Science New Research for Week #29, 2019
Meanwhile, there is this serious research coming up:
https://science.sciencemag.org/content/365/6451/369
It is Science Magazine, so under subscription, here is an excerpt from the abstract:
"The observed melt rates are up to two orders of magnitude greater than predicted by theory, challenging current simulations of ice loss from tidewater glaciers."
2 orders of magnitude. Will be interesting to see what further research shows...
-
Philippe Chantreau at 09:27 AM on 26 July 2019Skeptical Science New Research for Week #29, 2019
It would probably not be interesting at all to take a look at it and there is usually little variation as to why these types of operations are launched.
-
Garb at 09:17 AM on 26 July 2019Skeptical Science New Research for Week #29, 2019
Hi !
I was recently made aware about a petition that supposedly 90 italian scientists are supposed to have signed and sent to the Italian government to make them reject the "hysterical" claims that are made about climate change, and that they question the science behind the anthropogenic impact on the climate:
http://www.opinione.it/cultura/2019/06/19/redazione_riscaldamento-globale-antropico-clima-inquinamento-uberto-crescenti-antonino-zichichi/?altTemplate=Stampa&fbclid=IwAR1YAoqulAKKXJTY-uzRfSEaX-G6NRpVOckp3nVE7iiTAgOQu8DMHGUxRnE
Here it is in the paper:
http://www.opinione.it/cultura/2019/06/19/redazione_riscaldamento-globale-antropico-clima-inquinamento-uberto-crescenti-antonino-zichichi/
And are mentioned in some other kind of press:
https://www.policymakermag.it/italia/clima-petizione-controcorrente-firmata-dagli-scienziati-italiani/
It would be interesting if you would take a look at it, as I have seen multiple blogs copy and paste it (often direct from google translate). If a large number of Italian scientists are questioning the science in IPCC's reports, it would be nice to understand why.
-
Eclectic at 09:10 AM on 26 July 20192019 SkS Weekly Climate Change & Global Warming News Roundup #27
Billev @30 ,
the whole lower troposphere is a soup of continually absorbed/radiated IR photonic energy. Doesn't matter if you are talking about five feet, five thousand feet, or five inches altitude.
Is there a point behind your question? As a reader, I find it hard to distinguish whether you are trying to make some (obscure) point, or whether you are just completely failing to understand the the physics of the Greenhouse Effect. Please, please explain what you are on about !
-
billev at 08:08 AM on 26 July 20192019 SkS Weekly Climate Change & Global Warming News Roundup #27
I see no correlation between the periods of pause in temperature rise and EL Nino activity. What percent of IR radiated from the Earth' surface is absorbed within five feet of the Earth's surface? How much does this effect temperature measurements made from four to five feet from the Earth's surface?
-
nigelj at 07:40 AM on 26 July 2019Analysis: How Trump’s rollback of vehicle fuel standards would increase US emissions
Bozzza, Trump undoubtably has several motivations because such is the nature of life. One would be that Trump and his cronies clearly don't like Obama very much, have a read of this: How Trump is rolling back Obama’s legacy. Anyone who doesn't see racism, ego and pure spite in this has their head in the sand as far as I'm concerned.
-
Estoma at 01:13 AM on 26 July 2019Analysis: How Trump’s rollback of vehicle fuel standards would increase US emissions
should be "less affordable."
-
Estoma at 01:12 AM on 26 July 2019Analysis: How Trump’s rollback of vehicle fuel standards would increase US emissions
Back in the 90's, when the Clinton Administration made a feeble attempt to increase CAFE standards, congress gave the auto industry a pass. The industry lobbiests told the legislators that the market knew what was best and the market was saying that Americans wanted to drive gas gobbeling Yank tanks.
During the years preceeding the gasoline shock of 2007, foreign manufactures continued to develop more efficient cars. When the Great Financil Collapse of 2008 occured no one wanted the American gas gobbeling cars and trucks. As a result, the industry lay comatose of the floor needing the American government to revive it.
Ironically Trump could actually help provide more fuel (pun intended) for the electric car market by making electric vehicles even more affordable due to the lax standards for the internal combusion engine.
Anyway I read where Elizabeth Warren was predicting another financail meltdown, possibly in the next couple of years.
-
michael sweet at 22:35 PM on 25 July 2019Analysis: How Trump’s rollback of vehicle fuel standards would increase US emissions
Bozzza,
Oil companies make more money with lower standards since more gas is burned. The auto manufactures do not care much about this change.
-
bozzza at 19:16 PM on 25 July 2019Analysis: How Trump’s rollback of vehicle fuel standards would increase US emissions
What are his reasons for rolling back emission standards?
-
Bob Loblaw at 11:42 AM on 25 July 20192019 SkS Weekly Climate Change & Global Warming News Roundup #27
billev:
Your "argument", to use term loosely, consists only of a series of vague "I don't believe it" positions, interspersed with "look! Squirrel!" diversions to another topic. If you could a ctually put togther a coherent statement of specifically what you expect to see as evidence, we might get somewhere.
To start, if you don't belive that CO2 affects IR radiation at all, perhaps you should tell the people at Licor, which is one of many companies that use the known optical properties of CO2 to make IR-radiation-based instruments to measure CO2 concentrations in air. Commercial companies, making money by selling off-the-shelf instrumentation capable of making measurements because CO2 absorbs IR, even over very small path lengths of air. The same principles are used to measure water vapour, ozone, and many other gases.
https://www.licor.com/env/products/gas_analysis/
The physics of IR absoprtion of CO2 don't change just because they are used in climate models. There are people that can actually do the calculations. In Comment #20, I refer to an old comment that includes a direct reference to a paper published in 1964. Please try to catch up.
-
Daniel Bailey at 08:40 AM on 25 July 201997% consensus study hits one million downloads!
From a science perspective, the most-important sound-bite of that Guardian article is this:
“This paper should finally stop climate change deniers claiming that the recent observed coherent global warming is part of a natural climate cycle. This paper shows the truly stark difference between regional and localised changes in climate of the past and the truly global effect of anthropogenic greenhouse emissions,” said Mark Maslin, professor of climatology at University College London.
-
John Hartz at 07:34 AM on 25 July 201997% consensus study hits one million downloads!
In this Guardian article posted today, Jonathan Watts extensively quotes John Cook about the consensus in a light of three new peer-reviewed papers published in Nature. The article:
No doubt left’ about scientific consensus on global warming, say experts by Jonathan Watts, Environment, Guardian, July 24, 2019
Two relevant paragraphs from the article:
A 2013 study in Environmental Research Letters found 97% of climate scientists agreed with this link in 12,000 academic papers that contained the words “global warming” or “global climate change” from 1991 to 2011. Last week, that paper hit 1m downloads, making it the most accessed paper ever among the 80+ journals published by the Institute of Physics, according to the authors.
The pushback has been political rather than scientific. In the US, the rightwing thinktank the Competitive Enterprise Institute (CPI) is reportedly putting pressure on Nasa to remove a reference to the 97% study from its webpage. The CPI has received event funding from the American Fuel and Petrochemical Manufacturers and Charles Koch Institute, which have much to lose from a transition to a low-carbon economy.
On one hand, that the Competitive Resource Institute and its powerful conservative backers are pressuring NASA to remove its page on consensus messaging from its website is indeed disturbing. On the other hand, this effort reveals how powerful the consensu messaging is because the climate science denier community is working hard to suppress it.
-
scaddenp at 07:23 AM on 25 July 20192019 SkS Weekly Climate Change & Global Warming News Roundup #27
billev - I can only assume that you havent bothered to read any of the references that people have provided to you. I provided direct measurement of the increase in irradiation from the increase in CO2. The change in irraditation is measured in instruments on the surface at stations all over the world. (eg see here). I cannot see how you can deny what is measured. Since GHGs block outgoing radiation, the change in irradiation can also be measured by satellites. Eg see Chen 2007. Furthermore, the change in radiation measured, matches the calculated result of the change GHG is extraordinary degree. These measurements directly support the claims made.
You seem to struggle with idea that 400ppm could have an effect. Perhaps you should consider how far a photon would travel on average (mean free path) through an atmosphere with 400ppm of CO2 before it hit a CO2 molecule? Write down your intuition, and then calculate it. I suspect the answer will surprize you.
-
Daniel Bailey at 07:08 AM on 25 July 20192019 SkS Weekly Climate Change & Global Warming News Roundup #27
Ah, yes, the Black Knight defense.
-
billev at 06:28 AM on 25 July 20192019 SkS Weekly Climate Change & Global Warming News Roundup #27
I have based my submissions on the measurement of atmospheric CO2 level by the reporting station at Muana Loa, temperature at altitude measurement by the U.S. Weather Service and global annual air temperature meaurement and computation by NOAA. All of the replies to my submissions contain no reference to any measurement to support their stated or implied claims for the role of atmospheric CO2 in the rise of global air temperature.
-
Daniel Bailey at 02:47 AM on 25 July 2019Michaels Misrepresents Nordhaus and Scientific Evidence in General
"At what degree does the Arctic lose it's ice during the summer months?
Fortunately, scientists have looked into the effects of an ice-free Arctic.
Pistone et al 2019 - Radiative Heating of an Ice‐free Arctic Ocean
"Here we use satellite observations to estimate the amount of solar energy that would be added in the worstcase scenario of a complete disappearance of Arctic sea ice throughout the sunlit part of the year. Assuming constant cloudiness, we calculate a global radiative heating of 0.71 W/m2 relative to the 1979 baseline state. This is equivalent to the effect of one trillion tons of CO2 emissions. These results suggest that the additional heating due to complete Arctic sea ice loss would hasten global warming by an estimated 25 years."
Takeaways:
1. "Of the 0.71 W/m2 of globally-averaged heating, 0.21 W/m2 is estimated to have already occurred between 1979 and 2016. Approximately half (0.11 W/m2) of this realized heating occurred during the CERES observational record (2000-2016), with the other half occurring between 1979 and 1999 as estimated based on the observed relationship between satellite-derived sea ice concentration and albedo."
2. "we cannot exclude the extreme possibility that the Arctic could become annually ice-free during the coming decades"
3. "even in the presence of an extreme negative cloud feedback, the global heating due to the complete disappearance of the Arctic sea ice would still be nearly double the already-observed heating due to the current level of ice loss"
4. "The present study focuses on the additional radiative heating from the complete loss of Arctic sea ice, but it does not estimate the amount of global warming that would be associated with this level of ice loss"
5. "even under conditions in which the Arctic Ocean becomes ice-free only in September, the additional radiative heating may likely be driven largely by the associated midsummer sea ice loss"
6. Arctic sea ice will continue to re-form in Arctic winter for the foreseeable future even after the loss of summer sea ice (the sun-lit portion of the year the paper primarily deals with)
Money section:
"This heating of 0.71 W/m2 is approximately equivalent to emitting one trillion tons of CO2 into the atmosphere. As of 2016, an estimated 2.4 trillion tons of CO2 have been emitted since the preindustrial period due to both fossil fuel combustion (1.54 trillion tons) and land use changes (0.82 trillion tons), with an additional 40 billion tons of CO2 per year emitted from these sources during 2007-2016 (Le Quere et al., 2018). Thus, the additional warming due to the complete loss of Arctic sea ice would be equivalent to 25 years of global CO2 emissions at the current rate.
This implies that if the Arctic sea ice were to disappear much more rapidly than in current climate model projections, it would drastically shorten the time available to adapt to climate changes and the time for achieving carbon neutrality."
-
michael sweet at 22:17 PM on 24 July 20192019 SkS Weekly Climate Change & Global Warming News Roundup #27
Billev,
At 21 you ask about " the periods of pause in temperature rise". In the upper right of the page on every page on SkS is the graph of the Escalator. The Escalator shows that there are natural periods of lower rise interspersed in the overall rise in temperature. (I do not know how to attach the graph here).
-
MA Rodger at 19:23 PM on 24 July 20192019 SkS Weekly Climate Change & Global Warming News Roundup #27
billev @21,
You have up-thread set out your arguments for CO2 not being able to operate as a GHG (@7 - CO2 concentrations of 0.04% are too small to have any effect. @10 - Air does not insulate hot water pipes well enough. @13 - The atmosphere gets colder with altitude suggesting some form of heat loss with altitude.) and none of these have been accepted as valid here with reasons properly given in-thread for that lack of validity. As you fail to present counter arguments, it suggests you are happy with that lack of validity.This then must constitute what you refer to as being "what you all are saying," so in direct answer to your question @21 I would say that none of it "applies" or is relevant to the "periods of pause in temperature rise shown in the graphs of the history of air temperature change since 1880."
Rather, the GHG effect resulting from atmospheric CO2 levels, which have been increasing over the period in question (1880-to-date), is the driving force behind the rise in temperature over the period. The pauses within the temperature record you ask about have other causes (as decribed @22 & @23).Is there any particular part of the 1880-to-date temperature record that you feel requires more specific consideration?
-
scaddenp at 08:06 AM on 24 July 20192019 SkS Weekly Climate Change & Global Warming News Roundup #27
I would add two things.
1/ The actual surface temperature year to year is strongly affected by internal variation. ie heat sloshing around in a wet, unevenly heated planet. ENSO is the dominant component of this. For this reason, climate is defined as 30 year average. Arguably, Ocean Heat Content is a better metric than surface because most of the heat goes into the ocean and the total energy varies less (the little wobbles are ocean/atmosphere exchange). However, we have only been able to measure this with confidence relatively recently.
2/ Climate changes in response to net forcing. Changes GHGs are only one element (though the dominant one in recent history), but aerosols either man made or from volcanoes are also important (especially mid 20th century, and after really big tropical volcano eruptions). Changes in solar input and albedo are the other important inputs into calculation of forcings.
-
Brentkn at 07:18 AM on 24 July 2019Michaels Misrepresents Nordhaus and Scientific Evidence in General
At what degree does the Arctic lose it's ice during the summer months?
Because I can assure you that once that happens, there will be no stopping Global Warming.
Does it happen at 2°C or less?
Think you can stop the Arctic from melting?
I don't and neither do many US oceanographers.
https://www.theguardian.com/environment/2015/jul/16/warming-of-oceans-due-to-climate-change-is-unstoppable-say-us-scientists
There is a severe flaw in the logic here.
Care to explain it?Moderator Response:[PS] Fixed link. Please learn how to do this yourself with the link button in the comments editor.
-
Rob Honeycutt at 06:59 AM on 24 July 20192019 SkS Weekly Climate Change & Global Warming News Roundup #27
billev... Well, there are lots of reasons for the variations in global temperature. The most dominant one would the El Nino Southern Occilation (ENSO). Most of the accumulated heat is going into the world's oceans, and that heat goes through phases of gaining and releasing that energy into the atmosphere, and that affects the annual global temperature.
-
billev at 06:41 AM on 24 July 20192019 SkS Weekly Climate Change & Global Warming News Roundup #27
And what you all are saying applies how to the periods of pause in temperature rise shown in the graphs of the history of air temperature change since 1880?
-
Daniel Bailey at 02:47 AM on 24 July 2019Climate's changed before
I'll address a portion of that, now that scaddenp and MA Rodger already weighed in on the rest.
"The irrefutable scientific evidence also shows that in all 8 recorded Inter-Glacial Periods, the sea levels rose 3 meters to as much as 14 meters, even when CO2 levels were 260 ppm to 280 ppm CO2."
Again, saying that there is irrefutable evidence pretty much ensures that he's making that claim up. If he had such "irrefutable scientific evidence", he'd have cited it.
Part of the fallacy on display here is the presumption that interglacials are interchangeable and equal. They are not. They are the confluence of orbital factors and the "memory" of the climate over time (climate memory has been demonstrated to extend some 800,000 years or more, depending upon the metric in question). A consilience of studies point out that the best analogue for the modern Holocene Interglacial is MIS (Marine Isotope Stage) 19 (per Giaccio et al 2015, Yin and Berger 2015, Vavrus et al 2018, etc).
Looking at the 5 most recent interglacials, we see that sea levels are not identical (from Grant et al 2014, Figure 2):

From Dutton et al 2015, Figure 1, we see that sea levels from previous interglacials are tightly tied to temperatures...and we know from innumerable studies that global temperatures are tightly intercorrelated with atmospheric carbon dioxide levels:

However, emerging evidence (from Grant 2019) for that Mid-Pliocene sea level on the very right-side of Dutton 15, Figure 1 above is that sea levels associated with an atmospheric composition of carbon dioxide like today saw a contribution of about 20 meters just from the Antarctic Ice Sheet by itself. I believe Rob DeConto is coming out with a similar paper soon on that subject.

Figure 6.10 The Whanganui RSL record on the left with the precession-paced MPWP and obliquity-paced late Pliocene sections highlighted with different GIS, AIS and NHIS configurations and SLE illustrated for interglacial and glacial extreme conditions relative to present-day Antarctica (0 m; central figure). The anti-phased 15 m amplitudes of the MPWP are interpreted as 5 m from GIS offset by ~20 m from AIS present day to peak interglacial. Higher amplitudes would then include larger-than-present AIS (nearing LGM; Clarke and Tarasov, 2014). While the late Pliocene amplitudes include increasing NHIS contributions and smaller interglacial configurations.
To sum for this portion, previous interglacials are as unique as are your fingerprints, but contain similarities constrained by physics, with sea levels of the time correlated with global temperatures and atmospheric carbon dioxide levels.
At present, the human burning of fossil fuels is driving an atmospheric composition and temperature associated with a time when sea levels were over 20 meters higher than at present, imperiling coastal port cities around the world and threatening areas where over 2 billion people currently live.
-
Synapsid at 02:13 AM on 24 July 2019Skeptical Science New Research for Week #29, 2019
Clicking on two links I wanted to read just returned the whole page. Neither opened.
Moderator Response:Thank you for pointing that out, Synapsid. The links should now be working.
-
Daniel Bailey at 01:58 AM on 24 July 2019CO2 is not increasing
Good questions. Looking to the most recent summary at hand, Canada's Changing Climate Report for 2019:
Section 3.4:
"Global temperature change is effectively irreversible on multi-century timescales. This is because the total amount of carbon dioxide emitted over time is the main determinant of global temperature change and because carbon dioxide has a long (century-scale) lifetime in the atmosphere."
And
"In summary, many aspects of climate change are irreversible on multi-century timescales. CO2 persisting for a century or more in the atmosphere is the main determinant of global mean temperature change, and global temperature will remain elevated even after emissions cease. GMST could be reduced only if human intervention could remove CO2 from the atmosphere over a sustained period."
Section 3.5:
"The difference between observed temperature and the multi-model average from roughly 2000 onward has been extensively analyzed (e.g., Fyfe et al., 2016) and is due to a combination of small errors in the observational record, decadal timescale internal variability, and incomplete early 21st century volcanic forcing in the models."
Figure 3.9 shows the persistence of elevated temperatures after emissions cease:

-
Rob Honeycutt at 23:57 PM on 23 July 2019Climate's changed before
Here's a question I've often thought of related to past climate... In periods of a hothouse Earth, like the cretacious, what would the weather have been like? All we ever see are illustrations of dinosaurs in lush tropical landscapes. There would have been a helluva lot more energy in the climate system and so many more extreme weather events.
-
richieb1234 at 23:03 PM on 23 July 2019CO2 is not increasing
Michael SweetNice to hear from you again. Thank you for the references. -
michael sweet at 22:54 PM on 23 July 2019CO2 is not increasing
Ritchieb1234,
Searching at RealClimate using the keywords "temperature change emissions stop" gives several interesting hits. The first three or four are advertisements.
This OP from 2010 seems to describe what you seek. The original letter is here. Follow the citations at Google Scholar to get more recent ideas.
They have covered a lot of material in the old posts at Realclimate. They are probably at a technical level that you would like. Currently they post less because they have already covered so many issues.
-
richieb1234 at 21:14 PM on 23 July 2019CO2 is not increasing
Sorry if this is the wrong comment string. I am having trouble finding quantitative answers to questions related to how temperature increase lags behind CO2 concentrations. Specifically: 1) if CO2 emissions stopped today, what global average temperature would we eventually reach, and 2) how soon would we reach it?Thanks -
MA Rodger at 19:35 PM on 23 July 2019Climate's changed before
TVC15 @760/761,
It is a smorgasbord of denialist assertions you present.
☻ The "Antarctic was warmer 1,000 years ago" assertion looks a little difficult to uphold in any way. There are reconstructions from ice core data (for instance Ciais et al (1994) fig 7) which shows Antarctic temperatures over the last 10,000 years waggling about by a maximum of about a degree centigrade. (Note the Ciais et al graphic is sensibly using an 'average-over-the-last-5,000-years' as a datum.) The thermometer record (eg Berkeley Earth) shows recent warming of a similar amount (although there is a lot of variability in the warming depending where you are in Antarctica) so this evidence suggests it was colder in Antarctica 1,000 years ago. The image below is gleened from a posting on the planet Wattsupia and appears to be based on data from Marcott et al (2013). The 1,000 years ago temperature again is shown as being colder.
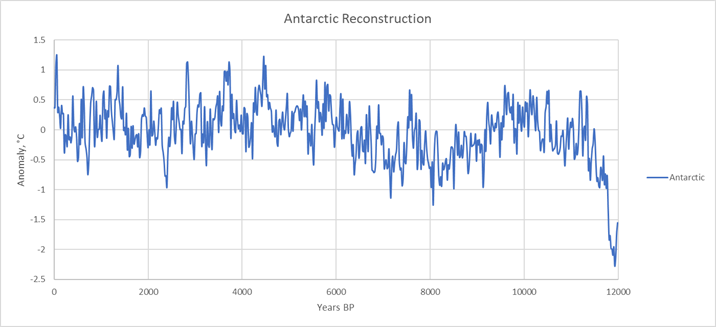
☻ The interglacial sea level has been discussed before, introduced up-thread @715. It was shown that only two of the last 8 interglacials had higher SLR than today, not all eight. The SLR will mainly depend on how much of Greenland & Antarctica melts out, a process that stopped in this present interglacial 8,000 yers ago, and AGW is the process that is doing that melting today.
☻ The "Earth is always warmer and wetter, never warmer and drier" assertion isn't correct. The missing word word is 'atmosphere' which will be, as scaddenp @765 points out, wetter under the CC relationship. So if we have more wet in the atmosphere, will that translate firstly into more rain always falling on the earth beneath. Globally apparently not. This NOAA graphic shows global temperature and global rainfall are not well aligned. (The graph is from here and is for precipitation over global land)
And secondly, as scaddenp @766 describes, even if rain and temperature were inexorably linked, that warmer atmosphere is demanding to be always wetter than it was when cooler and will thus be sucking more moisture right out of that very same land to re-charge its wetness.
-
scaddenp at 13:16 PM on 23 July 2019Climate's changed before
And for science - eg observations and models, try here. The Palmer drought index looks at both precipation and evaporation.
However, I doubt your denier will open any evidence that might contradict what they would like to believe. If someone isnt prepared to let data inform their opinion, then it isnt worth arguing.
-
scaddenp at 13:06 PM on 23 July 2019Climate's changed before
Warmer and wetter is true - CC relation requires it. However, the very broad pattern (with lots of regional exceptions) is that the wet get wetter, dry get dryer. There is no guarantee of more arable land where you want it. Does mean he now accepts global warming? More like "I will believe any nonsense that can justify sitting on our hands". More likely latter and as we said before, you are wasting your time.
Warmer in Antarctica 1000 years ago? Umm, let's see that evidence.
-
TVC15 at 12:31 PM on 23 July 2019Climate's changed before
@ 762; 763 Daniel Bailey
Done!
I look forward to your responses!
Thank you!
-
Daniel Bailey at 11:52 AM on 23 July 2019Climate's changed before
He claims to have irrefutable evidence.
Make him damn well show it.
-
Daniel Bailey at 11:51 AM on 23 July 2019Climate's changed before
I'll have more to say tomorrow, but as a preliminary answer, you're chasing the dog's tail. Stop.
Demand evidence for their claims, including source citations.
Pretty much every single item you quoted is a baldfaced lie or untruth.
Prev 190 191 192 193 194 195 196 197 198 199 200 201 202 203 204 205 Next


