


 Arguments


Recent Comments
Prev 1975 1976 1977 1978 1979 1980 1981 1982 1983 1984 1985 1986 1987 1988 1989 1990 Next
Comments 99101 to 99150:
-
NETDR at 14:33 PM on 20 January 2011Monckton Myth #3: Linear Warming
neutrino I found 4 % difference in the forcing between linear and the quadratic. This is insignificant in my opinion. If you plot the Ln of the CO2 between 1958 and 2010 it looks like a horizontal asymptote but it does increase very slowly. . The difference is you multiply the Ln by 5.35 to get 21.4 % How do you get the 5.35 ? If the effect were multiplied by 5.35 times the Ln Tamino would have mentioned it. He didn't. Tamino computed the Ln of the growth rate in 2010 was .0055 / year. Was he wrong ? Why didn't he compute 5 times as much it would have served his argument better. You may have a reasonable explanation, but various climate sensitivities using unproven positive feedbacks don't pass the sniff test. That gets into another off topic discussion. Which I keep getting hit with and when I respond I get yelled at ! Not exactly an even playing field ? -
MattJ at 14:16 PM on 20 January 2011Infographic on where global warming is going
That is a good question: if less than 2% is causing this much havoc with melting ice at both poles, what will happen when the oceans release the rest of it? Better yet, what is all that heat doing to the oceans? Perhaps we just aren't seeing the damage. We still do not know the deep oceans that well. -
RW1 at 14:12 PM on 20 January 2011The Physical Chemistry of Carbon Dioxide Absorption
MrAce (RE: 110), "I agree that more CO2 below the cloud has little effect, because all the radiation is absorbed by the cloud anyway. But this is exactly my point. More CO2 means less energy escaping to space, so the surface warms up, radiates more and we will reach an equilibrium with a higher temperature. When the surface warms below the clouds, there will not be any increase in radiation to space, because the clouds absorb it all. To reach equilibrium the surface has to warm even more." No, the whole point is the surface doesn't warm by any significant amount below the clouds with more CO2, because by and large the clouds are determining the surface heat flux - not GHGs (not CO2). -
muoncounter at 14:04 PM on 20 January 2011Monckton Myth #3: Linear Warming
#56: "Type II Deniers" asteel, Is there an official taxonomy? -
adelady at 13:46 PM on 20 January 2011Infographic on where global warming is going
I'll second that observation. Of course, a good part of that melt results from warm ocean waters rather than direct heating of the ice - I hope. -
archiesteel at 13:40 PM on 20 January 2011Monckton Myth #3: Linear Warming
@ BP: "Except there's no "planetary energy imbalance" there for the last eight years." Sure there is. Even eyeballing the graph clearly shows there is still warming going on. Hey, at least now I have reference posts to point Type II Deniers when they say "no one really claims there's no warming"... -
citizenschallenge at 13:40 PM on 20 January 2011The Queensland floods
Thanks Tom, I read your posts with much interest, since I was handed Christopher Booker's "What was the role of warmists in the Queensland flood disaster?" ~ The Telegraph 1/19/11 {I visited and liked your website too} You've managed to answer most of my questions regarding Booker's claims. However, I'm curious if you have any comments about the land zoning claim he makes? Are you familiar with the reporter? ~ ~ ~ "For years, Australia’s warmists have been advising the authorities that the danger posed to the country by global warming is not floods but droughts: not too much rain but too little. One result, in Brisbane, was a relaxation of planning rules, to allow building on areas vulnerable to flooding in the past. As long ago as 1999, this was seen as potentially disastrous by an expert Brisbane River Flood Study (which was ignored and for years kept secret). Instead of investing in its flood defenses" peterm -
archiesteel at 13:38 PM on 20 January 2011Monckton Myth #3: Linear Warming
@NETDR: "Plot it and see for yourself. Oh I forgot alarmists never plot anything or think for themselves do they ? " If this doesn't deserve to be moderated into oblivion, I don't know what is. It's bad enough that deniers repeat the same debunked BS over and over again, but now they're actually projecting their own failings onto people who actually understand the science? NETDR, the only people who agree with you are those opposed to AGW for political reasons. You have failed to disprove AGW theory. Just give it up. -
muoncounter at 13:37 PM on 20 January 2011Infographic on where global warming is going
Less than 2% going into ice (Greenland, Arctic, ice caps) gives us the melt rates we've observed??? I'm stunned. -
Marcus at 13:22 PM on 20 January 2011Monckton Myth #3: Linear Warming
@BP. Ah, still repeating the old 2003-2008 furphy are you? I'm sorry, but since when does 5 years of data constitute a statistically significant trend? Whatever issues might exist with pre-2003 data, the 2003-2007 data is based on an incomplete deployment of the ARGO buoys-which could very well make *that* the artifact. Since mid-2007, when all 3,000 buoys were deployed, through to mid-2010 we saw consistent warming. After 6 months of cooling, we're seeing temperatures starting to climb once more. So you see that your claims are *not* QED, & your use of that term highlights a great degree of arrogance on your part! -
muoncounter at 13:22 PM on 20 January 2011Hurricanes aren't linked to global warming
#20: "either not warming at all recently ..." We know that's not true. "... or there's no connection whatsoever between temperature and storminess." No connection whatsoever is a strong phrase in this context. From Jeff Masters: Tomas' formation ties 2010 with 1995 and 1887 for 3rd place for most number of named storms in an Atlantic hurricane season. Only 2005 (28 named storms) and 1933 (21 named storms) were busier. ... The intensification of Shary and Tomas into hurricanes today brings the total number of hurricanes this season to twelve, tying 2010 with 1969 and 1887 for second place for most hurricanes in a season. The record is held by 2005 with fifteen hurricanes ... -- emphasis added The last time this came up, you argued for some sort of ad hoc statistic by summing Safir-Simpson number of US landfalling storms annually. This completely discounts storms that bypass the continental US (which seems arbitrary) and ignores tropical storms (which seems capricious). FYI: See arbitrary and capricious. Here's the graph of named storms prior to the 2010 season: which is complicated, but seems to be vaguely increasing over time, especially since the 1920s.
The conclusion in prior threads was this particular aspect of the science isn't settled. So 'no connection whatsoever' is hardly warranted.
And then there are those nasty Pacific storms... this is about global warming after all.
which is complicated, but seems to be vaguely increasing over time, especially since the 1920s.
The conclusion in prior threads was this particular aspect of the science isn't settled. So 'no connection whatsoever' is hardly warranted.
And then there are those nasty Pacific storms... this is about global warming after all.
-
Marcus at 13:05 PM on 20 January 2011Monckton Myth #1: Cooling oceans
@ Albatross....and what do you know-its been since about 2007-2008 that we've had fairly consistent increases in Sea Surface temperatures. Methinks the 2003-2007 data might well be the "artifact" that BP & KL keep banging on about! -
muoncounter at 12:55 PM on 20 January 2011We're heading into an ice age
#226: You stated you were 'not convinced' by AGW; I recommended, as I often do, that one needs to establish the credibility of one's doubts in a systematic way. That could neither be construed as a personal attack nor a religious discussion in any way whatsoever. But this thread is about whether a new ice age is on the horizon. My comment #225 rejected your suggestion that a 4 BY solar system model has merit in this particular discussion. And the question 'what is an arbitrary effect?' in this context was warranted, as I do not find that particular phrase to have definite meaning in 'obvious English'. The solution to the problem of being misunderstood by others who may read your comments in a different light than you intended is simply to stay on topic, stick to facts and avoid gratuitous opportunities to drop off-the-cuff declarations into your comments whenever possible. -
LandyJim at 12:04 PM on 20 January 2011Hurricanes aren't linked to global warming
Why do you assume I did not read it? If you notice I used the word..assume..under normal circumstances when one puts more energy into a system, you get more energy out of it..I am not stating that either side of this comment is correct..If, and it is a big if, the atmosphere works the same as other systems in nature, then it is a reasonably conclusion to arrive at that by putting more energy into the system, one would expect more energy out, and in the case of tropical storm, one would expect more of them and likely with a higher energy level..but that is not necessarily the case. The only way to find out, or at least get a better handle on it is to go through all the available data that can be accepted as reasonably reliable and then put it into a useful and unbiased format. Then look at all other influences that may either positively or negatively impact any of that information...I am sure that, regardless of air and sea temperatures, there is far more going on to influence a tropical storm into becoming a Hurricane than we realise at this time..Like I said, this part of the discussion intrigues me... -
Jeremy Young at 12:03 PM on 20 January 2011Monckton Myth #1: Cooling oceans
What is peer reviewed literature? it has been held up as some kind of gold standard but as The Journal Geoscience Research demonstrates anyone can set up a peer reviewed journal, and especially easily online. Maybe the IPCC will need to more closely define the concept. -
Berényi Péter at 12:01 PM on 20 January 2011Hurricanes aren't linked to global warming
The Earth is either not warming at all recently or there's no connection whatsoever between temperature and storminess. Global Tropical Cyclone Accumulated Cyclone Energy (ACE) according to Dr. Ryan N. Maue at the Florida State University: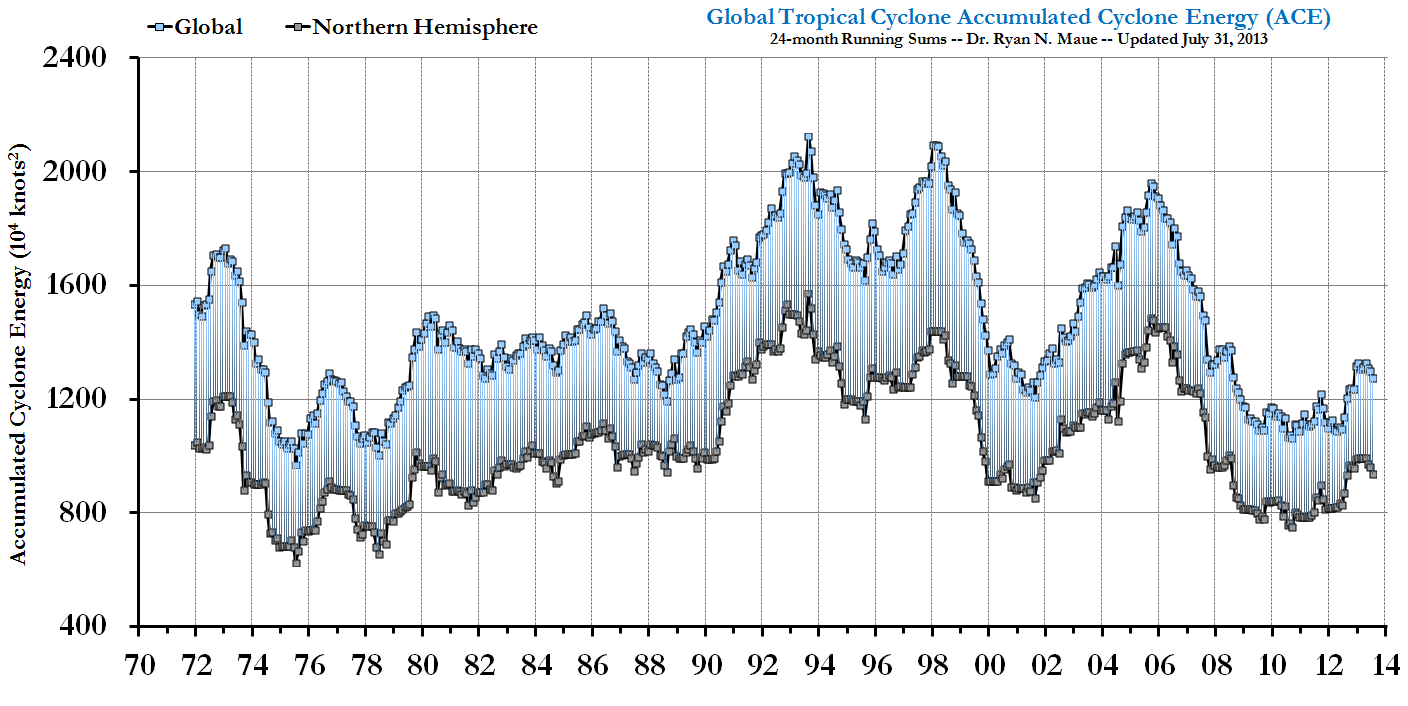 "With 2010 being a globally »hot« year, we saw the fewest number of global tropical cyclones observed since at least 1970."
-
sailrick at 11:49 AM on 20 January 2011Monckton Myth #2: Temperature records, trends and El Nino
Albatross Perhaps I could have worded that better. Basically he was questioning Table 1 above, which shows UAH as not having global coverage. Here's the article at Grist where the debate is ongoing. http://www.grist.org/article/2011-01-14-climate-change-helped-end-the-roman-empire-says-study Feel free to join in. Skeptical Science is being attacked here, after I referenced it in my arguments, if you need any inspiration. -
LandyJim at 11:30 AM on 20 January 2011Hurricanes aren't linked to global warming
I'm intrigued by the Hurricane story. If the atmosphere is getting warmer then one would expect tropical storms to increase in both frequency and intensity as there would be more energy in the system to power them, therefore one would expect more to become Hurricane force too, so overall average numbers should go up along with their average power. I have decided to do my own research on this, and it hasn't been easy finding reasonably reliable data that goes back a decent amount of time. As it is I have found archive data from ships reports and later monitoring reports of Hurricanes from 1851 to 2010, this later data, from 1995 does indeed see a marked increase in both tropical storms, hurricanes and their relative energy, based on wind speeds, I appreciate that until the more modern era wind speed assumptions for such events have a degree of error in them..afterall people on a ship were a little busy to be doing too much science! I'll be honest, I did not see any real rise or fall in the figures until I got to the 1990's, then both the number of events and the average wind speed has increased. I will plot this information into graphs and publish it for everyone to look at..but it will take a little while..I will also try to get some information, accurate, on how wind speeds were reported, if there has been a change to which tropical storms are recorded, such as a lowering of the minimum speed for recording purposes as this will allow a better understanding of the increase from 1995 on. If there has been no recording change, then the number has most definitely increased, as has the power of the events...and this would certainly imply that there is more energy in the system to power these storm, and that certainly indicates a rise in temperature over this period. I will try to get it online in the next few days..as this intrigues me..Moderator Response: Read the original post carefully. Notice that not all researchers agree with you that "one would expect tropical storms to increase in both frequency and intensity as there would be more energy in the system to power them." It's more complicated than that. -
Berényi Péter at 11:29 AM on 20 January 2011Monckton Myth #3: Linear Warming
"we are not currently at equilibrium as there is a planetary energy imbalance, and thus further warming 'in the pipeline' from the carbon we've already emitted" Except there's no "planetary energy imbalance" there for the last eight years. There's a huge upward shift in OHC data before 2003, however, en masse ARGO float deployment only began in that very year, therefore OHC was not measured properly before 2003.
Net TOA (Top of Atmosphere) radiative imbalance is also measured by satellites. Accuracy of that measurement is extremely poor, but its precision is much better. That is, there's an unknown additive constant for the entire measurement period, but otherwise measurement of relative changes is pretty reliable.
Now, OHC is proportional to the temporal integral of TOA imbalance. This latter quantity, as all climate indicators, fluctuates, but if its long term average is above zero, the integral should have an upward trend with a steady slope. Unfortunately, as I have said, satellite data tell us nothing about the sign (if any) of the imbalance.
But they do tell us there was no downward shift in average imbalance at TOA around 2002-2003. That is, the increase in OHC data at that time is an artifact indeed.
If there's no planetary energy imbalance, the pipeline is empty. If it is empty, we already had the bulk of warming that may come from the slight increase in atmospheric opacity in the 14-16 μm CO2 thermal IR band due to past emissions. If climate response is that fast, equilibrium sensitivity is low. Q.E.D.
There's a huge upward shift in OHC data before 2003, however, en masse ARGO float deployment only began in that very year, therefore OHC was not measured properly before 2003.
Net TOA (Top of Atmosphere) radiative imbalance is also measured by satellites. Accuracy of that measurement is extremely poor, but its precision is much better. That is, there's an unknown additive constant for the entire measurement period, but otherwise measurement of relative changes is pretty reliable.
Now, OHC is proportional to the temporal integral of TOA imbalance. This latter quantity, as all climate indicators, fluctuates, but if its long term average is above zero, the integral should have an upward trend with a steady slope. Unfortunately, as I have said, satellite data tell us nothing about the sign (if any) of the imbalance.
But they do tell us there was no downward shift in average imbalance at TOA around 2002-2003. That is, the increase in OHC data at that time is an artifact indeed.
If there's no planetary energy imbalance, the pipeline is empty. If it is empty, we already had the bulk of warming that may come from the slight increase in atmospheric opacity in the 14-16 μm CO2 thermal IR band due to past emissions. If climate response is that fast, equilibrium sensitivity is low. Q.E.D.
-
Marcus at 11:21 AM on 20 January 2011Monckton Myth #3: Linear Warming
Here are the key points, as I see them-of the 100ppm rise in CO2 since pre-industrial times, about *half* has been within the last 30 years. Of that 50ppm, around 20ppm has been within the *last decade alone*! So that alone debunks the whole "Linear Growth in CO2" argument. The 2nd point is that, of the roughly +0.7 degrees of warming we've seen in the past 60 years, around +0.5 degrees has been in the last 30 years alone-that, in spite of the fact that the last 30 years has seen an overall downward trend in total solar irradiance (on the order of -0.02W/sq. meter/year). So, even *if* CO2 emissions don't grow at a faster rate, & even *if* solar irradiance levels off or continues to fall, we're still looking at a lot of warming over the next 30 years. Yet everything suggests that-if we continue the BAU approach-CO2 levels will rise much faster over the next 30 years than they did in the previous 30 years! -
MarkR at 11:19 AM on 20 January 2011Monckton Myth #4: Climate Sensitivity
Albatross: you can determine equilibrium climate sensitivity from the feedback parameter Lindzen and Choi calculate (by combining it with the other known feedback parameters, water vapour/lapse rate/albedo). L&C09 suggest the equilibrium value is low. Their method ignores much of the planet and their choice of dates seems to have no objective justification and their results are very sensitive to this: i.e. it's not rigorous. It's almost certainly wrong. Plus they got their calculations wrong and had to boost their answer by 60% or something anyway. (although, if they are right it's still not a problem, but I'm pretty confident they've been shown to be thoroughly wrong) -
MarkR at 11:17 AM on 20 January 2011Monckton Myth #3: Linear Warming
NETDR, you can tell CO2 is increasing FASTER THAN EXPONENTIAL very easily. Plot ln(CO2) vs year. Then take the residuals. If the differential of the residuals is positive, then the acceleration is FASTER THAN EXPONENTIAL, if it is zero then it is exponential, and if it is negative then it is slower than exponential. The residuals show it is faster than exponential. Even if it were only exponential, then radiative forcing would increase linearly. That isn't the same as temperatures increasing linearly unless the Earth reaches equilibrium in each year. Which it doesn't.Moderator Response: Please don't use all caps. Use italics or, if necessary, bold. -
Ken Lambert at 11:14 AM on 20 January 2011OK global warming, this time it's personal!
johnd #28 Excellent chart - is there an electronic copy available? -
MrAce at 10:52 AM on 20 January 2011The Physical Chemistry of Carbon Dioxide Absorption
RW1 (RE: 103), I agree that more CO2 below the cloud has little effect, because all the radiation is absorbed by the cloud anyway. But this is exactly my point. More CO2 means less energy escaping to space, so the surface warms up, radiates more and we will reach an equilibrium with a higher temperature. When the surface warms below the clouds, there will not be any increase in radiation to space, because the clouds absorb it all. To reach equilibrium the surface has to warm even more. This is off course only the case when the clouds do not warm up significantly. What does happen when the clouds tend to warm? Do they evaporate? Rise and cool again? -
Neutrino at 09:44 AM on 20 January 2011Monckton Myth #3: Linear Warming
I can't seem to follow your math here NETDR, You seem to be saying that going from a linear(y = 1.43127x + 313.26) to a quadratic(y = 0.0122x^2 + 0.8138x + 311.64) only marginally changes the outcome. Yet if I run the numbers on the two i get significantly different results. Today CO2 (from mlo) is 389.78ppm, in 2100(90 years from now) your linear projects it to be 516.50ppm and your quadratic projects 673.20ppm, a 30% difference! Now the radiative forcing(as I understand it) is proportional to the ln of the change in the CO2(ie ∆F = 5.35*ln(C/Co)). If we take today as the baseline and look 90 years into the future there is a significant difference between the two. For your linear: ∆F = 5.35*ln(516.50/389.78) = 1.51 For your quadratic: ∆F = 5.35*ln(673.20/389.78) = 2.92 So If CO2 is raising at your quadratic rather than your linear then we should expect to see almost double the temperature rise over the next 90 years. To say that is a trivial difference just seems plain wrong to me. -
archiesteel at 09:23 AM on 20 January 2011We're heading into an ice age
@LandyJim: muoncounters didn't make any personal attacks towards you. Please have the courage to defend your opinions without whining when someone challenges them! As the effect of Milankovitch cycles on cliamte are well-understood, you're going to need to provide some evidence to support your extraordinary claims that the varying insolation caused by the various wobbles doesn't in fact significantly affect the climate. In other words, if you're going to challenge current science, you better not all hat and no horse. -
Eric (skeptic) at 09:22 AM on 20 January 2011Hurricanes aren't linked to global warming
Chris, here's my suggestion FWIW. Preparation for storms is essential regardless of averages and predictions. Alt energy will work well with a smart grid. Arguing about whether "CAGW" is a religion doesn't advance science and most of his examples are red herrings, the science is not capricious or extreme. The article at the top of this thread is a good example of that. -
LandyJim at 08:57 AM on 20 January 2011We're heading into an ice age
@ Response: Yes I did, your correct. The Milankovic cycle is a real phenomena, however I do not accept the assertions of many that it is a dominant factor is our planet's climate. I do not need to make my mind up as I know exactly what I mean. I actually agree with many climate scientists on this important point, but feel that they have failed to publicly really kill this point, that's why some people keep bringing it up. @Muoncounter. I am not impressed with your personal attack, you are a moderator here and I would have expected better from you. My comments are clear and in obvious English. For your information, my comment about an "arbitrary effect" is one that on it's own has little overall impact... Regarding reading all the threads on here, do you think I have lived in a cocoon for 44 years? Your making an assessment of me based on something that, forgive this comment..rather arbitrary :) I subscribe to several Science Journals, and stay up to date, at least with Astronomy/Space related research, but I have interests in Nuclear and particle physics too. I am slowly working through SkS.I think you will agree it's not a 5 minute job to read all the posts in every thread...and I do have to go to work to! You see your assuming that I am in a state of denial, your making this a religious discussion in effect. I used the words "Not Convinced", that means I have an open mind and am open to being convinced, but having a science background means I require more evidence as I personally feel that the argument is not there, there is compelling evidence, I am not against reducing CO² or any other gas or poison being put into the environment, but the arguments have not proved their case for me personally, but I accept that the arguments posed against it are generally lacking in detail and quality...so I am on the fence. The anti AGW camp actually drive me as mad as the ardent Pro camp does. That is not the same as Denial. However clearly you have an issue with my ability to think for myself...so you might like to know I own and Drive Land Rovers...:) Now please, lets not allow this to get personal, we are all above that and mature adults, if the arguments are weighted correctly, match up with the science, then they will carry the day...whichever side ultimately proves to be correct...Moderator Response: [Daniel Bailey] Please stay on the topic of the post. Thanks! -
muoncounter at 08:51 AM on 20 January 2011Monckton Myth #3: Linear Warming
#48: "I forgot alarmists never plot anything" As you clearly missed it, the graph is in #46. As you clearly don't understand it, those blue deltaT curves are temperatures calculated from forcing functions based on natural log CO2 as a function of time. Since you clearly still don't understand what that means, here's an easy-to-read wiki link. The relevant lines begin with Delta TS = and Delta F = . The big triangle is 'Delta'. And since you clearly don't see the importance of any of this, those red dots are actual temperature anomalies (shifted to 0 in 1880). Sure looks like the red stuff is coming up between two of the blues, matching the rate of change pretty well. That's what's called a match of observation to model -- and it's a sign that the model is pretty good. Thank you for demonstrating so admirably the total failure of this denialist argument and the total abandonment of reality that is needed to cling to it. But I do agree with you, this discussion is over. -
Bibliovermis at 08:09 AM on 20 January 2011The 2010 Climate B.S.* of the Year Award
The problem occurs when people join this discussion who truly have nothing to contribute besides strawmen, red herrings, and "nuh uh, I don't believe that" when their claims are addressed. Maintaining a civil discussion is essential for a productive end; however, patience (mine, at least) is a finite resource. -
Chris3699 at 08:08 AM on 20 January 2011Hurricanes aren't linked to global warming
Recently I was talking to a skeptic I know in the USA (the same one I've mentioned here on other threads)and I was telling him about how the massive floods we're having in Australia are linked to climate change and this was his response: "In another time your Green MP upon seeing an eclipse of the sun would have jumped upon a soap box and proclaimed, “Give me your money now or I shall blot out the sun again!” You can see how far we’ve come, today’s MP upon seeing a flood, says in effect, “give me power or there will be no one to protect you from the evil forces of greedy industrialists!” Ah, progress! You should take heart though, after hurricane Katrina hit the U.S. Greens were coming out of the woodwork predicting a new era of increased severe hurricane activity caused by global warming. Not only has there not been another severe hurricane to hit the U.S. but all hurricane activity has dropped off precipitously. Of course the way is now clear for Greens to point out the “fact” that the unnatural drop-off in hurricane activity is an example of rampant global warming! Four years ago, the area of California around L.A. was experiencing a drought. Greens were quick to point out that global warming was turning California into a desert and that California should brace itself for perpetual drought. Yes … currently, the rains in California have been so drastic that mudslides are what threaten humanity, not lack of water. Still Californians, who must be the holy grail for con-men the world over, rushed to pass laws aimed at curbing emission standards, ransacking their homes for anything of value to throw on the pile of wealth in hopes that the wizard will be pleased and the sun will not be blotted out again. And it goes without saying that the Greens have pointed out that the above average rainfall of the last two years in California is an example of the kind of “Global chaos” that we should come to expect from increased Co2 emisions. Mankind is responsible for about .28% of all of the greenhouse gases in the atmosphere. If the entire U.S. stopped producing Co2 gas completely tomorrow the effect could not be measured yet here we have a Green in Aus passionate that Melbourne reduce its Co2 emissions so that floods will be prevented. The fact that people are still threatening to blot out the sun unless they are paid off isn’t what’s surprising, the surprising thing, and the very sad thing, is that people are still lining up to give away their wealth and freedom to the latest Hucksters." What do you guys make of that? -
NETDR at 08:07 AM on 20 January 2011Monckton Myth #3: Linear Warming
mouncounbter So from 1958 to 2010 [52] years the increase in CO2 has gone from 1 PPM per year to 2 PPM per year. Big deal. In the next 50 years if it goes from 2 PPM per year to 4 PPM per year that is a very small amount. The flattening effect of the LN function is very strong. A straight line increase rolls over to look like a horizontal asymptote as each molecule does less and less warming. The CO2 curve even with the minuscule rate increase is essentially a straight line [linear] function. Plot the values for the 52 year and see it is almost a horizontal asymptote. Plot it and see for yourself. Oh I forgot alarmists never plot anything or think for themselves do they ? Computing the 90 year effect of CO2 using a linear function results in a tiny error. Since the effect is logarithmic the real effect change between 1958 and 2010 was actually [Including the slight increase in rate] Ln(CO2-2010) – Ln (CO2-1958)/Ln(CO2-1958) = 4 % change in 52 years. Big deal ! Admit it this discussion is over and you lost.Moderator Response: The original post is about Monckton's claim of linear warming. muoncounter showed you (again) the nonlinear warming caused by nonlinear increases in CO2. You keep saying the extra (more than linear) increases are not a problem, without addressing the actual problem of more than linear increases in warming. The difference of even "just" one more degree of warming on top of the linear warming is quite important in consequences. If you want to argue that is not important, type "It's not bad" in the Search field at the top left of the page. -
heystoopid at 07:51 AM on 20 January 2011Zvon.org guide to Skeptic Arguments at Skeptical Science
Thank you very much, for your time and effort. Some has done a lot of research to assemble such a large lines of coherent information in one place, in order to counter the bad incoherent science "WUWT" award winners slim cherry pickings, lousy context and all too numerous bloopers along with paid political science 101 misinformation. -
dana1981 at 07:45 AM on 20 January 2011Monckton Myth #3: Linear Warming
I'm not going to argue with NETDR anymore, except to point out that his claim that ocean heat content is no longer building is false and was refuted in Monckton Myth #1. He's wrong, as will be obvious to anyone reading this comment thread. But he's clearly not willing or able to realize that he's wrong, so arguing with him further is a waste of time. -
Ron Crouch at 07:34 AM on 20 January 2011Monckton Myth #4: Climate Sensitivity
At least Monckton is true blue by drawing upon the likes of Lindzen. I think Wally Broecker put it best when it comes to climate sensitivity. 'The Climate System Is an Angry Beast, and We Are Poking at It with Sticks' The one question we all want to know. Just how far can we push the planet before abrupt climate change takes place? -
muoncounter at 07:08 AM on 20 January 2011Monckton Myth #3: Linear Warming
#41: "As I showed above the rate is just a little faster than linear." Stunning. The annual rate of change at MLO is given here; for the past 5 years its been between 1.7 and 2.3 ppm/year. From 1970-1974 (also 5 years) it averaged 1.1 ppm/year. That means the rate of increase has nearly doubled in less than 40 years. This 'accelerating' or concave up behavior for CO2 as a function of time is critical, as it overwhelms the slightly concave down behavior of the log function. What you calculate when you take log CO2 is the forcing. Increasing forcing results in increasing rates of temperature change, as shown by Dikran Marsupial. Here's what you get with increasing forcing: --- from comment here.
Those temperature anomaly curves increase in slope regardless of the sensitivity used (those shown are 0.6, 1.7 and 3 degrees C per doubling of CO2). So your attempt to minimize the impact of increasing atmospheric CO2 is utterly incorrect; as jhudsy says, the gloomy predictions are indeed fully justified.
--- from comment here.
Those temperature anomaly curves increase in slope regardless of the sensitivity used (those shown are 0.6, 1.7 and 3 degrees C per doubling of CO2). So your attempt to minimize the impact of increasing atmospheric CO2 is utterly incorrect; as jhudsy says, the gloomy predictions are indeed fully justified.
-
Albatross at 07:06 AM on 20 January 2011Monckton Myth #3: Linear Warming
NETDR @44, So rather than admitting you are wrong, the goal posts get shifted and a number of red herrings get trotted out. Sorry, that is not good enough, and to me suggests that you are not here to debate the science in good faith. Also, it seems that you are trying to squeeze in as much misinformation as you can in one post. Peak oil is not the primary concern, coal is-- we still have mountains of the stuff to mine and burn. "The warming in the pipeline argument is probably not true since the heat which is supposedly building up in the ocean isn't building up at all." Again, you need to back this up with some actual facts (and not some half-baked paper published in a dodgy journal by Knox and Douglass). For now, you have simply made an unsubstantiated assertion. "See the "missing heat" argument which Trenberth seems to be losing." Trenberth has not "lost" the heat. Just because one cannot find something because of incomplete data sampling, doesn't mean that it is not there. Maybe it is time to resurrect "DSCOVR (Deep Space Climate Observatory) that George Bush Jnr. scrapped. "Even if the missing heat is hiding at the bottom of the ocean it isn't going to do much warming until it comes to the surface is it?" Well, actually that may already be happening (see here), and it will most certainly be something for future generations to worry about. -
Albatross at 06:48 AM on 20 January 2011Monckton Myth #2: Temperature records, trends and El Nino
Sailrick @18, Weird, I thought UAH data was the darling product of the "skeptics". Could it be that they are now turning on UAH because it is no longer showing them what they wish to see? Someone recently corrected me on this, but the UAH data is apparently the only true global product out there. The RSS data are truncated near the poles because of issues issues with reliably retrieving the temperature data from the MSU data, so they choose to avoid those areas. The persons 'defense' is irrelevant, because non of the surface products are truly global. Yet, encouragingly (and unfortunate for the person you are debating), there is remarkable agreement between the reanalysis data ( model output data highly constrained by observations), satellite data and various surface temperature records (e.g., NDCD, NOAA, JMA, NASA). In the UAH data 1998 and 2010 are in a statistical tie for warmest year. That said, rankings, while interesting, do not tell the whole story. What counts is the long-term trend, and on that front there is excellent agreement between the products that the warming the last 30 years or so is the greatest rate of warming since circa 1850. -
NETDR at 06:45 AM on 20 January 2011Monckton Myth #3: Linear Warming
Dana The key word is eventually. The rate of CO2 buildup even including the acceleration is quite small. Some people think we have passed "peak oil" and we will have to convert to alternative fuels in the next 50 years. Their prices will come down and the conversion will be relatively painless. The warming in the pipeline argument is probably not true since the heat which is supposedly building up in the ocean isn't building up at all. See the "missing heat" argument which Trenberth seems to be losing. Even if the missing heat is hiding at the bottom of the ocean it isn't going to do much warming until it comes to the surface is it ? -
muoncounter at 06:32 AM on 20 January 2011We're heading into an ice age
#224: "models our planet's motion in space over the last 4 billion years ... " A complete and utter red herring strawman. There is more than enough understanding of the current orbital dynamic to fully describe the orbit's control over solar insolation. There is more than enough measurement of insolation to fully describe its input to earth climate. "... to see whether, at any time, the disparate cycles have ever coincided enough to have anything more than an arbitrary effect." What does that even mean? What is an 'arbitrary effect'? "I am not convinced by AGW" Let's try to establish credibility rather than make declarations. Have you read each of the SkS threads relevant to whatever aspects of AGW you disagree with? Have you weighed the arguments of actual scientific research against 'I am not convinced'? What specifically do you disagree with? Can you mount credible cases against the points made in the relevant SkS threads to qualify as scientific arguments? Those who arrive at SkS already in a confirmed state of denial usually wind up with little more to do than pose red herrings and make blanket 'no its not' statements. Nobody said understanding AGW was easy; being a competent skeptic certainly isn't easy either. -
sailrick at 06:07 AM on 20 January 2011Monckton Myth #2: Temperature records, trends and El Nino
In a discussion at Grist with a skeptic, I referred to this article and Table 1 in particular, saying that 1998 was only the warmest year, in data sets that were not global, or which didn't include 2010. His reply questioned UAH not having global coverage. Is there an error here, or is he wrong. Thanks -
Albatross at 05:40 AM on 20 January 2011Monckton Myth #1: Cooling oceans
KL, All the literature critiqued in my 'random postings' is peer reviewed.Think of me as a particularly hard marker First, do not flatter yourself. Second, a perusal of said threads shows that you and BP are by no stretch of the imagination experts on OHC. Third, publish a paper in a leading peer-reviewed journal on OHC and then you can crow about having had something "peer-reviewed". The fact is both the ARGO and XBT data have issues. But do not presume that the researchers and experts in the field are not aware of this and that they are not working incredibly hard to address the issues. And another error in Monckton's statement is that there were not 3000 active ARGO floats in 2003. As BP has noted, by the end of 2003 there were about 1000 active floats, the "magic" 3000 number was not achieved until sometime in 2007. -
Eric (skeptic) at 05:23 AM on 20 January 2011OK global warming, this time it's personal!
Camburn, I think a critique of climate models should go here: climate-models-intermediate.htmModerator Response: Absolutely. Thank you for helping wrangle! -
Dikran Marsupial at 05:15 AM on 20 January 2011Monckton Myth #3: Linear Warming
NETDR@41 "As I showed above the rate is just a little faster than linear. In 90 years it is just a few percent and the (Ln) effect is even less. " Which is entirely irrelevant. It is the slope of log(CO2) that is the immediate problem, not the curvature. log(co2) being linear means that the eventual equilibrium temperature of the planet is also rising linearly, at a rate determined by climate sensitivity (hence the three degrees per doubling of CO2). A linear log(CO2) is bad enough, worrying about a slight acceleration over linear is just rearranging the deck chairs on the titanic. -
Albatross at 05:11 AM on 20 January 2011Monckton Myth #4: Climate Sensitivity
KL, Have you volunteered to be the peanut gallery on this thread, or are you actually going to try and contribute something of substance concerning Equilibrium Climate Sensitivity (EQS)? EQS is an important issue in climate science, and an issue that Monckton got horribly wrong (and I would argue not by chance either) by electing to believe Lindzen's extremely low estimate of transient climate sensitivity (which is not the same as EQS, it is lower than EQS). Given the importance of EQS, I do not think it is something for you to be glib about. -
Albatross at 05:01 AM on 20 January 2011Monckton Myth #4: Climate Sensitivity
Rob @13, "As such, since the responses to LC09 have been so strong the journal is unlikely to publish LC10." That would be very telling Rob. Also, when Andy Dessler decimated Lindzen last year, Lindzen was whining about having fixed L&C09. IIRC, that debate was held on 11 October 2010-- yet still nothing has appeared in GRL, or will be anytime soon according to their list of papers in press. It would be nice to know what is going here. Did the journal reject his "correction", or is Lindzen still stubbornly trying to convince the reviewers and editor that he has a case? -
jhudsy at 04:15 AM on 20 January 2011Monckton Myth #3: Linear Warming
NETDR @41 The CO2 analysis Tamino and I did doesn't support the supposed rapid increase in the rate of CO2 emission which gloomy predictions are based. Take a look at the graph in the original article. Most "gloomy predictions" are based (in the worst case) on the A1FT emission scenario. It's obvious (again, just by eyeballing that graph) that CO2 emissions are growing even faster than that. Therefore, the "gloomy predictions" are (unfortunately) more than justified. Or am I missing something? -
Camburn at 04:06 AM on 20 January 2011OK global warming, this time it's personal!
Ken@31: I agree. There are many holes in the AGW theory. One of the main things that a lot of people tend to forget is that GCM's are not ready for prime time, but are useful as a tool to eventually show more of what we don't know about climate. -
dana1981 at 03:57 AM on 20 January 2011Monckton Myth #4: Climate Sensitivity
KL #5 and skywatcher #7 - Monckton actually did get one point right in his response to Stekelee - his #8. It's a minor point about how much atmospheric CO2 has increased over the past few years. He also made some correct (and some incorrect) statements in his point #23, but his correct statements were based on a strawman. Since the point of this series is to correct Monckton's Myths, and point #8 is trivial, we'll probably skip that one. When I do point #23, I'll point out Monckton's correct statements. As a few other commenters have noted, the fact that Monckton makes such an incredibly high percentage of mistakes should perhaps make people question relying on him as an accurate source of climate-related information. funglestrumpet #8 - Lindzen has admitted that LC09 contains a number of errors. He has also claimed that addressing these errors doesn't change the results, which frankly is simply untrue. I don't think his correction of the errors has been published yet, as Rob #13 notes. -
Phila at 03:57 AM on 20 January 2011Monckton Myth #4: Climate Sensitivity
Arkadiusz Semczyszak #11: Feedback - response to a doubling of CO2 - but this is still subject to great debate. For those who can't be bothered to click yet another of Arkadiusz Semczyszak's bizarre links, let the record show that his first link goes to a science blogger's account of Jeffrey Kiehl's recent Science paper. The second link goes to Marc Morano's interpretation of an anonymous blogger's interpretation of Lubos Motl's interpretation of Lewis Page's interpretation of Lahouari Bounoua et al (2010). (Page's approach is deconstructed at length here.) "Subject to great debate," indeed.
Prev 1975 1976 1977 1978 1979 1980 1981 1982 1983 1984 1985 1986 1987 1988 1989 1990 Next


