


 Arguments


Recent Comments
Prev 1986 1987 1988 1989 1990 1991 1992 1993 1994 1995 1996 1997 1998 1999 2000 2001 Next
Comments 99651 to 99700:
-
archiesteel at 02:42 AM on 15 January 2011The Physical Chemistry of Carbon Dioxide Absorption
@hfranzen: don't be discouraged by the onslaught of contrarians trying to cast doubt on your paper. The fact that they are so relentless in their critics (all without evidence) probably means you did a good job. I would recommend against trying to convince people like RW1 and co2isnotevil, though. I don't think *any* amount of evidence would convince them, as they have already decided they were right, and everybody else was wrong. They are not interested in a rational debate, but rather in pushing their beliefs. I guess it depends on how much time you have to waste on such fruitless pursuits... -
archiesteel at 02:36 AM on 15 January 2011The Physical Chemistry of Carbon Dioxide Absorption
@RW1: "The IPCC says a doubling of CO2 results in an intrinsic increase in surface power of 3.7 W/m^2. I've said before on here that if only half of the absorbed power affects the surface, the actual is only 1.85 W/m^2." You have failed to provide evidence that supports this assertion, even though you keep repeating it thread after thread. The simple fact is that the 3.7 W/m² figure is already halved. This represent the net forcing of 2xCO2. The burden of proof is on you to provide clear evidence it isn't. -
archiesteel at 02:33 AM on 15 January 2011What is the Potential of Wind Power?
@TerryG is probably referring to the study by CEPOS that concluded Danes pay the highest price for electricity in the European Union. Of course, what TerryG may not know is that the CEPOS is a conservative think tank and that the study was commissioned by the Institute for Energy Research, a Houston-based organization which the Los Angeles Times described as "a Washington-based hotbed of global warming denial supported by oil and coal interests." Never mind the fact that wind power has been a tremendous success in Danemark... -
OPatrick at 02:13 AM on 15 January 2011What is the Potential of Wind Power?
Thanks scatter. Everything I hear about high-altitude wind systems seems so positive - I've always assumed there's some flaw to make it unworkable on any sort of commercial scale, but haven't come across one yet. Possibly interference with flight paths, but it's obvious who should win that battle! As these systems use so little land area I wonder if there would be potential to site them with large solar arrays to reduce infrastructure requirements. They also just look fun - maybe that's why everyone involved always seems so enthusiastic. -
Paul D at 02:05 AM on 15 January 2011What is the Potential of Wind Power?
Terry said: "Ask the Danish what happens when you rely on wind power." They work on the basis of system design that reaches across borders. Norway and Sweden have a large hydro capacity that can be easily regulated, so Denmark exports electricity when they have 'to much wind' and Norway/Sweden switch off the taps. The reverse is true when the wind is down. As I stated in my previous comment, part of the investment in Europe is a supergrid/interconnectors. Of all the technology and systems required, interconnections between nations is well established. Some see this as being negative, because they visualise nations as needing to be independent and self contained entities?? Yet as far as other issues are concerned trade is fundamental and accepted, including trade of fuels. But for some reason trade in electrons in wires, doesn't register as being appropriate. -
JMurphy at 02:03 AM on 15 January 2011Northern hemisphere warming rates: More than you may have heard
With regard to the UK figure for December, it is worth reading what the Met Office has to say : Provisional figures from the Met Office issued today reveal that December 2010 has become the coldest December across the UK since the national series began in 1910. The previous coldest December in the series was 0.1 °C, in 1981. The provisional UK, England and Wales figures for December 2010 show that the month was the coldest month since February 1986. In Scotland it was the coldest month since February 1947, and in Northern Ireland the coldest month on record. More here. It was abnormally cold weather for about a month but since then it has been very mild and approaching April temperatures. -
tobyjoyce at 01:49 AM on 15 January 2011Northern hemisphere warming rates: More than you may have heard
@Arkadiusz Semczyszak Marcus has alrady responded to you, but just let me iterate: Here in Ireland we had record December snowfalls, & record low temperatures. January has been distinctly average -in fact where I live the outside temperature is 10C, and I can see grass growing already between the bricks inside my front gate! Much the same seems to be true for the UK & France. December saw a shift in the jet stream that brought Arctic air over Europe. This will no doubt be looked upon as a cold winter, but a "record"? Doubt it. If it was, why would that be significant? You should think about Marcus' comment about single weather events. -
Arkadiusz Semczyszak at 01:47 AM on 15 January 2011Northern hemisphere warming rates: More than you may have heard
@Marcus That perhaps we are at the beginning of a new trend. Perhaps the exceptionally severe winter is not only a "single weather - hot summers and a signal continentalization climate - cool. As a rule, such a unique individual events are an indicator of the coming changes.Moderator Response: [Daniel Bailey] As others have pointed out already, you are speaking about weather. Climate change is about long-term variations. What may for some has been a severe winter thus far, for others has been exceptionally mild (with several months of variation yet to go). Highliting this current winter's "weather":
-
Yvan Dutil at 01:47 AM on 15 January 2011Northern hemisphere warming rates: More than you may have heard
In my mind this picture make the whole statement about the uneven temperature variation very clear. Moderator Response: [Daniel Bailey] Nice chart, one of my fav's. Superbly illustrates polar amplification like no other. Thanks for sharing!
 -
JMurphy at 01:40 AM on 15 January 2011Northern hemisphere warming rates: More than you may have heard
I always thought that Winter started on 21 Dec and finished on 20 Mar. Or that it is the months of Dec, Jan and Feb. How can anyone be calling this the "coldest since 327 years" when we are only about half through the current Winter ? Also, what exactly was the temperature in 1683 ? -
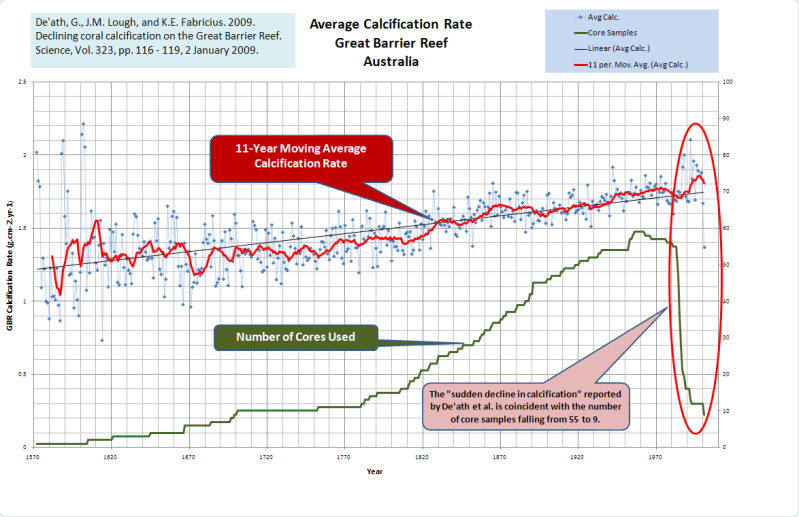
Arkadiusz Semczyszak at 01:40 AM on 15 January 2011Coral: life's a bleach... and then you die
According to data from paper Declining Coral Calcification on the Great Barrier Reef, De’ath, Lough and Fabricius, 2009., GBR calcification decline looks like this. -
Marcus at 01:39 AM on 15 January 2011What is the Potential of Wind Power?
Grim_Reaper, your claims are just the repetition of propaganda from those who are desperate to keep renewable energy out of the game. Photo-voltaic cells, for example, have increased in efficiency from less than 6% to more than 20% in the space of only 20 years-whilst the price per watt has dropped from $25 to less than $5 in a similar time frame-all on a *fraction* of the money received from coal & nuclear power. Battery storage, thermal storage, pumped storage, redox cell storage & compressed air storage are all viable *right now*. Biomass energy-particularly from land-fill & sewage gas is equally available *right now*. Tidal Power, Run of River & Tidal Stream Power are also available right now-as is Geothermal. Though new, Osmotic Power is also looking extremely promising, as is hydrogen. Even without any major breakthroughs, a variety of renewable energy resources-combined with demand management-could easily meet the vast majority of the energy needs of most Nations. All that is lacking is the will to stand up to the vested interests who currently hold our energy & fuel distribution networks to ransom! -
Ken Lambert at 01:39 AM on 15 January 2011The Queensland floods
Tom Curtis #50 You are correct in the difference between flood levels at the Port Office and the City Gauge. The Port Office level should be reduced about 1.4m to equate to the City Gauge. 1974 would have been about 0.5m higher that 2011 and 1893 over 3m higher than 2011 at the City Gauge. Every event has different characteristics, and the effect of the 'shock absorber' dams is generally one of mitigation. However, the strongest La Nina (probably on record) in Australia has produced a very wet year for most of the north and east except for the south west corner of WA. This is a similar pattern to 1974. Floods in Dalby and the shocking Lockyer Valley 'tsunami' also must take into account intensive agriculture of these areas which has a large effect on runoff behaviour. Rainfall in the Brisbane catchment heavily since September has been absorbed by Somerset and Wivenhoe; so the shock absorber was up near its stops. Half the water flow of the 2011 flood in Brisbane was from Wivenhoe, and the other half from below. A difficult decision had to be made to release water or exceed the dam's extreme capacity. Had the droughted dam (at 17% capacity about 18 months ago) received this recent deluge, we might have had a small flood if at all as Wivenhoe probably would not have released water over the critical couple of days. The point remains from the 1974 BOM report: "Meteorological studies suggest that rainfalls well in excess of those recorded in the floods of 1893 and 1974 are possible". This is a pre-AGW report which suggests that the limits of natural rainfall events could be well in excess of the 1974 and 1893 floods. 2011 might well be on a par with 1974, and AGW (a very strong La Nina) could have a part, but this is not strong evidence for AGW when the limits of natural variation are still largely unknown. -
Marcus at 01:32 AM on 15 January 2011What is the Potential of Wind Power?
Like I said, adelady, with Vanadium Flow Cells, you could potentially store several Gigawatt hours of night-time wind power for distribution during the day-time, when wind-power is often slightly more scarce. -
Marcus at 01:29 AM on 15 January 2011Northern hemisphere warming rates: More than you may have heard
"P.S. Newspaper in Germany, France and Britain have announced that this winter is the coldest since 327 years (in Poland at the moment is thaw ...)" Factually incorrect again. Germany had its coldest *December* since 1969, the UK had its coldest December since 1979. Only France had truly *record* cold weather for December. I think you need to check your facts a little more carefully in the future. Of course, the next question is-what's your point? Since when does a single weather event constitute a trend? Was the record heat wave in Europe during the summer *proof* of global warming? -
Marcus at 01:20 AM on 15 January 2011Northern hemisphere warming rates: More than you may have heard
"In a semi closed system, like we are in, warming or cooling can occur with a relatively steady solar irradiance." It appears that cruzn246 is unfamiliar with the basic principle of Conservation of Energy. If the amount of energy entering & leaving the system remains unchanged, then so will long-term temperature trends. However, change the amount of energy coming in-or going out-& you get a change in the long term trend. What is interesting, though, is how we continue to get a long term warming trend even though the amount of incoming energy has been dropping at an average of 0.02 Watts/meter squared over the last 30 years. -
Arkadiusz Semczyszak at 01:01 AM on 15 January 2011Northern hemisphere warming rates: More than you may have heard
Very interesting work. One note. Is no “real” correlation - causal association - between anthropogenic aerosols and NH temperature (it is coincidental) - Consistency of global satellite-derived aerosol and cloud data sets with recent brightening observations., Cermak et al., 2010.: “In a period from the mid-1980s to the mid-2000s, aerosol optical depth is found to have started declining in the early 1990s, while cloud data sets do not agree on trends.” Can aerosol decrease cloud lifetime?, Small et al., 2009.: “... (ii) the “lifetime effect” whereby anthropogenic aerosol suppresses precipitation and results in clouds with more liquid water, higher fractional cloudiness, and longer lifetimes. Based on new observations presented here, and supported by previous fine-scale modeling studies, we suggest that the balance of evidence shows that non-precipitating cumulus clouds can experience an evaporation-entrainment feedback, and respond to aerosol perturbations in a manner inconsistent with the traditional “lifetime effect.” It is rather a weakening of the AMOC. P.S. Newspaper in Germany, France and Britain have announced that this winter is the coldest since 327 years (in Poland at the moment is thaw ...) -
Grim_Reaper at 01:01 AM on 15 January 2011What is the Potential of Wind Power?
Are there any credible studies out there that try to map out what proportion of world electricity needs to come from renewables year-by-year to give us a chance to stabilise CO2 emissions? I get the feeling that renewables will fall short of whatever's required (even if we go all out) for decades: So much of the technology is still 'growing up' (like solar and biomass), or has limitations (such as the intermittancy of wind), or is still under development (Energy storage would be a game changer but is still years away). Is there a gap opening up between where we need to be and where we actually are? If so, and it pains me to say this, could there be a case for using nuclear to plug that gap while we catch up? -
The Physical Chemistry of Carbon Dioxide Absorption
co2isnotevil - O2 and N2 will emit at characteristic line spectra based upon their molecular properties. They do not emit significant amounts in the thermal IR region, and hence do not factor into energy loss to space at Earth climate temperatures. Their emissivity at surface and atmospheric temps is essentially zero. In a hypothetic world without greenhouse gases the radiative energy going to space would be emitted from the surface, ground and ocean, emissivity ~90-95%, very close to a blackbody curve. Your question here is unclear to me - regarding the observed gaps in the emission spectra of the Earth, those are the GHG bands where IR is being re-radiated to the surface rather than space, and where the final emission to space (upper troposphere for H2O, stratosphere for CO2) is from much colder gases with correspondingly lower emission values than the surface. -
AlexanderAc at 00:35 AM on 15 January 2011Slovak translation of The Scientific Guide to Global Warming Skepticism
Hi Matt, well, there are cca. 5 000 000 Slovak people and many of them do not speak english. (AFAIK) And also every person who knows more about climate is useful, I think. But I agree absolutely with you that it might not be the most productive way to reduce emissions, but maybe it is necessary. China - at the per capita basis is still (though rising dramatically) lower than Slovakia, much less than US.... India is even less... Nobody said that knowing about global warming will reduce CO2. One person can only do what he/she can. And see the comment above :-) -
Mila at 00:34 AM on 15 January 2011Slovak translation of The Scientific Guide to Global Warming Skepticism
#1 CIA World Factbook: 5,470,306 (July 2010 est.) - 90%+ of them will have problems with English texts of this complexity; I do not know the translator whose work you so splendidly appreciated and maybe this is the reason that I see really red and cannot resist an ad hominem attack: how many foreign languages do you know in which you can read a material like this? -
scatter at 00:31 AM on 15 January 2011What is the Potential of Wind Power?
Heraclitus, NASA now have a research programme looking at airborne wind energy: http://www.nasa.gov/multimedia/videogallery/index.html?media_id=39102541# The potential is enormous, capacity factors high and embodied emissions low. It's a strong contender for being a hugely disruptive technology. In my view this area should get a massive R&D injection quick sharp. -
Arkadiusz Semczyszak at 00:22 AM on 15 January 2011Coral: life's a bleach... and then you die
@ Mike G As we can see and the various works - showing a different response of corals to temperature and reduce the alkalinity of water - I have presented only saying that the corals “will cope”. This is a "cherry picking", but only because they lacked the cited work - by me - above. Are coral reefs "will cope"? The worst of the corals will be very close to the pole (there are only 1-2 species of reef-building a whole), but: Lough and Barnes, 2000., comparison the two 20-year periods 1903-1922 and 1979-1998: "the SST-associated increase in calcification is estimated to be less than 5% in the northern GBR, ~12% in the central GBR, ~20% in the southern GBR and to increase dramatically (up to ~50%) to the south of the GBR." Is today's coral species survived similar changes in pH of the oceans - and temperature - as it is today? CO2 emissions causing ocean acidification to progress at unprecedented rate, National Research Council US: “Since the beginning of the industrial revolution, the average pH of ocean surface waters has decreased approximately 0.1 unit -- from about 8.2 to 8.1 -- making them more acidic. Models project an additional 0.2 to 0.3 drop by the end of the century. This rate of change exceeds any known to have occurred in hundreds of thousands of years, the report says.” “The results showed decreases in shell and skeletal growth in a range of marine organisms, including reef-building corals, commercially important mollusks such as oysters and mussels, and several types of plankton at the base of marine food webs.” It is true that we have only regional (but based on a consistent method of research) work in identifying variation in the pH of the oceans during the Last Glacial Period and the Holocene, but probably they may be representative for the whole ocean. Abrupt sea surface pH change at the end of the Younger Dryas in the central sub-equatorial Pacific inferred from boron isotope abundance in corals (Porites), Douville et al., 2010.: “Modern coral 11B values and the reconstructed sea surface pH values for different Pacific areas match the measured pH expressed on the Sea Water Scale and confirm the calculation parameters that were previously determined by laboratory calibration exercises. Most ancient sea surface pH reconstructions near Marquesas are higher than modern values.” ... but: “This last finding provides further evidence of the marked changes to the water mass pH and temperature properties in the equatorial Pacific at the Younger Dryas- Holocene transition and the strong impact of oceanic dynamic on the atmospheric CO2 content.” “An abrupt pH drop to 8.05 [-0,2 pH - unit] was observed at the end of the Younger Dryas around 11.5 kyr BP.” I recommend Figure 6 - circa 8.1 pH was the case 2 and 6 thousand years ago. In paper Instability of seawater pH in the South China Sea during the mid-late Holocene : Evidence from boron isotopic composition of corals, Liu et al., 2009. On this figure, we see a rapid decrease in pH of seawater circa 4,000 years ago and a pH lower than today - 6 thousand years ago. The Impact of Climate Change on the World’s Marine Ecosystems, Hoegh-Guldberg and Bruno, 2010.: There is a sentence like this: “Marine ecosystems are centrally important to the biology of the planet, yet a comprehensive understanding of how anthropogenic climate change is affecting them has been poorly developed.” ... but also a this sentence: “Recent studies indicate that rapidly rising greenhouse gas concentrations are driving ocean systems toward conditions not seen for millions of years, with an associated risk of fundamental and irreversible ecological transformation.” -
muoncounter at 00:21 AM on 15 January 2011Northern hemisphere warming rates: More than you may have heard
#8: "Tell us something we didn't know" Thanks, I take it from this remark that you are in agreement with faster than reported warming. You don't have to look far, even here on SkS, to find those who do not agree -- so 'something we didn't know' depends on what you mean by 'we'. "Thought is long from proof." Ah, that must be the sound of moving goalposts. If you have issues with either a solar cause for the early 20th century warming or the aerosol cause for mid-century cooling, see the relevant SkS posts. The rest of your last paragraph is a mass of confusion: for example, what's a 'semi-closed system'? Boil it down to the final 'world just doesn't seem to like to stay the same,' which is just another version of 'we don't know' or 'we can't know' or the usual ascientific tripe. Try harder next time. #9: JMurphy, input boxes? Don't see 'em here in Firefox. -
JMurphy at 00:11 AM on 15 January 2011Northern hemisphere warming rates: More than you may have heard
I can see three input boxes within the post, which cannot be clicked on or anything, and with greyed-out scroll bars. Is there meant to be anything in them, or is it just me and my computer/browser ? cruzn246, rather than constantly posting what you believe and don't believe, why not actually provide some data, evidence (whatever) so everyone can test the veracity of those beliefs ? -
sime at 00:09 AM on 15 January 2011What is the Potential of Wind Power?
For those of you who like a project this site will help you figure out how to lower your bills via - Solar, Wind, thermal, bio fuel etc. http://www.builditsolar.com/ Have a look at some of the big projects - I am on large cansolair build number 2 similar to this http://www.builditsolar.com/Projects/SpaceHeating/GregCanCol/GregCanCo.htm and will be doing a hot water system this year ready for next winter very similar to this http://www.krystofiak.com/solar/intro.html and this http://www.builditsolar.com/Projects/SpaceHeating/24by8Collector.htm For those who have doubts about heating from the sun try here http://www.youtube.com/user/richallenmusic#p/u/23/2Cm-cbOWvSs These systems work, they save you large amounts of money on your bills, and more to the point by actively participating in this you are actively reducing you carbon footprint. This is one of those rare hobbies that will save you money rather than cost you a fortune and can involve the whole family, can be great fun to build, and be a very effective way of teaching your children about alternative energy sources and their associated benefits and how to use them. -
cruzn246 at 00:07 AM on 15 January 2011Northern hemisphere warming rates: More than you may have heard
So what. Tell us something we didn't know. Here is the part that makes me wonder. "We know that early 20th century warming, thought to be largely driven by increasing solar irradiance, was followed by a mid-century cooling episode thought to be due to increasing aerosols." Thought is long from proof. We are still fuzzy on drivers and their net effects historically and presently. Anyone who says they have that all figured out is full of hooey. By this you would almost think that solar irradiance had to increase to have a warm-up. Not true. In a semi closed system, like we are in, warming or cooling can occur with a relatively steady solar irradiance. About the only thing that is unlikely during fairly steady solar times is steady temps. This world just doesn't seem to like to stay the same temp for long.Moderator Response: [Daniel Bailey] For someone studying climate science you demonstrate little command of the subject in your numerous postings here at Skeptical Science. Please be a positive resource to this discussion by providing links to peer-reviewed sources which support your position, rather than the dismissive handwaving which you do currently. Thanks! -
TerryG at 00:02 AM on 15 January 2011What is the Potential of Wind Power?
Ask the Danish what happens when you rely on wind power. -
adelady at 23:59 PM on 14 January 2011The Queensland floods
Ken, hope things are starting to get a bit cleaner for you now. Just a management question. Will businesses get priority for electrical certification to reconnect? I'd hope so, but it'd be nice to be sure. -
Eric (skeptic) at 23:57 PM on 14 January 2011The Queensland floods
Tom Curtis, an apples to apples comparison would be a wide area of proxies to a wide area of measurements (the BOM area is a bit small). Bob Tisdale's site had this chart http://i55.tinypic.com/2udz7yh.jpg showing about a 0.5 C rise which seems to agree with the BOM data. The AGW explanation is not in question here, just whether the variation is unprecedented. Here's a link to a (perhaps) better paleo proxy temperature study. Still only a few sampling locations, but they are spread out and their broader trends are comparable. Excel is also provided, here's the study http://www.nature.com/nature/journal/v431/n7004/full/nature02903.html Since there is virtually no modern data in this study, it cannot be used to compare modern changes, only past changes. It shows about 0.4C of rise and fall (figure 3b) from 2k ybp to a peak at 1k to preindustrial where the chart ends. There's not as much support for my "meme" here, but I need to find studies with more collection points, better resolution and modern data to be more certain. -
adelady at 23:41 PM on 14 January 2011What is the Potential of Wind Power?
The Ville, thanks for those examples. Here we already have some airconditioning units set to respond to remote adjustment to temperature when the grid is overloading. My view is that we already have the technology to allow airconditioning, water heating, refrigerators and freezers, industrial lighting - and we will soon have carparks fitted with plugin for electric cars - to be remotely switched on or off, or up/down depending on the grid situation. Instead of those German wind generating systems having to pay people to leave lights on at night when the wind is *really* blowing, we could have all such units built (or retrofitted) to feed into the grid if possible (cars) and to use up surplus generation where necessary or reduce demand by adjusting temperature settings or turning units on or off on a rotating basis. Once we change the engineering focus to the grid away from the idea of central supply and passive distribution, a whole lot of new approaches will follow quite naturally. -
Ned at 23:22 PM on 14 January 2011Northern hemisphere warming rates: More than you may have heard
Hey, nice post, muoncounter. (And thanks for the links to my older posts....) -
Paul D at 23:04 PM on 14 January 2011What is the Potential of Wind Power?
Just noticed a mistake in my last post: "3. One must remember that the point is to cut emissions! Without the wind turbines, the times when they are not spinning is time when coal and gas would be needed..." I meant that if the turbines weren't in place, the times that they would have been operating, require coal or gas. The default has been largely been coal and gas, wind turbines at the current small scale replace some of that capacity, hence cut emissions. The fact that when wind doesn't blow, coal and gas are used, is a red herring because coal and gas would have been the default. The issue changes when higher levels of wind is used and that is where new ideas and technology come in. -
fatir.b at 22:23 PM on 14 January 2011Northern hemisphere warming rates: More than you may have heard
great metodology and nice presentation with arguments. I had to register just to congrad. -
Paul D at 22:00 PM on 14 January 2011What is the Potential of Wind Power?
Oh my goodness where do you start?? 1. At the AGU last year someone did present some research that showed that some crops benefited from wind turbines placed in the same fields. 2. Regarding the UK and cold weather, if you take a look at the National Grid report about the recent cold spell. Out of the many weeks that we had snow and freezing conditions, it was only on 2 or 3 days that zero wind conditions caused a problem. In fact about three nuclear power plants were not contributing either. On top of that, oil and hydro also underperformed. 3. One must remember that the point is to cut emissions! Without the wind turbines, the times when they are not spinning is time when coal and gas would be needed, so emissions for that capacity would shoot up from double figure emissions (30 or so gCO2/KWh) to triple figure emissions (900 gCO2/KWh) if the wind turbines were not in place. Whilst wind represents a small part of the mix, emissions are cut and they don't represent an issue, the issue changes when wind represents a larger proportion of the mix and traditional power stations will have to fill in gaps rather. That requires new thinking and changes to the grid system. 4. One of the primary issues is load balancing of the grid. You do this by monitoring the frequency and either adjust the generator end or you adjust the consumer end, so that you get a steady 50hz. Traditionally because fossil fuel power plants have been designed to run constantly 24/7 it has been necessary for electricity companies to push consumers to buy products that soak up that generation capacity, then if consumer demand changed, massive power stations would be taken off or put online. That model is changing and now consumer products will need to participate in the balancing game. As an example there are at least two projects in the UK that are developing fridges that can monitor the grid frequency and take themselves on and offline depending on the situation. True Energy in Wales is is using vaccine refigeration technology to develop domestic/commercial fridges that can keep your food cool without power for 10 days. 5. Then of course their is the super grids that are being developed to hook up European nations. This is another way to achieve load balancing and shifting energy around. 6. There is also a smart grid project in the UK that is testing some of this technology. There is an enormous amount research and product development going on and the likes of Paul Hudson hasn't a real clue about the engineering. -
JudiDi at 21:39 PM on 14 January 2011The Queensland floods
This is my first time to your site, and I am a little overwhelmed with all the information. Most important things first - it's good that you and your family are safe. There are so many tragic stories about loss of life. My home on the Hawkesbury River (NSW) inundated in the '78 flood - all safe but still the memory leaves me a little too empathic with flood victims. I do have a question about climate change and the Queensland floods. With so much water over such a large area, can this have any immediate or lasting effect on climate? -
Lazarus at 21:31 PM on 14 January 2011Northern hemisphere warming rates: More than you may have heard
It would be interesting to see this globally, as a layer on google maps / earth. Good visualisation method. -
Lazarus at 21:25 PM on 14 January 2011What is the Potential of Wind Power?
That somewhat seemingly skeptical weather bloke at the BBC, Paul, Hudson, has recently posted showing that; "the intense cold has gone hand in hand with periods of little or no wind. ... With much of the country experiencing very little wind, both onshore and offshore, wind turbines were largely inactive. This means that there would have to be some power stations - using coal or gas, since nuclear power output can't be increased at short notice - that simply exist as a stand-by facility, in case the wind doesn't blow. And that's a very expensive way of producing electricity. ... Professor Mike Lockwood at Reading University thinks that the UK could indeed experience colder winters on average, compared with the last few decades because of the sun's low activity. This would lead to a higher frequency of 'blocking' weather patterns leading to less frequent windy conditions than would normally be expected if one looks at climatological averages - suggesting we would have to continue to rely on coal and gas fired power generation well into the future - and possibly more than is currently envisaged." http://www.bbc.co.uk/blogs/paulhudson/2011/01/coal-takes-the-strainagain.shtml -
Tom Curtis at 21:18 PM on 14 January 2011Northern hemisphere warming rates: More than you may have heard
A significant part of the rapid Northern Hemisphere warming is the high proportion of land ot ocean in the NH, mostly due to the Asian land mass. This accentuates the warming trend which is stronger towards the poles in any event, and even stronger in the arctic because of summer ice melt and albedo effects. Conversely, the relative lack of land in the Southern Hemisphere below 23.6 degrees south relative to the tropics hides the increased warming trend in southern regions. Unique circumstances in Antarctica also limit the warming trend, further weakeing the Southern Hemisphere trend so that it is approximately equal to that of the tropics. It would be interesting to see a graph of the NH, Tropics, and SH land only temperature anomalies by latitude; and also the equivalent ocean only anomalies, so that this distortion could be removed. -
Rob Painting at 20:58 PM on 14 January 2011Northern hemisphere warming rates: More than you may have heard
Bit of an eye-opener that. I was aware of the Arctic warming extremely fast, but not the Northern Hemisphere as a whole. -
Rob Painting at 20:50 PM on 14 January 2011Coral: life's a bleach... and then you die
HR - There is obviously some debate in the scientific community about the issue of coral reef calcification That's one way of putting it, not very accurate though. The calcification predictions made in McNeil 2004 aren't actually occurring. Doesn't that dent your confidence in their predictions?. Aside from all the other faulty assumptions in their paper?. Note the links provided by Mike G @ 34. This from De'ath 2009. A 14% calcification decline in the Great Barrier Reef since 1990. Similar results in South-East Asia, the Caribbean and a whopping 50% decline in the cooler water reefs of Bermuda.
What debate?.
A 14% calcification decline in the Great Barrier Reef since 1990. Similar results in South-East Asia, the Caribbean and a whopping 50% decline in the cooler water reefs of Bermuda.
What debate?.
-
MattJ at 20:48 PM on 14 January 2011Slovak translation of The Scientific Guide to Global Warming Skepticism
It is interesting that it is available in so many languages, but I keep on thinking: of all the people who have to be convinced of the urgent need for action, how many of them speak Slovak? And of those, how many do not already read English? So it seems to me that translating into Slovak is not very productive. It is Chinese and the Indian languages where we need it. And perhaps Russian, too, since Putin is so very determined to pump as much oil and gas as he can and get the best price for it. After all, it was the Chinese and Indians who sabotaged the Copenhagen conference; they would have hesitated to do this if the facts about global warming were better known among their populations. Unless, of course, all the web sites bearing it were blocked by "the Great Firewall of China". -
MattJ at 20:43 PM on 14 January 2011Northern hemisphere warming rates: More than you may have heard
I keep reminding people that if we don't recover soon from the current recession, we will soon be hit by the economic shock due to global warming, so that we will never recover. I can't tell if anyone is really getting the point, though. -
tobyjoyce at 20:28 PM on 14 January 2011Northern hemisphere warming rates: More than you may have heard
Excellent post, which I will read in more detail later. A little nit: "begging the question" (para 8) is a logical fallacy meaning to assume what you are trying to prove. It is the listener or reader who is bieng "begged". The phrase is now so often used in the sense of "inviting the question" that it is rarely queried. Begging the Question -
HumanityRules at 20:07 PM on 14 January 2011Coral: life's a bleach... and then you die
Apologies Albatross for mixing up denier and skeptic but it makes little difference. There is obviously some debate in the scientific community about the issue of coral reef calcification and climate change. The debate is not the result of skeptics mis-information. Address that issue rather than making vague claims about posts here. With regard to you're personnal observation about Mauritius in 2001. There's a report here covering the period you were there. They seem to rule out ocean changes associated with climate change. In the worst declining study area they clearly blame the pressure of tourism. http://www.unuftp.is/static/fellows/document/ravi05aprf.pdf "The patterns in the reef community structure could not be linked to any of the recorded environmental parameters (sea surface temperature, salinity, pH and dissolved oxygen). It is postulated that these parameters were not the appropriate indicators for monitoring the observed changes in the coral reefs." "In recent years, the nature of the coastal activities in this area has shifted from an agro-industrial area in the past to presently hosting the main tourism related developments in the southern part of the island......This reef was previously reported as being rich and healthy and has been badly damaged by algae and cyanobacteria from very recent nutrient inputs to the coastal waters.....Since sugar cane cultivation on the nearby hill slopes is not new, the source of nutrients is from land alterations during the development and most likely from leakages from septic systems of new hotel developments" ( -edit- )Moderator Response: (Daniel Bailey) Cease making things personal. -
Mila at 20:01 PM on 14 January 2011What is the Potential of Wind Power?
A review of wind energy technologies Volume 11, Issue 6, August 2007, Pages 1117-1145 doi:10.1016/j.rser.2005.08.004 free copy: http://www.inference.phy.cam.ac.uk/sustainable/refs/wind/WindReview.pdf provides a lot of useful background facts -
Rob Painting at 19:45 PM on 14 January 2011Coral: life's a bleach... and then you die
Albatross - They almost had me convinced Apologies for that. Maybe I didn't stress the global decline of coral strongly enough?. I had planned to have two other rebuttals ready to go, to address the common coral myths, but haven't quite got there. And as far as sea urchin are concerned, although tolerant of lower pH, acidification will impact many of them too at some point if we continue to acidify the oceans. The sea is basically an organic soup of sperm, eggs and juvenile life stages of marine organisms. It's at this stage that many are vulnerable. Sea urchin too. The overall view is that they will be impacted later rather than sooner under business-as-usual scenarios. I understand they are not at immediate risk though, unlike coral. A recent metadata analysis here: Impact of near-future ocean acidification on echinoderms - Dupont 2010 How many skeptics eat sea urchin & starfish I wonder?. -
gpwayne at 18:09 PM on 14 January 2011What is the Potential of Wind Power?
Anyone fancy inviting Prof. MacKay to respond to the remarks about Without Hot Air? -
Tom Curtis at 18:08 PM on 14 January 2011The Queensland floods
Eric @62, to illustrate the point about averaging, here are the averages of the three data series from your second link for the first twenty terms: -0.37, -0.2, -.43, -1.3, -0.9, -0.6, 0.23, -0.23, 0.02, 0.07, 0.02, 0.6, 0.3, 0.51, 0.27, 0.6, 0.2, 0.07, 0.63, -0.1. The average used the same time step as the data for the Sargasso sea, averaging with the nearest value in time for the other series, or if no close value was available, with the intercept of the plot of the other data series. (Values judged by eyeball and calculated in my head.) The averaged values vary between -0.9 and 0.63, a range of 1.53. Over the same twenty time intervals, the values for the Sargasso Sea vary between -1 to 1.5, a range of 2.5. The averaged values, in other words exhibit only 60% of the variability of the individual data series. This reduction in variability is a well known property of multiple series, which is why temperature variability over multiple locations is not meaningfully compared as to variability with single sites as you have done. Of course, the more data points used in an average, the less the variability that survives. In this context, it is therefore relevant to list the data sources behind the BOM's SST product: "Data Acknowledgments The Bureau of Meteorology gratefully acknowledge the following institutions and data products that have been used to develop the system: BLUElink project partners - CSIRO and RAN Ocean General Circulation Model: Geophysical Fluid Dynamics Laboratory, Modular Ocean Model version4p0d Bathymetry: USNavy, US Navy 2 minute global bathymetry NOAA, General Bathymetric Chart of the Oceans, 1 minute global bathymetry Geoscience Australia, 1km regional bathymetry Satellite remote sensing: NASA and CNES: Jason-1, IGDR ESA, Envisat, IGDR NOAA, AMSR-E Real-time in situ observations: These are data made freely available from a large number of sources, through mechanisms such as the Global Telecommunications System of the World Meteorological Organization. For BLUElink they include specifically observations made by: Autonomous profiling floats (Argo) Expendable bathythermograph (XBT) Conductivity Temperature Depth (CTD) TAO/TRITON array" Clearly we should expect far less variability in the BOM's SST average than in data from a single location (or just three locations), and finding that reduced variability proves nothing. Tackled differently, there is clearly more variability in the individual years (range of 1.2 degrees) than in the decadal trend (range of 0.7 degrees) in the chart above, again indicating the effects of taking an average. If we look at more detailed data, say by lookiing at the the decadal trend for individual regions, we see a variability range of up to 2 degrees in some regions, such as the Gulf of Carpentaria. (We also see that the increase in SST in Qld waters has been significantly greater than that in Australian waters generaly.) I know you want to doggedly repeat a meme you have found comforting, but that is no substituted for analysis. Analysis shows the data you provide to approximately follow a pattern of warming to the peak at the MWP, then cool to a minimum at the LIA, and then warm again. If extended it would no doubt show the current peak at around about, or higher than that of the MWP. Those broad fluctuations of temperature, and hence energy content of the ocean/atmosphere system need an explanation, and as noted above, no non-anthropogenic explanation of the recent warming can be found that is consistent with the data - and not for the lack of trying. A significant proportion of modern climate scientists initially backed a different horse; but were dragged reluctantly to the IPCC position by shere force of data. No amount of prattling on about variability can obviate this fact. -
Rob Painting at 17:49 PM on 14 January 2011Coral: life's a bleach... and then you die
Mike G @ 43 - Good catch, my bad. I didn't realize Mfripp was referring to the graphic I posted. And I second Phillipe's comment, your knowledgeable contributions are greatly appreciated.
Prev 1986 1987 1988 1989 1990 1991 1992 1993 1994 1995 1996 1997 1998 1999 2000 2001 Next


