


 Arguments


Recent Comments
Prev 1990 1991 1992 1993 1994 1995 1996 1997 1998 1999 2000 2001 2002 2003 2004 2005 Next
Comments 99851 to 99900:
-
co2isnotevil at 14:29 PM on 13 January 2011The Physical Chemistry of Carbon Dioxide Absorption
KR, Here are the results from 5 atmospheric simulations runs. Four atmospheric zones are considered where the vertical profile is interpolated between the zone means and integrated from the surface to 50km. GHG's, except H2O and O3, are considered uniformly mixed, while H2O and O3 follow a profile with a specific average concentration per zone. The zones are defined as follows: Zone range Frac Pressure Temp @nominal surface temp 0: 0km to 3km, 30.54%, 0.84328, 278.855K (42.27F) 1: 3km to 6km, 52.65%, 0.58097, 256.050K ( 1.22F) 2: 6km to 15km, 88.11%, 0.28280, 226.323K (-52.29F) 3: 15km to 50km, 99.93%, 0.04252, 243.075K (-22.13F) When 2 or more gases are absorbing the same wavelength, both are counted, but the total is accounted for as being contributed by only one gas. The gas selected will be the one absorbing the largest fraction of the total. Absorbed power is relative to the emitted surface spectrum at it's average temperature. The first result is the average clear sky absorption with nominal GHG concentrations. The clear sky absorption is 56.6%, while the average cloudy sky absorption is about 85.7%. For 66.6% clouds and 33.3% clear, the total absorption is .566*.333 + .857*.666 = 0.760, for a net 76% absorption and an average transparent window of about 24% and yes, I rounded this up to 24.1% in my energy budget calculations. The second is at 280 ppm CO2 with all else set to nominal. The third is at 560 ppm CO2 with all else set to nominal. The delta absorption from the second case is 3.6 W/m^2, and while CO2 increases by more than this, the water vapor component decreases. The fourth is CO2 at 280 ppm and everything else set to zero. The last is CO2 at 560 ppm and everything else set to zero. Here, the delta is 4.79 W/m^2. With the water vapor missing and not otherwise absorbing in overlapping bands, the effect of CO2 by itself will be larger. 1) *************************************************************************************** model type = 'Monthly T', res=0.100 nm @ 1u, 23026 samp/decade, Ascale=1 Water Content: 1000:1300:144:1 ppm, Cloud Coverage: NOM, Surface Ice: NOM Absorption: CO2: 383 ppm, CH4: 1745 ppb, O3: 30:80:150:300 ppb, N2O: 300 ppb, CO: 100 ppb absorption component breakdown: H20 = 116.7797 W/m^2, fraction = 0.354451 CO2 = 57.5560 W/m^2, fraction = 0.174695 O3 = 5.2293 W/m^2, fraction = 0.0158721 CH4 = 3.5440 W/m^2, fraction = 0.0107568 N2O = 3.3771 W/m^2, fraction = 0.0102503 CO = 0.0558 W/m^2, fraction = 0.000169222 O2 = 0.0053 W/m^2, fraction = 1.62356e-05 total = 186.5472 W/m^2, fraction = 0.56621 force = 93.2736 W/m^2, fraction = 0.283105 50% up, 50% down 2) *************************************************************************************** model type = 'Monthly T', res=0.100 nm @ 1u, 23026 samp/decade, Ascale=1 Water Content: 1000:1300:144:1 ppm, Cloud Coverage: NOM, Surface Ice: NOM Absorption: CO2: 280 ppm, CH4: 1745 ppb, O3: 30:80:150:300 ppb, N2O: 300 ppb, CO: 100 ppb absorption component breakdown: H20 = 117.0733 W/m^2, fraction = 0.355343 CO2 = 55.5709 W/m^2, fraction = 0.168669 O3 = 5.2355 W/m^2, fraction = 0.0158908 CH4 = 3.5426 W/m^2, fraction = 0.0107524 N2O = 3.4168 W/m^2, fraction = 0.0103707 CO = 0.0551 W/m^2, fraction = 0.000167238 O2 = 0.0053 W/m^2, fraction = 1.62356e-05 total = 184.8995 W/m^2, fraction = 0.561209 force = 92.4498 W/m^2, fraction = 0.280605 50% up, 50% down 3) *************************************************************************************** model type = 'Monthly T', res=0.100 nm @ 1u, 23026 samp/decade, Ascale=1 Water Content: 1000:1300:144:1 ppm, Cloud Coverage: NOM, Surface Ice: NOM Absorption: CO2: 560 ppm, CH4: 1745 ppb, O3: 30:80:150:300 ppb, N2O: 300 ppb, CO: 100 ppb absorption component breakdown: H20 = 116.4037 W/m^2, fraction = 0.35331 CO2 = 59.9992 W/m^2, fraction = 0.18211 O3 = 5.2580 W/m^2, fraction = 0.0159591 CH4 = 3.5451 W/m^2, fraction = 0.0107602 N2O = 3.2633 W/m^2, fraction = 0.00990468 CO = 0.0543 W/m^2, fraction = 0.000164875 O2 = 0.0053 W/m^2, fraction = 1.62356e-05 total = 188.5290 W/m^2, fraction = 0.572226 force = 94.2645 W/m^2, fraction = 0.286113 50% up, 50% down 4) *************************************************************************************** model type = 'Monthly T', res=0.100 nm @ 1u, 23026 samp/decade, Ascale=1 Water Content: 0:0:0:0 ppm, Cloud Coverage: NOM, Surface Ice: NOM Absorption: CO2: 280 ppm, CH4: 0 ppb, O3: 0:0:0:0 ppb, N2O: 0 ppb, CO: 0 ppb absorption component breakdown: H20 = 0.0000 W/m^2, fraction = 0 CO2 = 57.9766 W/m^2, fraction = 0.175971 O3 = 0.0000 W/m^2, fraction = 0 CH4 = 0.0000 W/m^2, fraction = 0 N2O = 0.0000 W/m^2, fraction = 0 CO = 0.0000 W/m^2, fraction = 0 O2 = 0.3406 W/m^2, fraction = 0.00103377 total = 58.3172 W/m^2, fraction = 0.177005 force = 29.1586 W/m^2, fraction = 0.0885026 50% up, 50% down 5) *************************************************************************************** model type = 'Monthly T', res=0.100 nm @ 1u, 23026 samp/decade, Ascale=1 Water Content: 0:0:0:0 ppm, Cloud Coverage: NOM, Surface Ice: NOM Absorption: CO2: 560 ppm, CH4: 0 ppb, O3: 0:0:0:0 ppb, N2O: 0 ppb, CO: 0 ppb absorption component breakdown: H20 = 0.0000 W/m^2, fraction = 0 CO2 = 62.7645 W/m^2, fraction = 0.190504 O3 = 0.0000 W/m^2, fraction = 0 CH4 = 0.0000 W/m^2, fraction = 0 N2O = 0.0000 W/m^2, fraction = 0 CO = 0.0000 W/m^2, fraction = 0 O2 = 0.3406 W/m^2, fraction = 0.00103376 total = 63.1051 W/m^2, fraction = 0.191537 force = 31.5526 W/m^2, fraction = 0.0957687 50% up, 50% down -
Albatross at 14:15 PM on 13 January 2011The Queensland floods
Michael @40, Good points. Regarding the 5% increase, that was Trenberth's estimated increase for the entire global ocean. So, locally/regionally, values could be much higher-- and that may well have been the case for this event, especially given the record high SSTs surrounding Oz of late. The research papers that will no doubt be published on this in the coming months and years will help shed some more light on the situation. As I and others have said, it would not be correct to blame this event entirely or even primarily on AGW-- La Nina almost certainly had a role. But it is, IMHO, likely that the higher SSTs and attendant higher PWV contents made the situation worse. -
Phila at 14:09 PM on 13 January 2011Could global warming be caused by natural cycles?
Also, Pirate: If indeed we are offsetting the influence of the Milankovitch cycles, then that is a very good thing. It never ceases to amaze me that the very same people who prattle endlessly about all the deep, dark "uncertainties" in climate science have absolutely no problem making imperious categorical statements like this one. It's hard not to conclude that getting the right conclusions is more important to you than using the right facts and methods. -
Yvan Dutil at 14:03 PM on 13 January 2011Could global warming be caused by natural cycles?
#48 Very nice paper. By the way, the scenario studied in this paper do take account of the peak oil, peak gas and peak coal in some way. -
Phila at 13:56 PM on 13 January 2011Could global warming be caused by natural cycles?
Pirate: the AGW theory cannot explain the previous warmings and coolings. And natural cycles can't explain the current warming. Fortunately, modern climatology provides a coherent explanation for both. If memory serves, you claimed to be a teacher of environmental science. Don't you have any colleagues who could explain these basic concepts to you? Or a library? -
muoncounter at 13:43 PM on 13 January 2011Could global warming be caused by natural cycles?
#73: "dinosaurs" No dino-SUVs, but they did breathe out CO2... didn't we have a thread on that, concluding that if everyone holds their breath a few minutes a day, problem solved? -
Tenney Naumer at 13:30 PM on 13 January 2011The Queensland floods
So glad to know you and your family are on high ground, John. What a tragedy. I remember the epic Mississippi River flood of 1993 -- houses and small towns floated away in southern Illinois, where I am from. But that flood seemed to be more a gradual thing. Hang in there. -
HumanityRules at 13:10 PM on 13 January 2011The Queensland floods
#24 Mila It was Table 11.4 for WGII that I was struggling to remember. 26 MarkR It strikes me that "net increase in atmospheric water vapour" is a prediction of a warmer world not specifically AGW. Many AGW critics don't deny we've seen a recent warming trend. It seems to be the attribution of that warming world that's crucial. 31 David Horton I personnally haven't seen a chorus of deniers on this subject but then I haven't seen a chorus of people saying it's AGW. David Karoly at Melbourne (Monash?) University is the only person to make the direct link between these floods and AGW on ABC News24 yesterday. There's an image below of the effects of La Nina. I guess if you wanted to make comparisons of modern and older La Nina precipitation you'd have to look at rainfall over the whole region under that green boomerang. Within any particular small region under that boomerang (such as Queensland) it's going to be a combination of La Nina and local weather conditions which govern just exactly where the rain is falling. For example some of the earliest flooding events in Queensland in December occured when Tropical Cyclone Tasha dragged in a heap of La Nina rain and flooded three river systems. I'm not sure what's causing the recent flooding of the Brisbane River basin. I'm curious about what happened in respect to the Wivenhoe Dam it seems to have reached peak capacity just at the wrong time but somebody with more knowledge on that would be appreciated.
More generally there's a couple of links I came across and thought were interesting. The first is a news report, what impressed me was the date it was filed on. The second is a list of Australian climate disasters from the BOM website, it looks like mother nature has been punching hard for a while.
News report
BOM climate disasters
Within any particular small region under that boomerang (such as Queensland) it's going to be a combination of La Nina and local weather conditions which govern just exactly where the rain is falling. For example some of the earliest flooding events in Queensland in December occured when Tropical Cyclone Tasha dragged in a heap of La Nina rain and flooded three river systems. I'm not sure what's causing the recent flooding of the Brisbane River basin. I'm curious about what happened in respect to the Wivenhoe Dam it seems to have reached peak capacity just at the wrong time but somebody with more knowledge on that would be appreciated.
More generally there's a couple of links I came across and thought were interesting. The first is a news report, what impressed me was the date it was filed on. The second is a list of Australian climate disasters from the BOM website, it looks like mother nature has been punching hard for a while.
News report
BOM climate disasters
-
Michael Hauber at 12:15 PM on 13 January 2011The Queensland floods
Certainly an interesting topic. Running some numbers on the Clausius-Clapeyron relation a warming of about 0.5 degrees should result in about 5% extra water vapour in the atmosphere. I don't think that would make much difference to the overall flood level. On that basis AGW has very little responsibility for this event. But other factors may have contributed. If AGW is changing the ENSO cycle, or some other aspect of our circulation, then it may have made a more significant contribution to this event. Of the flood events I can think of for SEQ, many have not been associated with cyclones, but with east coast lows instead. However there was no low associated with this event which does make it at least very unusual. And rainfall trends for Australia are uncertain. Modelling I have looked at by CSIRO suggests more rain in the north during summer, and less rain in the south during winter. This matches the basic global expectation that the Hadley Cell should intensify stretching the subtropical dry belt further south, and intensifying the monsoon. Long range trends for the last 100 years seem to match this, but if you look at the trend the effect is a lot more subtle than the recent severe droughts which have mostly ended would suggest. Also in the models the south/winter drying trend seems to dominate the north/summer rainier trend, whereas the last 100 years it is more the opposite. This spring and summer's weather in Australia also would appear to have a lot to do with the polar vortex, which over the last few decades has shrunk towards Antarctica. Since Spring though it has shown a persistent extension towards Australia introducing colder air, and I believe strengthening the tendancy towards upper level troughing, which has been the dominant factor in recent rains, and not so much the monsoonal/cyclonic type rains that are the primary influence of a La Nina pattern. -
Rob Painting at 12:07 PM on 13 January 2011Could global warming be caused by natural cycles?
Pirate @ 67 - but the AGW theory cannot explain the previous warmings and coolings. Not unless you believe dinosaurs, woolly mammoths and sabre-toothed tigers drove SUV's. -
Rob Painting at 12:03 PM on 13 January 2011It's cooling
105 & 106 - UAH satellite data agrees too. It's a trifecta!.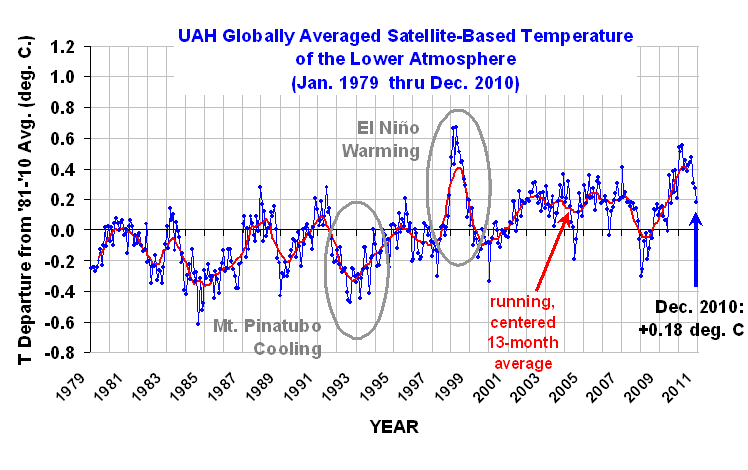 From Roy Spencer:
"WHO WINS THE RACE FOR WARMEST YEAR?
As far as the race for warmest year goes, 1998 (+0.424 deg. C) barely edged out 2010 (+0.411 deg. C), but the difference (0.01 deg. C) is nowhere near statistically significant. So feel free to use or misuse those statistics to your heart’s content."
Sore loser!.
From Roy Spencer:
"WHO WINS THE RACE FOR WARMEST YEAR?
As far as the race for warmest year goes, 1998 (+0.424 deg. C) barely edged out 2010 (+0.411 deg. C), but the difference (0.01 deg. C) is nowhere near statistically significant. So feel free to use or misuse those statistics to your heart’s content."
Sore loser!.
-
Tom Curtis at 11:52 AM on 13 January 2011The Queensland floods
Martin, the predictions are that Global Warming will make El Nino's and La Nina's stronger, and El Nino's more frequent; which is quite diferent from the way you say it. -
Daniel Bailey at 11:10 AM on 13 January 2011It's freaking cold!
To amplify on DSL's perspicacious (I get paid by the syllable) comment: Source here
I hear they'll be growing palm trees by Hudson Bay any time now...
And here's why they call it "up" north:
Source here
I hear they'll be growing palm trees by Hudson Bay any time now...
And here's why they call it "up" north:
 That's Polar Amplification in action!
The Yooper
That's Polar Amplification in action!
The Yooper
-
Daniel Bailey at 11:02 AM on 13 January 2011Could global warming be caused by natural cycles?
As for me, I'm staying in the trees where it's safe... (yeah, yeah, "Off-topic"...to the deleted bin I go...) -
Paul D at 10:57 AM on 13 January 2011Could global warming be caused by natural cycles?
I don't know. Next, someone will be saying that they can float steel in water. -
JMurphy at 10:38 AM on 13 January 2011Not So Cool Predictions
It would appear that some so-called skeptics need to learn how to read temperatures and trends, and to this end I would recommend a BBC programme that was on a couple of days ago, presented by a comedian who is an ex-physicist : What Is One Degree Generally, though, it is a very watchable and easy to understand look into what it means to measure temperature and how just a small increase can have large effects. Hope it helps those who somehow believe that the world is cooling. -
JMurphy at 10:30 AM on 13 January 2011The Queensland floods
Formidable power of water evident in those videos - best of luck to everyone over there being affected. Here in the UK, we seem to be currently affected by significant downpours of rain, following on from the downpours of snow a few weeks ago, and there are a few potential problems being forecast in some areas. Nothing like what is occurring in the Southern Hemisphere but more evidence of the amount of water in the atmosphere all over the world. Also, the way the temperatures have been here since the cold spell last month, I wouldn't be surprised if this Winter is a lot warmer than the last few weeks of last Autumn. It's odd how the temperatures here have risen as we head towards the middle of Winter. Who knows what will happen next ? -
hfranzen at 10:17 AM on 13 January 2011The Physical Chemistry of Carbon Dioxide Absorption
#61: As regards the Ohio state spectrum, the point is that there are, in the vicinity of the bending transition, a host of single spikes that have the earmarks of single transitions standing alone. It seems quite clear to me that the CO2 absorptions are not buried in a sea of water vapor transitions. Maybe there is some overlap, but even then the CO2 would contribute to the absorption. If the overlap is a serious problem it is a mystery to me how there could be agreement between what GWPPT6 calculates and what is observed, as there is. I most confess I don't see where you are trying to go. If it is your wish to cast doubt on the conclusion that the GHG effect of CO2 is the major cause of the observed increases in the earth's temperature you are barking up the wrong tree. That is proven by the detailed computer calculations of the climate scientists. If it is your wish to show for some reason that the GWPPT6 calculaton is without merit you will have to point to something more fundamental than the assumption that water vapor-CO2 overlap is not significant becuse the whole point of GWPPT6 is to show the essential features of diffuse broad-band absorption, and to undermiine that requires a definitive statement such as, "the use of this equation is wrong because" or "these data do not apply" or some such. I have worked as a scintiist for over fity years and it is clear to me that when it comes to appying them to processes all scientific calculations are approximations. For example, we leave out perturbations by masses other than the earth for terrestrial trajectory calculations. Someone wishing to cast doubt upon a calculation could always say, "you can't make that approximation" and, if one were foolish enough, they could go on forever including smaller and smaller perturbations (the sun, the moon, Mars, Jupiter, and on and on). It is my belief that when someone produces a calculation the gives a result that is botn observed and confirmed by a more inclusive theory and someone else wishes to doubt the result it is up to the doubter to produce evidence why the calculation should be challenged. That is what I am asking you to do. And if you can successfully do it I will withdraw totally. That is how science works (at least so I hope). So I sincerely offer you best wishes in your search for a definitive argument. But please do not believe that all you have to do is say, without a number to back you up, that someone cannot make approximations. Without approximations science would be useless.Moderator Response: [muoncounter] Word to the wise: This 'casting doubt' has happened before. -
Bibliovermis at 10:14 AM on 13 January 2011Could global warming be caused by natural cycles?
AGW is a subset of climatological theory which does explain past climate change. -
Anne-Marie Blackburn at 09:39 AM on 13 January 2011Could global warming be caused by natural cycles?
apiratelooksat50 The theory of anthropogenic climate change explains current climate change. You're building yet another straw man by suggesting that it should explain past climate change too - it doesn't, and it doesn't claim that it does. -
The Queensland floods
Sphaerica - "the planet will take so long to heat that for the sort of person (i.e. most people) who needs to actually witness the effects to be motivated to take action" - Yep, frogs in a slowly warming pot of water, heating too slowly to let them know they're actually dinner. John Cook - glad to hear you're doing OK. My immense sympathies for those caught in the floods. The '77 Johnstown PA flood happened very close to where I grew up, and I understand what a horrible situation it is. -
Bob Lacatena at 09:31 AM on 13 January 2011The Queensland floods
31, David Horton, Just a follow on to my previous post/thought. Sad to say, if you think this is bad... "you ain't seen nothing yet." Sadly, too, it seems nine people died in the flooding, and 59 are missing. While with my current logic it is too soon to say, I wonder if at some future date those poor souls will be regarded as the first known victims of climate change. -
hfranzen at 09:30 AM on 13 January 2011The Physical Chemistry of Carbon Dioxide Absorption
#60 I don't understand - I gave a simple answer namely 9.5 W/sq.m. I also describe, using the 100 year ppm increase as an example, where I get this answer and ask, basically, if you can see some reason why is so different from the numbers you give. What more can do? -
Bob Lacatena at 09:28 AM on 13 January 2011The Queensland floods
31, David Horton, My opinion on this is usually that temperatures have not yet risen enough to make any real attributions. One can, in an emotional way, say "ouch, that hurts, what if..." but really there have been killer hurricanes, droughts, floods and more throughout time. I think it's very hard to say "this might not have happened without global warming" at this point in time. The day will come, obviously, when the temperature of the planet has risen so much that ecosystems permanently change -- Amazon to savanna, Arctic Ocean to open sea, the U.S. Southwest to expansive desert, Australia to "the warm, wet desert continent" (with flash floods, and so sister to Antarctica, "the cold, wet desert continent"), etc. There will also be a day when statistically the number, strength, locations and/or range of hurricanes, tornadoes, monsoons and blizzards has changed enough that there simply is no doubt that we've entered a new paradigm. But for now, no, I try to stay away from attributing any single event whatsoever to climate change or current warming. And that's one of the dangers of it all -- that the planet will take so long to heat that for the sort of person (i.e. most people) who needs to actually witness the effects to be motivated to take action, it means it will be far, far too late. -
Lou Grinzo at 09:22 AM on 13 January 2011The Queensland floods
John: Add me to the list of people who are very relieved to hear that you and your family have been spared. My wife and I experienced a very bad flood long before we met. We lived on different sides of a river in Pennsylvania that was part of the 1972 Agnes flooding. Ten feet of water on the streets, dikes blew out unleashing a wall of water that knocked dozens of houses off their foundations, a gutted cemetery, and more details I won't begin to inflict on people here. So everyone, please spare a donation to the aid organization John mentioned in his post. Being in such a situation is a terrible and unique horror; hopefully a bit of tangible support from strangers can help those struck by this event. -
muoncounter at 09:14 AM on 13 January 2011Could global warming be caused by natural cycles?
#67 "Of course it's natural" Prove that. I refer you back here. Explain how the recent warming looks like anything that has happened in the past 2000 year record. "AGW theory cannot explain the previous warmings and coolings." Not necessary. The whole body of climatic research contains natural mechanisms and explains them. Those same 'natural' mechanisms do not explain the current warming -- as you have been told, but refuse to accept. Apparently your position was, is and will continue to be 'no, its not.' That's not one borne of scientific understanding; its denial pure and simple. -
apiratelooksat50 at 09:06 AM on 13 January 2011Could global warming be caused by natural cycles?
"For example, we are warming far too fast to be coming out of the last ice age, and the Milankovitch cycles that drive glaciation show that we should be, in fact, very slowly going into a new ice age (but anthropogenic warming is virtually certain to offset that influence)." A) Of course it's natural. Perhaps enhanced or delayed by our actions, but the AGW theory cannot explain the previous warmings and coolings. B) If indeed we are offsetting the influence of the Milankovitch cycles, then that is a very good thing. C) And, Gordon @ 63. First, of course I care about my children and grandchildren, so please don't bring that tired and offensive arguement out. And, second, you use a term, "excessive warming", that can't possibly be quantified. -
Phila at 08:46 AM on 13 January 2011Could global warming be caused by natural cycles?
clouds are a miracle. And why would God enact this miracle? To provide a negative feedback to AGW, obviously. So much for alarmism! -
Mila at 08:29 AM on 13 January 2011The Queensland floods
#31 : IPCC AR4: http://www.ipcc.ch/publications_and_data/ar4/wg1/en/ch3s3-8.html Update in Copenhagen diagnosis: http://www.copenhagendiagnosis.org/ chapter Extreme events (page 15) -
Measuring Earth's energy imbalance
For everyone's general amusement: George White, aka co2isnotevil, has now posted his theories on Jonova. Previously he hijacked the Lindzen and Choi thread here, which got to ~450 comments before he got consistently moderated for being off-topic. These theories include some very odd numbers for energy budgets (compared to Trenberth 2009), stating that a 3.7 W/m^2 TOA forcing for doubling CO2 is halved, as CO2 radiates in all directions, etc. Sigh. This discussion feels like a Whack-a-Mole game sometimes. -
DSL at 08:16 AM on 13 January 2011It's freaking cold!
HH: a local account. If you live in the U.S. or Europe and find it's been a chilly winter, move north. -
Rovinpiper at 08:11 AM on 13 January 2011Climate cherry pickers: Falling humidity
Can the amounts of dust in different layers of an ice core be used as a proxy for humidity? I was reading in Mark Bowen's book Censoring Science about the Vostok ice core. It says, "Methane, like carbon dioxide, rose and fell with temperature, whereas dust tended to go the other way. This made sense, as methane and carbon dioxide levels fell and the air cooled, it would have lost water vapor through feedback and become drier and more dusty." Yet, I also recall reading in a US Army Southwest Asia (Middle East) manual that as the temperature increases in summer the soil dries. Without water to hold it down dust goes into the air. So in that case warmer air is dustier. How can we be sure that increased levels of dust in layers of an ice core indicate lower humidity? -
DSL at 08:08 AM on 13 January 2011Could global warming be caused by natural cycles?
Phila, but then a balloon filled with water will also drop to the floor. Therefore water and CO2 weigh the same. Yet I see water in the upper troposphere. This, then, can only be a proof of the existence of God: clouds are a miracle. -
Gordon1368 at 07:51 AM on 13 January 2011Could global warming be caused by natural cycles?
Oh, and yes, I am alarmed. But I am not an "alarmist." It is not my religion, it is not my ideology, it is not a matter of blind faith to me at all, and I am offended by the attempt to belittle the solid scientific arguments that describe what is happening in the world today. My alarm stems from daily observation of situations such as the rapidly declining Arctic sea ice over the past few years, careful reading of the arguments on both sides, and concern for my children and grandchildren. -
muoncounter at 07:46 AM on 13 January 2011The Queensland floods
#31: "extreme weather events to become more extreme and more frequent under global warming" Don't you just hate it when reality starts showing that you're right? See the extreme weather thread for additional examples. From Allan and Soden 2008 : Climate models suggest that extreme precipitation events will become more common in an anthropogenically warmed climate. ... the observed amplification of rainfall extremes is found to be larger than that predicted by models, implying that projections of future changes in rainfall extremes in response to anthropogenic global warming may be underestimated. -- emphasis added And now its personal: Global warming: the impact on global coffee --as temperatures rise, coffee will ripen more quickly, leading to a fall in quality. --as temperatures rise over the lower lying areas, coffee yields will be adversely affected. -
Gordon1368 at 07:37 AM on 13 January 2011Could global warming be caused by natural cycles?
@ apirate: I see no point to your exercise, we are where we are, and knowledgeable professional scientists in many different disciplines, conducting research along different lines, in competing institutions, in competing nations, agree on the cause. Your question is no doubt answered very well on other threads in this blog, it really is up to you to find it. I really mean that, I am tired of seeing the contributors to this site having to repeat the same things time after time after time, because people come here with a "prove it to me" attitude. No. You just be willing to put your position on record for your grandchildren, so they will know why no action was taken to prevent excessive warming when it might have been. And if you say, "I'm just trying to learn," then take the time to review this whole site for yourself. Further, your use of the term 'alarmist' reveals your point of view in an unpleasant manner. -
David Horton at 07:30 AM on 13 January 2011The Queensland floods
I have said elsewhere, and been criticised for, the idea that intuitively you would expect these extreme weather events to become more extreme and more frequent under global warming. Observation seems to be bearing this out (with each new event met with a chorus by the deniers - ha, you can't say this was caused by global warming, a process which effectively removes all events from being recognised as symptoms). It seems to me that if you have more heat in air and ocean, you have more energy to drive weather events, including the SOI system. If you have more water vapour in one place you get more rain or snow, depending, and you get less moisture in another place. Also seems to me that as we watch the average temperature graph head steadily upwards, we are also seeing the variation around that mean head steadily upwards as well, that is "warm events" are getting warmer, "cold events" are getting warmer. So droughts get exacerbated, so do rain events, depending on the geography of where you are. Criticism anyone? Would be good to hear from those who know more about the climatology of this than I do. Perhaps a separate topic John? -
Bibliovermis at 07:29 AM on 13 January 2011Could global warming be caused by natural cycles?
This point is addressed in the intermediate section of argument #5 "Models are unreliable". -
Could global warming be caused by natural cycles?
apiratelooksat50 - There's a good posting on that here, on Should The Earth Be Cooling. Short answer - somewhere around 0.6-0.8°C cooler than it is now. -
scaddenp at 07:28 AM on 13 January 2011Could global warming be caused by natural cycles?
About 0.8C cooler. Not quite sure what your point is here. All the natural cycles still operate but with a sharp GHG forcing imposed over the top. -
apiratelooksat50 at 07:16 AM on 13 January 2011Could global warming be caused by natural cycles?
Let's propose for a moment that humans never evolved and never made the technological advancements that allowed them to use fossil fuels to power their society. We have a lot of data that is reasonable agreed upon by alarmists and deniers about historical climate and rises and fall in temperatures, ice, CO2, etc... Take away our 150 years of fossil fuel using, atmospheric CO2 injecting society, and where would the planet be? -
Marco at 07:10 AM on 13 January 2011Could global warming be caused by natural cycles?
And those claiming "more CO2 = more pressure" might want to check the change in oxygen. For every molecule of CO2 extra in the atmosphere, we are 'losing' three molecules of oxygen. -
scaddenp at 06:54 AM on 13 January 2011The Physical Chemistry of Carbon Dioxide Absorption
RW1 - the calcuations of radiative forcings at TOA (actually at tropopause if you look at precise definition in TAR) is so that you can do simple arithmetic on forcings like GHG, land use change, aerosols, solar etc to determine net forcing. So a 3.7W/m2 of forcing is calculated so it is equivalent to say 3.7W/m2 of solar forcing. To convert roughly to surface energy, then I believe you simply make geometric conversion for surface area of earth surface cf surface area of sphere at tropopause. (ie it will larger than 3.7 at surface). -
scaddenp at 06:42 AM on 13 January 2011The science isn't settled
I am not particularly interested in what the uninformed, incapable think and especially not interested in politically-motivated deception. That said, I figure that I would hear of any significant papers that challenge the consensus from Roy Spencer, and also take note of opinions of Peikle Snr (not Jr) though its debatable whether you would call him a skeptic. Lucia's "The Blackboard" is interesting also. You can safely assume commentary that is based on papers that are not published (or published in E&E) then I am not going to take much notice of. -
muoncounter at 06:41 AM on 13 January 2011It's cooling
#105: Cherry-picking again, Yooper? + Northern Hemisphere combined global land and ocean surface temperature was the warmest year on record, at 0.73°C + global land surface temperature for 2010 tied with 2005 as the second warmest on record, at 0.96°C + global ocean surface temperature for 2010 tied with 2005 as the third warmest on record, at 0.49°C --All anomalies quoted are above 20th century average. See how the full story is much cooler. Some will say: no warming since 2005! GW is so over. -
RW1 at 06:38 AM on 13 January 2011The Physical Chemistry of Carbon Dioxide Absorption
The Ohio State university slide is black and white, so I cannot determine from it any overlap. H20 absorbs to some degree throughout the entire spectrum of the Planck distribution, and has very strong absorption in the main CO2 absorbing bands around 15u. -
RW1 at 06:22 AM on 13 January 2011The Physical Chemistry of Carbon Dioxide Absorption
It's a simple question. How much total additional surface power is absorbed from a doubling of CO2? -
hfranzen at 06:06 AM on 13 January 2011The Physical Chemistry of Carbon Dioxide Absorption
Reponse to #50: I do not undertstand why our numbers differ so greatly- I calculate that the increase in temperature over 100 years for the Keeling curve ppm is 1.4 K and that this corresponds to an increased GHG effect of 7.4 w/sq.m. (this comes from taking the ratio of the fluxes to be the fourth power of the ratio of the temperatures). The number I get for a doubling of ppm CO2 is an increase of 9.5 W/sq. m. That is, using the 100 years hence number: (1+1.4/288) is 1.0049 and the fourth power of this is 1.02 i.e. the outgoing Planck flux when the temperature increases from 288 to 289.4 will increase by 2%.The current outgoing flux is 390 w/sq.m. and 2% of 390 is 7.4 w/sq.m. Do you see anything wrong with this? Why do our numbers differ so greatly? -
dmyerson at 05:38 AM on 13 January 2011The Queensland floods
The Toowoomba video has gotten wide coverage on US news reports. Seeing the longer version here, I was amazed to hear some of the folks wondering whether they should move their cars. Wasn't it obvious? Anyway, as to the attribution issue, the greater amount of moisture is not the only possible AGW impact. There is an hypothesis about AGW-caused pressure altitudes making blocking events stronger and longer-lasting, which could make some weather systems more intense. I don't know if this applies to your flooding season or not, and I've read that many climate scientists are skeptical of this hypothesis. But it is out there as a potential way to make actual cause-and-effect claims for intensification of individual weather events. Some details at http://www.weather.com/blog/weather/8_20427.html. The author is working on a submission to a peer review journal. -
archiesteel at 05:33 AM on 13 January 2011Could global warming be caused by natural cycles?
@13MPG: Why do you focus on the US and Europe? We are talking about *global* warming. Here in Montreal it's the second very mild winter in a row. If you look at global numbers, 2010 is among the hottest years on record. Stop cherry-picking, please. As for CO2 "sinking", that shows a profound misunderstanding of atmospheric dynamics. Even for an "amateur climatologist," that is pretty misinformed.
Prev 1990 1991 1992 1993 1994 1995 1996 1997 1998 1999 2000 2001 2002 2003 2004 2005 Next


