


 Arguments


Recent Comments
Prev 2017 2018 2019 2020 2021 2022 2023 2024 2025 2026 2027 2028 2029 2030 2031 2032 Next
Comments 101201 to 101250:
-
RSVP at 19:51 PM on 28 December 2010Stratospheric Cooling and Tropospheric Warming - Revised
KR #89 "The box now receives 100W, but only emits 95W " KR #90 "please do not introduce strawmen." Unless there is some place for the energy to go, it is not clear how the box can emit anything. I have no intention (or need) to introduce strawmen, as in fact the discussion started with the following.... An earlier post of mine #85 "Consider a cylindrical thermos container with a double plated glass on one end...I assume you would agree that in pointing an IR detector at the glass (from outside the cylinder), " All this goes back to the "double duty" comments on this thread. The idea that it normally takes energy to raise something's temperature, coupled with the idea that you cant normally create energy, and that when you consider a surface plus a gas, you are talking about more things, not less things. So any IR energy from the surface responsible for heating a GHG, is lost from the surface. Whether an IR energy packet gets picked up by a GHG or reaches outer space is indifferent to the surface. It looses this energy the same. And in taking a step backwards and considering the entire "system" that includes both fluids and solids, the same energy from the Sun is now simply more dispersed if more of it is retained in the fluid part. Overall, it would appear there is more ways for the energy to escape, not less. However, if this represents slightly higher transient atmospheric temperatures during the day, it also represents slightly lower surface temperatures in kind... and I will grant that the surface cooling is also tempered by the backradiation you are talking about, which will normally be much much less than what is emited by the surface. -
scaddenp at 18:23 PM on 28 December 2010Lindzen and Choi find low climate sensitivity
RW1 - how did you think it was calculated? There are empirical constraints on sensitivity, but the numbers come from running the physics and seeing what the number comes out to be. Actually, the mean is 3.2C, not sure where you get 3.7. Its an output of model, global average of the temperature that accompanies model run with a doubling of CO2. To see "how it pans out", see the various model estimates but read that section of the IPCC report to understand why they vary. Milankovich cycles are always operating, but the point of my explanation was to show that you cannot ignore spatial distribution of forcing in calculating feedback. True for Milankovich, true for CO2. I dont understand your comment about sun being "only source of energy in the system". Any suggesting otherwise? GHG are about impediments to surface radiative efficiency and changes to surface temperature. -
batsvensson at 18:03 PM on 28 December 2010Is it safe to double atmospheric Carbon Dioxide over a 200 year period?
Just to pick one flawed argument from the OP: "While the skeptics [...] can not produce a set of key papers which demonstrate that doubling atmospheric chemistry has no significant effect on the climate system." This is indeed true, nor have the skeptic publish a paper which demonstrate that the ears of the global warming camp has no significant effect on the climate system. But should a precaution principle make us cut them off anyway? I don't think so. - It seams to me that the aim of this article is not to present a objective scientific picture but to paint up all skeptical people as being a minority with lunatics ideas. If what you wrote you really believe in then I can understand why you think as you do. Unfortunately what you believe is far for the truth and even more unreachable is the idea of coming to an understanding in each others way of thinking. -
co2isnotevil at 16:45 PM on 28 December 2010Lindzen and Choi find low climate sensitivity
KR, Yes, I understand there are many time constants, but the one that matters, relative to the measured response, is that which quantifies the response of the thermal mass of the planet. Also, the 25 years of data I used was to extract the response, from which the consequence of a change can be predicted and is not constrained by your requirement of 25-30 years to ascertain a trend, even though the data set is long enough. In this case, extending the data set results in the inclusion of the longer term effects as they affect the response. The response to a linear change can also be extracted from the LTI by setting the forcing function to a ramp from which the steady state solution can be solved. -
RW1 at 16:21 PM on 28 December 2010Lindzen and Choi find low climate sensitivity
scaddenp, "It doesnt, I agree, but as I said, 1W/m2 as global annual average has a very different temporal, spatial and spectral distribution for sun versus CO2. The direct radiative balance is obviously maintained but to consider a simplification, 1W/m2 could by say 2W/m2 in one hemisphere and 0 in the other. The temperature response for radiative balance is 0.6 in one hemisphere, 0 in the other still for global average of 0.3." The radiative forcing of 3.7 W/m^2 from a doubling of CO2 is a global average just like average solar input is. How do you think each is calculated? Are you forgetting that the Sun is pretty much the only source of energy in the system? "Sensitivity it about feedbacks though. The milankovich forcing driving the ice age cycle is tiny as global average, but the large forcing at 65N over long time delivers feedbacks enough to drive the cycle. The identical forcing at 65S does not - far less scope for feedbacks in the south." We're not due for another Milankovitch cycle for long time. Plus, it's mainly the change in the distribution of the energy from the Sun that is apparently enough to overcome what appears to be a very strong net negative feedback operating on the system. "You have to run the physics and see how it pans out." OK, run "the physics" and show us how it pans out. -
muoncounter at 16:19 PM on 28 December 2010Lindzen and Choi find low climate sensitivity
#422: "A*exp(-t/tau)," Nope, that's exponential decay to 0. What you want is y=A(1-e^(-t/tau)), which asymptotes to A. "climate system responds slower than seasonal change. This is clearly wrong because if it was the case, seasonal change would not happen!" Mistaking weather (seasonal, small tau) for climate (multi-year, long tau)? So climate systems do indded respond more slowly than seasonal changes, as KR demonstrates in #423. That's why seasons aren't climate. -
Daniel Bailey at 15:47 PM on 28 December 2010Species extinctions happening before our eyes
nofreewind last posted on October 10th. His "rebuttal" on August 16th did not pass moderation, probably because it was lame and uninspired. Been running silent, running deep since... The Yooper -
scaddenp at 15:29 PM on 28 December 2010Lindzen and Choi find low climate sensitivity
RW1 - your references to "Power" (Not), "gain" suggest you are using an electrical analogy - this is not helping you. -
scaddenp at 15:26 PM on 28 December 2010Lindzen and Choi find low climate sensitivity
Rw1 - sorry for taking a long time to respond but only intermittent access to internet. "Explain to me how the surface, whose temperature is directly tied to the total power flux via Stefan-Boltzman, is going to 'know' the difference from increased power from Sun or CO2?" It doesnt, I agree, but as I said, 1W/m2 as global annual average has a very different temporal, spatial and spectral distribution for sun versus CO2. The direct radiative balance is obviously maintained but to consider a simplification, 1W/m2 could by say 2W/m2 in one hemisphere and 0 in the other. The temperature response for radiative balance is 0.6 in one hemisphere, 0 in the other still for global average of 0.3. Sensitivity it about feedbacks though. The milankovich forcing driving the ice age cycle is tiny as global average, but the large forcing at 65N over long time delivers feedbacks enough to drive the cycle. The identical forcing at 65S does not - far less scope for feedbacks in the south. You cant do the sensitivity by back-of-the-envelope stuff. You have to run the physics and see how it pans out. -
Lindzen and Choi find low climate sensitivity
co2isnotevil - An additional note on these various forcings and feedbacks: Statistical significance in temperature measurements requires 25-30 years of temperature records to establish a trend, based on the inherent variability of weather (PDO, AO, other influences, clouds, volcanoes, etc.). Your delayed sinusoid feedback responses to cyclic forcings of one year cyclic duration will be completely lost in the noise of the climate. Longer term changes such as CO2 increases and Milankovitch cycles will not. -
Lindzen and Choi find low climate sensitivity
co2isnotevil - In regards to climate sensitivity, please keep in mind that there is not a single 'climate response' with a particular time constant - there are many. Climate response tau's: - Air temperature: hours - Water vapor: week(s) - Northern/Southern temperate snowfall/albedo: months - Ocean surface temperature: weeks/months - Arctic ice cap size: Year plus - Vegetation albedo: Years due to species spread - Greenland ice cap size: 10's of years - Glaciers: Years to 10's of years - Antarctic ice cap: 10's of years plus? - Deep ocean temperature: Decades? Still under investigation - CO2 ocean sequestration/release: months to 100's of years depending on depth. - CO2 rock weathering: 10,000 years plus Yes, for each of these, there will be either a direct response to a sinusoidal forcing cycle (seasons or orbital distance) or, if the forcing is shorter than the response time, a delayed sinusoid - with amplitude decreasing as the response becomes more multiples of the forcing. Note that these responses for different feedbacks will likely not be in reinforcing phase, and may cancel out/reinforce from time to time. On the other hand, a steadily changing trend (such as CO2 forcing) will not cause a sinusoidal response in feedback, but a driven change in the baseline (with weather variability making it non-monotonic). And that's what we see on all of these feedbacks for the CO2 forcing, as evidenced by the temperature record and other data. Cyclic changes don't move the baseline. Non-cyclic changes such our CO2 output do. -
co2isnotevil at 14:48 PM on 28 December 2010Lindzen and Choi find low climate sensitivity
Chris, The exponential approach to equilibrium is quantified as A*exp(-t/tau), where tau is the time constant, A is the equilibrium value and t is time. Exp(-1) is about 0.37 and 5 time constants, exp(-5), is greater than 0.99. This form of approach to equilibrium arises as the solution to the first order LTI describing the thermodynamic climate system. The related response to a sinusoidal stimulus like exp(-jwt) is a delayed sinusoid whose delay is equal to the time constant for periods larger than 4 or 5 time constants. If we filter the ISCCP data to only those grids over ocean, there is still 1.5C or more yearly variability globally and more than 4C hemispheric specific temperature variability. Equatorial water temperatures are relatively constant, so there is little to no flux between the 2 hemispheres and hemispheric specific heating and cooling tells us exactly how big the planets thermal mass is on a per hemisphere basis. You state that the climate system responds slower than seasonal change. This is clearly wrong because if it was the case, seasonal change would not happen! Just like a capacitor resists a change in voltage, a thermal mass resists a change in temperature and the equations describing this response are nearly identical and the time constants have the same physical significance. Venus has the property you claim relative to the surface, but this is because it's thermal mass is energized CO2 above the surface, while the Earth's thermal mass is primarily ground state water below the surface. While the Venusian 3 degree axis (177 accounting for retrograde rotation) is less than ours, there are no seasonal differences at the surface or even differences across latitudes. There are not even differences between night and day even though the Venusian day is about as long as our year. This is what you would expect from a system with a time constant on the order of years to decades. The Earth behaves in a manner consistent with a short time constant. Regarding the amount of ice that would need to melt to cause a 3C rise, all else being equal, nearly half of the difference between the min and max seasonal snow pack would need to melt. There's just not this much additional ice to melt during the summer! This arises as the incremental reflectivity from the full winter snow pack has about an 7C effect on the surface temperature. This is why the global average temperature in January is 3C cooler, rather than 4C warmer as the increased insolation at perihelion would suggest. This all works out quite nicely when you consider the measured reflectivity variability seen in the ISCCP data. -
citizenschallenge at 14:48 PM on 28 December 2010Species extinctions happening before our eyes
nofreewind... hello? i was really curious to hear his come back... hmmm -
muoncounter at 14:24 PM on 28 December 2010The Scientific Guide to Global Warming Skepticism
#45: "Cosmic rays seem to be one of those factors" Eric, I'd love for you to fully explain how that actually works (not how it could work or might work). But it belongs here. -
Eric (skeptic) at 13:57 PM on 28 December 2010The Scientific Guide to Global Warming Skepticism
nealjking, I'm not looking for alternative causes for global warming, but I am trying to identify the factors involved in the amplification of CO2 warming. Cosmic rays seem to be one of those factors but there are others. -
archiesteel at 13:57 PM on 28 December 2010Lindzen and Choi find low climate sensitivity
@RW1: "Are you going to argue that the physics of the oceans are different globally then they are hemispherically?" Strawman argument fallacy. That is not at all what Chris is arguing. What he's saying is that, because seasonal changes happen in a relatively rapid cycle (and are balanced between the hemispheres, one being warmer while the other one is cooler), there is not much feedback to the forcing. With CO2, however, the increase is gradual, over decades, which triggers feedbacks that are little affected by seasonal change. Even the direct effect of CO2 is delayed compared to the direct energy transfer caused by insolation. CO2-induced warming takes longer as energy travels back an forth between the GG molecules and the ground. All these comments, and neither RW1 or co2isnotevil (true, it isn't, but increasing it is warming our world) have managed to present a convincing case against a climate sensitivity of 3C. -
RW1 at 13:35 PM on 28 December 2010Lindzen and Choi find low climate sensitivity
chris, "However the orbital properties of the Earth aren't very relevant to persistent changes in forcings that are fundamental to determination of climate sensitivities. That's because the orbitally-paced sinusoidal insolation occurs more rapidly than the various elements of the climate system can equilibrate with the changing forcings, and thus average out on time scales relevant to establishing the Earth's equilibrium response to forcing." Who is claiming the changing seasonal hemispheric and orbital changing forcings don't average out? They do. The point is that as the forcings change, the climate responds fairly quickly via a significant change in air and ocean water temperature. Are you going to argue that the physics of the oceans are different globally then they are hemispherically? If so, under what law of thermodynamics do smaller, slower increases in thermal forcing take longer than larger, faster increases in thermal forcing to raise the temperature of water to equilibrium? -
chris at 13:15 PM on 28 December 2010Lindzen and Choi find low climate sensitivity
co2isnotevil at 12:42 PM on 28 December, 2010"...For example, there is no monotonic trend corresponding to the CO2 trend in the temperature data..."
Why should one expect such a thing co2isotevil? Attribution of warming trends requires an effort at a realistic assessment of all the contributions to temporal changes in surface temperature. This has been done in detail by scientists. Some useful examples are Lean and Rind (2008) and Hansen et al (2005). -
chris at 13:10 PM on 28 December 2010Lindzen and Choi find low climate sensitivity
co2isnotevil at 12:37 PM on 28 December, 2010"I also suggest you review a little about control theory, time constants and how they operate. If the planet was as sluggish as you claim, then how do you explain the global temperature changing by over 3C during a 12 month period? A time constant of 7.5 years says that it takes 7.5 years for 37% of the equilibrium change to occur. Do you not believe that the Sun forces the climate? How can you even explain seasonal change?"
(i) Note that the time constant is the time for ~63% (1-1/e) of the equilibrium response to be achieved (not 37%). (ii) The global temperature changes seasonally due to the large excess of N. hemisphere land compared to the S. hemisphere and the lower heat capacity of land compared to ocean. In other words one of the more rapid elements of the climate system (land warming) dominates when the N hemisphere is tilted towards the sun even although this occurs during the short period that the Earth moves to and from aphelion. Temperature changes of the vast S. hemisphere oceans occur much more slowly than N hemisphere land. (ii) The seasonal changes result from varying insolation patterns (with a lesser effect from the change in surface solar irradiance due to orbital eccentricity). (iv) this is all obvious. Clearly if the Earth were to come to a grinding stop in its orbit at aphelion and sit there rotating as normal, the N. hemisphere would warm further. However the orbital properties of the Earth aren't very relevant to persistent changes in forcings that are fundamental to determination of climate sensitivities. That's because the orbitally-paced sinusoidal insolation occurs more rapidly than the various elements of the climate system can equilibrate with the changing forcings, and thus average out on time scales relevant to establishing the Earth's equilibrium response to forcing."...intrinsic 0.5C or so from doubling CO2 will melt enough ice to affect a 3C global temperature rise..."
That's just argumentation co2isnotevil. To establish the physical response requires an effort at rigorous analysis. The intrinsic response to a forcing equivalent to a doubling of atmospheric [CO2] is of the order of 1 oC and then one needs to factor in the water vapour feedback (lots of evidence that this is positive and rather significant) and land and sea ice melt. There is a vast science on this (e.g. check to loink in post 413). One of the essential problems that you and RW1 have failed to address is the empirical evidence that the Earth's climate sensitivity is very unlikely to be below 2 oC (as explained, for example, here, and here, and here and here) -
nealjking at 13:01 PM on 28 December 2010The Scientific Guide to Global Warming Skepticism
39, Eric: If you're interested in finding out the truth, you have to argue TO THE POINT, not just to avoid the point. Looking for a causal basis for global warming in cosmic rays is a lost cause. -
co2isnotevil at 12:42 PM on 28 December 2010Lindzen and Choi find low climate sensitivity
I agree with Chris that deleting those comments is counter productive to the thread. The response time of the climate system is intimately related to the sensitivity. High sensitivities are claimed only when then can also claim that the affect is deferred decades into the future because we can't discern from the data what current CO2 concentrations are supposed to have done. For example, there is no monotonic trend corresponding to the CO2 trend in the temperature data. -
co2isnotevil at 12:37 PM on 28 December 2010Lindzen and Choi find low climate sensitivity
Chris, No. L&C do not treat the tropics as a closed system. They treat it as part of a closed system whose specific behavior is linked to the behavior of the whole. Besides, the specific complaint was that the coverage was only between -20 and 20 degrees latitude and not that they were treating that region as a closed system. Have you even looked at full coverage surface temperature reconstructions? Consider the ISCCP reconstruction which is exactly as you claim. Here is the monthly global temperature plot. You might notice the spike around 10/01 which was caused when the transition from NOAA-14 to NOAA-16 didn't fit within the ability of Rossow's code to properly adapt and the baseline shifted. I pointed this out more than 3 years ago and while Rossow acknowledged the error privately, it has yet to appear in the formal errata and this is a bigger error than anything else reported. Here is the same reconstruction with 5 year averaging applied. In both plots, the red is the monthly temperature and the black dotted line is the running 12 month average of the red line. Notice how when 5 year averaging is applied a 1 month data anomaly suddenly appears as a multi year temperature trend? This shows the same data where the baseline has been corrected and this shows corrected data with 5 year averaging. Hmm. It seems that Hansen's data is showing a cooling trend? How odd ,,, I also suggest you review a little about control theory, time constants and how they operate. If the planet was as sluggish as you claim, then how do you explain the global temperature changing by over 3C during a 12 month period? A time constant of 7.5 years says that it takes 7.5 years for 37% of the equilibrium change to occur. Do you not believe that the Sun forces the climate? How can you even explain seasonal change? The ebb and flow of glacial ice works on a somewhat larger scale, but if you're seriously trying to claim that the intrinsic 0.5C or so from doubling CO2 will melt enough ice to affect a 3C global temperature rise, you better go back and run your numbers again. Even your inflated 1.1C intrinsic effect is not enough. We are pretty close to minimum ice, as we are during every interglacial epoch, and as such, there is not enough ice to melt and cause your hypothetical 3C rise. Ice related feedback is a clamped effect and you can't equate the effects of ice melting as we are leaving maximum ice with those with ice melting when we are already at minimum ice. -
wingding at 12:36 PM on 28 December 2010Did Global Warming stop in
1998,1995,2002,2007, 2010?
I also expect another stepwise jump over the next few years. The following graph is very sloppy. I only use it as a kind of sketch to easier convey why I think a stepwise jump is imminent. The red line is HadCRUT3. The green line is just an arbitrary "background warming" curve (just to be able to say "hey even a curve fits this data"). The purple line is ENSO (MEI index). The orange line is sunspot number. The gray line is volcanic forcing taken from the modelE data file. The blue line is all the previous lines added together and doing that matches up with HadCRUT quite well. If I leave out the solar cycle I get a much worse fit. I have the scalings all written down and I update it every few months - the graph below goes up to November (except the HadCRUT3 red line which only goes up to October)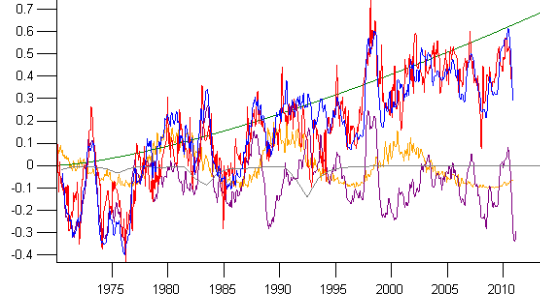 From this you can see that what skeptics call "global warming stopping", ie the flat period since about 2002 is actually compatible with a background warming of about 0.15C during this period that's pretty well all canceled out by the negative ENSO and solar trend.
To stall the warming indefinitely solar output and ENSO would have to keep declining. But they are both pretty well bottomed out now, in fact more likely than not over the next few years both ENSO and the solar cycle will contribute positively, therefore far from negating the longterm warming trend they are going to supplement it. Which is why I think a step change is already underway in global temperature. Although thanks to ENSO noise it will take perhaps a few years to be able to look back on the record and identify a step change has occurred.
From this you can see that what skeptics call "global warming stopping", ie the flat period since about 2002 is actually compatible with a background warming of about 0.15C during this period that's pretty well all canceled out by the negative ENSO and solar trend.
To stall the warming indefinitely solar output and ENSO would have to keep declining. But they are both pretty well bottomed out now, in fact more likely than not over the next few years both ENSO and the solar cycle will contribute positively, therefore far from negating the longterm warming trend they are going to supplement it. Which is why I think a step change is already underway in global temperature. Although thanks to ENSO noise it will take perhaps a few years to be able to look back on the record and identify a step change has occurred.
-
chris at 12:35 PM on 28 December 2010Lindzen and Choi find low climate sensitivity
It's unfortunate that a moderator has deleted the last two comments (co2isnotevil's and mine) since these get right to the crux of the issue. It's directly relevant to the Lindzen and Choi analysis and to all attempts to establish equilibrium Earth response climate sensitivity by analysis of transient responses to forcings. I'll post the relevant bit of my deleted post. If the moderator considers this non-relevant (discussion of climate response times to forcing) then something's badly amiss!co2isnotevil: "The Earth responds far more quickly to changes in forcing than you think."
Yes, it responds immediately to changes in forcing. However in establishing the climate sensitivity we are interested in the response when the system has come to equilibrium with the forcing. This is a fundamental error that your website and RW1 are simply not addressing.co2isnotevil: "The climate system's time constant is on the order of 2 months"
That's horribly incorrect. Even the most generous models of Earth climate response to forcing arrive at a time constant [time for the response to achieve (1-1/e)-fold magnitude of its equilibrium response] of around 7.5 years (see discussion here here, for example). Of course there are several time constants of relevance (the atmosphere responds faster than the land surface which responds faster than the ocean surface...the response of the deep oceans is very slow indeed). It's very easy to see that this must be the case, and must be considered for determination of the climate sensitivity. The sea and mountain ice response to warming is a significant part of the climate sensitivity. As sea and land melts in a warming world the Earth albedo reduces. It's not possible to maintain the ludicrous notion that this response comes to equilibrium with a time constant of 2 months! Try 20 or 30 years (and maybe 100-1000 years for polar ice.... -
RW1 at 12:31 PM on 28 December 2010Lindzen and Choi find low climate sensitivity
chris, Would you consider a pot of water at thermal equilibrium on the stove with the burner underneath at a fixed setting as being analogous to the oceans of the Earth (the water in the pot) and the current amount of average radiative forcing acting on them (the burner underneath)? -
chris at 11:51 AM on 28 December 2010Lindzen and Choi find low climate sensitivity
co2isnotevil at 11:12 AM on 28 December, 2010 There is an inherent illogic in your attempt to equate: (i) the very specific flaw (of Lindzen and Choi) of attempting to treat the tropics as a closed system for attempting to assess readiative flux responses to changes in surface temperature (when the flows of energy to higher latitudes dominate outgoing (space-directed) energy flows by factors of 10-fold)... and: (ii) the fact that Earth temperature measures are sampled at discrete points on the surface. A physicist should really be able to spot the logical flaw! In selecting to analyze data covering only the tropics (20o N to 20o S) Lindzen and Choi omit not only the massive bulk of the Earth's surface, but the regions of the Earth to which massive flows of solar energy insolating the tropics flow to higher latitudes in the shape of air and sea currents. Note that you are ignoring the particularly dismal flaw of Lindzen and Choi which is the cherry-picking of periods of temperature change (see top article above). As a scientist you really should be appalled at the level of false analysis. On the other hand the Earth temperature measurements sample virtually the entire world (with only the Arctic and Antarctic poorly sampled) and there is a huge body of evidence that: (i) the Earth surface temperature measurement is robust to at least 5 independent analyses (by teams in the US, UK, Japan and Europe), (ii) the Earth surface temperature is robust to large reduction of temperature stations (e.g. the US temperature data is hardly changed when selecting a small subselection of what a climate contarian group have asserted are the "good" set of stations by their own criteria). In other words the Earth surface temperature is over-determined and the reason for this is quite well established (it relates to the well-characterized observation of the spatial correlation of surface temperature anomalies over distances of several hundreds of kilometres). etc. -
villabolo at 11:24 AM on 28 December 2010Did Global Warming stop in
1998,1995,2002,2007, 2010?
Those green and pink lines are interesting and disturbing, haven't seen that kind of analysis of the El Nino/La Nina contrasts before. The current La NIna, in Australia at least, seems to be an especially strong one, with record rainfall events and record flooding all over the place. Is this perhaps the start of another "jump" in La Nina events, to be followed, by the look of that graph, by a particular severe El Nino and a new level for those horrific (in Australia at least) events? Sorry for my late response. I know that 31 years is a short time to be making any dramatic predictions based on a graph alone, but we had a similar jump in temperatures around 1976 and yes, we seem to be on the verge of another one. That would make this our third stepwise "jump". The way things are going, only a few more years (In the context of the past 35 years.) should tell us that this is a certain trend. There are other more disturbing trends that threaten to throw a monkey wrench into our climate but that would take us off subject again. -
chris at 11:16 AM on 28 December 2010Lindzen and Choi find low climate sensitivity
RW1 at 10:26 AM on 28 December, 2010”Why is the Lindzen and Choi resulting sensitivity consistent with how each 1 W/m^2 of power from the Sun is treated at the surface, but the IPCC models that predict a 3 C sensitivity are not?” The answer is that Lindzen and Choi chose to make an erroneous analysis that gave them a result that they wittingly, or unwittingly, were aiming for. There are virtually an infinite number of ways of obtaining a false result in science RW1. Lindzen and Choi’s analysis is simply wrong as has been well established by several groups of atmospheric physicists (and see account in the introductory description of this thread): Chung ES, Yeomans D, Soden BJ (2010) An assessment of climate feedback processes using satellite observations of clear-sky OLR Geophys. Res. Lett. 37, art # L02702 abstract Murphy DM (2010) Constraining climate sensitivity with linear fits to outgoing radiation Geophys. Res. Lett. 37, art # L09704 abstract Trenberth KE, Fasullo JT, O'Dell C, et al. (2010) Relationships between tropical sea surface temperature and top-of-atmosphere radiation Geophys. Res. Lett. 37, art # L03702 abstract Chung ES, Soden BJ, Sohn BJ (2010) Revisiting the determination of climate sensitivity from relationships between surface temperature and radiative fluxes Geophys. Res. Lett. 37, art # L10703 abstract So you're really asking the wrong questions RW1. You should be pondering: (i) Why do people chose to believe analyses that are clearly and objectively flawed? (ii) How can one seriously maintain allegiance to an analysis of Earth climate sensitivity that is woefully inconsistent with straightforward empirical evidence? Remember that Lindzen’s, and the flawed analysis of the website from which you have sourced your analysis, come up with a climate sensitivity (~0.6 oC of Earth surface warming for a radiative forcing equivalent to a doubling of atmospheric [CO2]?) that is simply at odds with a vast body of empirical analysis, as explained here, and here, and here and here. (iii) How can one possibly obtain a realistic estimate of the Earth climate sensitivity (the Earth surface temperature response at equilibrium resulting from a radiative forcing equivalent to a doubling of atmospheric [CO2]), from transient temperature responses to transient variations in forcing (seasonal variations in forcing resulting from the earth’s rapid passage around the sun)? (iv) why would one raise a false argument that "the IPCC models that predict a 3 C sensitivity are not" consistent with empirical observations, when the models (they're not "IPCC models, RW1, but the models of a large body of physicists) are clearly entirely consistent with empirical observations (e.g. 20th century warming) as indicated in the links in (i) above)? -
co2isnotevil at 11:12 AM on 28 December 2010Lindzen and Choi find low climate sensitivity
The Chung et all paper is not freely available, but based on the abstract, it makes a very weak case by trying to connect the radiative dampening rate with positive feedback. The issue with the temperature measurements is homogenization (Hansen Lebedeff 1987) which incorrectly justifies the use of a very small sample set to discern trends, which tends to encourage cherry picking. My point is that none of the surface temperature reconstructions which predict large sensitivities or large warming cover more than about 1% of the planet and interpolate everything else. If you want to complain about the 30% coverage of L&C, you better start complaining about all reconstructions that do not start with 100% coverage. -
Bibliovermis at 10:43 AM on 28 December 2010Is it safe to double atmospheric Carbon Dioxide over a 200 year period?
To address the issue that isn't safe to double the atmospheric CO2 content, we can: A) Do nothing but token measures while continuing Business As Usual. Why bother changing when They might not? B) Kill off 9/10ths of the world's population. C) Use the current available technology and lead the way. If we are still debating whether the atmospheric CO2 level is a concern, lets bring this discussion back on topic. Otherwise, use the search box to find a more appropriate area for discussing what we should do about it. -
RW1 at 10:26 AM on 28 December 2010Lindzen and Choi find low climate sensitivity
Why is the Lindzen and Choi resulting sensitivity consistent with how each 1 W/m^2 of power from the Sun is treated at the surface, but the IPCC models that predict a 3 C sensitivity are not? -
Lindzen and Choi find low climate sensitivity
co2isnotevil, This post also referenced Chung et al. 2010, which used a more global dataset and found that the results were not consistent with Lindzen. In general, the validity of the temperature records is addressed here. -
dhogaza at 10:12 AM on 28 December 2010Is it safe to double atmospheric Carbon Dioxide over a 200 year period?
This is drifting way off topic again ... -
RW1 at 10:11 AM on 28 December 2010Lindzen and Choi find low climate sensitivity
BTW, Does anyone have a link to the updated Lindzen and Choi 2010 paper? I believe the original was criticized for cherry picking data points, but when they re-did in 2010 using "all points" the result was the same. -
steve anthoney at 10:11 AM on 28 December 2010Is it safe to double atmospheric Carbon Dioxide over a 200 year period?
By the way is this site hosted in America ? It's not even 28 Dec here and I've got to go see us thrash the Aussies at cricket on TV soon !! Sorry will speak again soon.Response: This site is run by an Australian and hosted in Australia. Discussion of cricket is banned on this website... when Australia is losing! -
steve anthoney at 10:09 AM on 28 December 2010Is it safe to double atmospheric Carbon Dioxide over a 200 year period?
I wouldn't refuse to change, I try - I've walked to work several times recently, and wear a pullover and turn down the heating. I think changing our lifestyle drastically would help. But.... 1800AD - less than 1 billion people 1900AD - more than 1 billion people 2000AD - 6 billion 2100AD - ??? (i'm thinking it's not linear) Don't deal in cliches, do the math What nations/governments etc "have clearly stated" may not happen. Population is the issue. 300 million people in 1000AD caused no global warming (did they cause the little ice age by not keeping enough cattle to produce enough methane ?) -
otter17 at 10:08 AM on 28 December 2010Debunking this skeptic myth is left as an exercise to the reader
It sounds like the facts are not good enough for this denier, and I have found that to be the case with most deniers I have talked with. I have had better luck appealing to popular figures in the government that work to mitigate climate change, such as the US Navy, Pentagon and John McCain. If the climate change issue is removed from its political "liberal" stereotype and framed as an issue that crosses political boundaries, there is a better chance of getting the point through any mental walls that some people put up. Also, I would reply back to the "I don't trust the direct measurements" with an explanation of how the measuring devices work. These instruments are somewhat abstract to the average person, and a clear explanation of how they work could go a long way to establishing trust in their results. Also, while it may be tempting to poke fun or get frustrated, we must realize that today's deniers may be tomorrow's activists. Back in college, I was in the denier camp, but now I have devoted my career towards engineering renewable solutions. We must remain civil at all times in order not to alienate anybody. Thanks so much for this website. I have been reading for a month or so, and there is a wealth of concise, distilled information here along with some pretty interesting and civil comment discussions. I've donated since this is great work that benefits the world. -
Lindzen and Choi find low climate sensitivity
co2isnotevil - I believe that your objections are met in the topic itself. Lindzen and Choi's sensitivity result has a high dependence on their (arbitrary looking) start/end dates. The tropical region is not (as they seem to have treated it) a closed system, see comments in the header regarding Murphy 2010, where even small changes in tropical/polar heat exchange swamp L&C's results, that global data gives quite different results (Chung 2010), plus the multiple studies from both models and empirical data that contradict L&C's low sensitivity. That "more deterministic homogenization" won't help matters if it's incompleteness introduces errors, which it appears to do. -
co2isnotevil at 09:55 AM on 28 December 2010Lindzen and Choi find low climate sensitivity
To stay on topic, lets address the first paragraph of my first post at #297. Read that and then answer the following questions. Why don't you complain about homogenization techniques applied to a small data set with high uncertainty which predicts a high sensitivity, yet do complain when more deterministic homogenization techniques are applied to a much larger data set with less uncertainty and which predicts a low sensitivity? Are you objecting to the uncertainty in the analysis or are you objecting to the conclusion? -
muoncounter at 09:31 AM on 28 December 2010It's freaking cold!
#64: "... a hard core climate denier in disguise." Yes. That would explain why his name is lighting up the denier blogs with references to his 'climate astrology'. Wait a day or two, there will be an entire denial smear machine dedicated just for him. And I believe the correct form of address is Dr. __ , not Mr. ___, PhD. However, he does seem to have published papers on the relevance of early Siberian snowfall to winter forecasting, a model that has already shown a favorable track record. But then, even astrologers get one right every once in awhile? I'm not at all sure of the point of your latest graph; however, I do recognize that NH snowfall occurs primarily in the winter. As far as this being a negative feedback, it must be a very fast feedback. Surely the model is that increased evaporation from warm bodies of water leads to a wetter winter. Once that water vapor falls out (in this case, as snow), what's left to provide feedback? "it was soot." Yes, I thanked you for the soot reference, as it provided hard evidence that anthropogenic CO2 moves from source to the Arctic. -
Berényi Péter at 08:57 AM on 28 December 2010It's freaking cold!
#64 muoncounter at 03:57 AM on 27 December, 2010 An interesting take on the extreme winter... “As global temperatures have warmed and as Arctic sea ice has melted over the past two and a half decades, more moisture has become available to fall as snow over the continents. So the snow cover across Siberia in the fall has steadily increased. The sun’s energy reflects off the bright white snow and escapes back out to space. As a result, the temperature cools.” Mr. Judah Cohen, Ph.D. of AER (Atmospheric and Environmental Research, Inc.) must be a hard core climate denier in disguise. The mechanism he is describing, to get extreme chill via warming, is a strong negative feedback loop of the finest kind. Anyway, I told you it was soot. "If cooling is hampered (e.g. by carbon dioxide), one would expect snow trend to lag insolation. But it's just the opposite."
(Summer solstice is on week 25, winter solstice is week 51)
"If cooling is hampered (e.g. by carbon dioxide), one would expect snow trend to lag insolation. But it's just the opposite."
(Summer solstice is on week 25, winter solstice is week 51)
-
co2isnotevil at 08:57 AM on 28 December 2010Lindzen and Choi find low climate sensitivity
Eric, The A does not include thermals and latent heat, again, thermals and latent heat only serve to move power around the Earth's thermal mass and do not participate directly in the radiative balance. To the extent that the thermal power emitted by clouds comes from evaporated water, there is a second order connection, but relative to the radiative balance, only radiation matters. In the big picture of the thermodynamic balance of the planet, clouds selectively block surface power such that the power leaving the planet is equal to the power arriving. Relative to the Trentbert picture, thermals and latent heat are returned in his mythical 'back radiation'. This is very misleading as most of the power returned to the surface is kinetic and not radiative. Only photons matter at the boundary between the Earth and space. Why is this so hard to understand?Moderator Response: [muoncounter] This thread is about climate sensitivity as derived in the Lindzen and Choi paper. Further discussion of the specifics of a third party website do not belong here. Please take your continuing conversation regarding how this or that particular are derived elsewhere. -
Eric (skeptic) at 08:52 AM on 28 December 2010Lindzen and Choi find low climate sensitivity
Mr White (co2isnotevil), in your div2 paper you state: "A further constraint of Conservation Of Energy is that the global net non radiative flux between the atmosphere and the surface must be zero in the steady state if the radiative flux is also zero. While radiative flux to and from the surface can be traded off against non radiative flux, it makes no difference to the overall radiative balance." Your prior diagram shows a radiative energy balance that excludes the latent heat and conductive (thermal driven) transfers from the surface to the atmosphere. (it is also missing the solar short wave absorption by the atmosphere). In your statement above you are declaring that the non radiative flux is zero. Can you quantify an atmosphere to surface transfer that is non radiative that balances the latent heat and conductive transfers? Can you also explain how you arrive at A=292 as a fraction of the 385 radiative flux from the surface? Thank you. -
co2isnotevil at 08:45 AM on 28 December 2010Lindzen and Choi find low climate sensitivity
KR, re 393 I suggest that you do some 3-d atmospheric simulations yourself. Start with nominal H20/O3/CH4 and simulate at 280 ppm and 560 ppm of CO2 and see the difference. The incremental absorption is about 3.7 W/m^2 and not 7.4 W/m^2. In a very limited sense the 3.7 W/m^2 represents a reduction in power leaving the top of the troposphere, but it fails to account for the delayed release of the incrementally absorbed power back into space. As I pointed out before, even if the atmosphere absorbed 100%, 50% would still leave the planet. I challenge to you to come up with a terrestrial counter example of this. I already explained why Venus is different. re 396 Do you agree that a thermal is half of a vertical circulation current whose purpose is to redistribute energy within the atmosphere? Do you agree that evaporation/weather is another circulation current operating across both vertical and horizontal directions? If these are important to the radiative balance, then why are oceanic and atmospheric circulation currents not included as well. These serve the same purpose as moving energy around the thermal mass. The fact is that the only effect non radiative energy transfer has on the energy balance is establishing the conditions for clouds to block as much as 1/2 of the surface radiation from leaving the planet. The proportion of clouds then sets the ratio of warm surface emissions and cold cloud emissions such that the radiative balance is maintained. The physical feedback system is controlling the planets energy balance. The hypothetical feedback system proposed by the IPCC controls the surface temperature. This is the source of the disconnect because the boundary conditions and output of the hypothetical feedback system are predetermined by the physical feedback system. The hypothetical system can be forced to look correct at a specific operating point, but is useless for how the system responds to change. -
RW1 at 08:42 AM on 28 December 2010Lindzen and Choi find low climate sensitivity
Eric, I'm not backtracking - I'm clarifying. The 396 W/m^2 power flux at the surface already has factored into it the thermals and latent heat transfer. Without these two processes moving heat away from the surface into the atmosphere, the surface power would be about 493 W/m^2 for a temperature of about 305K. This is what the diagram is depicting. -
Lindzen and Choi find low climate sensitivity
Moderator - Typo in my previous post, "appears to be list" should be "appears to be a list". Sorry for the bad grammar. -
Lindzen and Choi find low climate sensitivity
Aha! I have found that "co2isnotevil" is actually George White (look for 'co2isnotevil'), creator of the http://www.palisad.com/co2 website referred to by RW1. Mr. White, please note my comments about your website in this post, also note that your slide presentation appears to be list of the top 20 skeptic arguments debunked here. My apologies, but I cannot take your comments seriously when you have such misinformation on your web site. -
Bibliovermis at 08:37 AM on 28 December 2010Is it safe to double atmospheric Carbon Dioxide over a 200 year period?
The developing nations do not have to follow the same industrialization path that the developed nations did. They have clearly stated that they will not change for us but with us. Refusing to change because they might not is playing a game of chicken that there is no benefit in winning. Focusing on population growth only delays the inevitable. Population is not the issue; what the population does is. -
Eric (skeptic) at 08:29 AM on 28 December 2010Lindzen and Choi find low climate sensitivity
co2isnotevil you said "The simple fact is that relative to the radiative balance of the planet, only radiation matters" Do you, like RW1 believe that "A" in the div2 diagram accounts for thermals and latent heat transfer or is "A" simply the fraction of 385 being absorbed as shown? If the former, please explain why the thermals and latent transfer are not in the diagram. If the latter, please correct RW1 who said in #370 that "The 396 W/m^2 power flux at the surface already accounts for the thermals and latent heat transfer" and seems to now be backtracking. Please correct him so we can move on. -
Lindzen and Choi find low climate sensitivity
co2isnotevil>The surface gain of 1.6 is a 25 year average extracted from satellite data with nearly 100% surface coverage at 3 hour samples over that period. If you are averaging the value over 25 years, then by definition you are hiding the increase over time caused by CO2 and any feedback effects. In order to quantify the strength of a changing greenhouse effect, you would have to express this gain as a delta over time, not a static average.
Prev 2017 2018 2019 2020 2021 2022 2023 2024 2025 2026 2027 2028 2029 2030 2031 2032 Next


