


 Arguments


Recent Comments
Prev 2154 2155 2156 2157 2158 2159 2160 2161 2162 2163 2164 2165 2166 2167 2168 2169 Next
Comments 108051 to 108100:
-
Byron Smith at 10:08 AM on 14 October 2010Global warming impact on tropical species greater than expected
so too does it's need for food Typo: it's --> its -
dana1981 at 10:00 AM on 14 October 2010Do the IPCC use alarmist language?
Very nice explanation, James. Well done. -
Peter Hogarth at 09:58 AM on 14 October 2010New temperature reconstruction vindicates ...
muoncounter at 03:43 AM on 14 October, 2010 I think protestant is saying that calculating the mean trend over a period between two ENSO peaks is valid? I checked the trend (it looks similar), but the premise is incorrect, and it is still cherrypicking. From a signal analysis point of view to get close to a meaningful trend we would want to calculate over a minimum period equivalent to several of the maximum length ENSO cycles, - if ENSO has a strong influence (which it does). This would be closer to 20 years than 10. We would normally try to take a trend through extreme excursions like the 1998 peak. To take this peak as a starting point for a 10 year trend is as wrong headed as using it as an end point for the previous decade. Both trend results would be unduly biased in opposite directions. A running decadal average (red below) would be better at extracting underlying trends with minimised ENSO influence, but as this clearly shows the underlying rising trend few deniers would recommend this methodology. Back to the post, the rather crude reconstruction here (using most of Ljungqvist 2009 data) seems suspect in some areas compared to Ljungqvist 2010. If so, by association, so is Loehle, as the methodology is similar (but he uses less proxies).
-
Joe Blog at 09:33 AM on 14 October 2010The sun upside down
Thank you Riccardo for the links(the Haigh one didnt work for me, but im pretty sure ive read that one any way) Just to me, the stratospheric tropospheric interactions in relation to the solar cycle, seem a more viable hypothesis than say the cosmic ray hypothesis, as far as climate variability go(i could be wrong o course). Bearing in mind we are weighting the stratospheric response with co2 cooling up there, and in the past with CFC depletion of O3... An interesting area of inquiry anyway as far as solar effects on climate variability, through dynamical responses to variable UV. -
Doug Bostrom at 08:50 AM on 14 October 2010Do the IPCC use alarmist language?
Amazing that Skeptical Science's James Wight betters the Royal Society when it comes to dealing with this. In the mind of the public one of the central problems in dealing with this affair is thinking about risk. While the RS failed to lend sufficient emphasis to explanations of probability and hence risk in their most recent attempt at a statement, here's a useful elaboration of the IPCC's own acknowledgments. Thanks, James. On a broader note, a lot of skeptic infection depends on people never actually looking at the IPCC report. James linked it above, here it is again just in case somebody missed it. Speaking of alarmists, perhaps it ought to go in the "incoherence thread" but reading this I was immediately struck by how frequently skeptics refer to our lamented warming as quite possibly helping us avert another Ice Age. I've never seen these claims bracketed with language on uncertainty... -
Albatross at 08:13 AM on 14 October 2010Do the IPCC use alarmist language?
James, Interesting post. Just to place the cost of these natural disasters in context. Putting the tragic and painful loss of life aside for a second, the cost of the floods in Pakistan is estimated at almost 10 billion dollars (World Bank). It is also noteworthy that the IPCC in AR4 (their most recent report released in 2007) underestimated the loss of Arctic sea ice and increase in global sea levels. GHG emissions are currently running along the upper edge of their uncertainty range. So much for them being "alarmist".... Re the plane analogy. I personally think that we have all purchased our tickets and are barreling sown the runway knowing that there is something wrong with one of the engines. Yet, the 'skeptics' on the plane are arguing about what could be making that disturbing noise, or what natural cause might be responsible for the smoke spewing from engine number 2. Meanwhile, the pilots (and flight attendants) are taking action to mitigate the damage and avert disaster. Not I perfect analogy I know, but I'm in a rush ;) -
kdkd at 08:11 AM on 14 October 2010Carbon Dioxide - Everyone's Favorite Pollutant
BP #183 You've done nothing to demonstrate that your position is not absurd on this issue. The more time goes on the less value your posts seem to have here, apart from exposing your sceptic position as politically motivated, not based on evidence and subject to an awful lot of confirmation bias. But even then, the more scientific stuff you've been doing lately is awfully shallow too. -
Rob Honeycutt at 07:55 AM on 14 October 2010Do the IPCC use alarmist language?
Not to nitpick but with over 50,000 commercial airline flights per day I think the IPCC would more likely rate the chances of your plane crashing as “exceptionally unlikely.” Other than that, great post! :-) -
Alexandre at 07:54 AM on 14 October 2010Do the IPCC use alarmist language?
...and, on top of that, observations show the reality has been at least as dire as IPCC projections. Hardly a sign of "alarmism". -
Albatross at 05:24 AM on 14 October 2010Carbon Dioxide - Everyone's Favorite Pollutant
BP@186, First, you owe people an answer to my question about your position on Goddard cherry-picking global SL data. Second, you are really scraping the barrel with your reference to salt. One does not have to consume even close to a pound of salt in order for it to be harmful. For this very reason, physicians, agencies and governments around the world regulate the amount of salt present in prepared foods. For example, read the position of the FDA here. Similarly, we need to regulate the emissions of CO2 to keep it at safe levels. In order to do so, the EPA is required to classify CO2 as a pollutant. The "skeptics" have had ample opportunity to present their case, the EPA patiently and thoroughly addressed each and every one of their concerns. They failed, just as you and your fellow "skeptics" are failing to make a coherent and compelling argument now. -
Charlie A at 04:56 AM on 14 October 2010Explaining Arctic sea ice loss
michael sweet at 04:28 AM on 14 October, 2010: "The NSIDC summer summary has links to the two circumnavagations at the bottom." Thanks! I've added those two to my arctic bookmarks. -
muoncounter at 04:39 AM on 14 October 2010Explaining Arctic sea ice loss
#27: "unaware of the yachts making it through" Try searching here for shipping news. This year’s retreat from a winter maximum of about 15 million square kilometres to a September coverage area of just five million square kilometres also means that the four greatest melts since satellite measurements began in the late 1970s have occurred in the past four years. ... Canada and the four other Arctic Ocean coastal nations — Russia, the U.S., Denmark and Norway — have pledged to co-operate in creating new search-and-rescue and environmental protection regimes to manage increased shipping, tourism and economic development in the melting Arctic. -
JMurphy at 04:37 AM on 14 October 2010Explaining Arctic sea ice loss
Wikipedia is a good place to start for anyone wanting to know about passages through the Arctic. -
michael sweet at 04:28 AM on 14 October 2010Explaining Arctic sea ice loss
Charlie, This cruising world article describes the 2009 year. In the article they said 11 yachts made it through (all the yachts that attempted that year). The yacht in the article went through early and later it was more open. No-one was described as needing assistance, although I would not be very surprised if someone did need assistance. Cruising World likes to be cutting edge on sailing so this fits their style. The ice was gone for so long this year that everyone would have made it for sure. The NSIDC summer summary has links to the two circumnavagations at the bottom. -
archiesteel at 04:26 AM on 14 October 2010Carbon Dioxide - Everyone's Favorite Pollutant
@BP: I'm sure if we were to pour gigatons of NaCl in the environment it would have a deleterious effect on public health. "Government is seldom wiser than the people" Do you have empirical value to support this assertion? -
Bibliovermis at 03:59 AM on 14 October 2010Carbon Dioxide - Everyone's Favorite Pollutant
BP, you are still stuck on acute ("real pollutants") vs chronic, except when it could make your point seem reasonable by pointing to chronic issues. For instance, plants need sulfur just as much as they need CO2 but you admit that sulfur, which is a chronic issue, can be a pollutant.although non-toxic
Everything is non-toxic below a threshold value. I have to disagree that a policy of punitive, redistributive taxation is better than ameliorating the issue.Government is seldom wiser than the people
The government is the people. Please spare us at this site from your ideological rants, including Animal Farm references. Rather than rambling about natural sources & breathing (OMG, gas masks!), try sticking to the topic of net anthropogenic emissions. The sophistry of "no qualitative difference exists between the CO2 from natural emissions and anthropogenic emissions" also does not further the discussion. Do volcanoes emit more CO2 than humans? (argument #59) Does breathing contribute to CO2 buildup in the atmosphere? (argument #105) Declaring that the science "is not settled enough" does not cause the science that is presented to you to disappear. The person who dismisses the accumulated scientific knowledge in favor of a political decision is the one politicizing an issue. -
Berényi Péter at 03:49 AM on 14 October 2010Carbon Dioxide - Everyone's Favorite Pollutant
#185 archiesteel at 02:11 AM on 14 October, 2010 CO2 *is* toxic, though not at the concentrations we're talking about That's the point. Table salt is also toxic. Just try to consume a pound of it. Meets the legal criteria to be a pollutant, therefore it's high time to reintroduce a salt tax. -
Charlie A at 03:46 AM on 14 October 2010Explaining Arctic sea ice loss
michael sweet at 18:47 PM on 13 October, 2010 said "For every year since 2007 unreinforced yachts have made the North West passage in less than a month..... This summer two yachts went entirely around the arctic ice, passing through both the North West and the North East passages. No icebreakers went with them." Do you have any links to info on this ? I was unaware of the yachts making it through the NW passage every year since 2007. I have seen some reports of yachts that attempted it and had to be rescued by icebreakers. -
muoncounter at 03:43 AM on 14 October 2010New temperature reconstruction vindicates ...
#152: "you need to draw the lines from CREST-TO-CREST, on ENSO-neutral intervals. 1998 to 2010 is one of those intervals," I don't understand that strategy. Crests are, by definition, noise from short term phenomena. Connecting the dots from 1998's crest to 2009's crest is just as arbitrary as connecting the dots from 1993's trough to 2007's trough. The conclusion that 'there's no statistically significant warming 1998-2010' is to use two and only two data points. How is that not cherrypicking? -
Albatross at 03:39 AM on 14 October 2010Explaining Arctic sea ice loss
Hi Doug, I do believe you re Miller et al. :o) I understand that writing these posts is probably significantly more difficult and time consuming than people expect, and that some difficult decisions need to me made along the way. It seems that some posters here are not comprehending the content of your post. All this talk about "natural cycles" when your last sentence reads: "In sum, although natural factors have always influenced the state of Arctic sea ice, research strongly suggests that today's decline is driven by the novel influence of anthropogenic C02 we've added to the atmosphere and thus is unique in Earth's history." "Skeptics" need to understand that sometimes in science the evidence is so comprehensive, so compelling, so robust that strong words are warranted/justified. Also, it seems things are indeed "going pear-shaped", so sticking our heads in the sand (or trying to convince ourselves that the ice loss is mostly "natural") is not going to help address or avoid dealing with the situation. Moreover, such actions are neither constructive nor responsible. -
Doug Bostrom at 03:24 AM on 14 October 2010Explaining Arctic sea ice loss
Albatross, you probably won't believe it but I actually had that Miller paper listed along w/Polyak, dropped it because I thought it insufficiently ice-specific. It's a deliciously rich review of proxies, an education in itself and I suppose in retrospect should have left it in as a resource for readers; next time I'll listen better to my intuition. Temperature and precipitation history of the Arctic (full text, pdf) Looking at Polyak, I agree I've probably understated the conclusions. I suppose I've become too sensitive to skeptic susceptibility to going hysterical over strongly worded hints that things are going pear-shaped. -
Albatross at 02:41 AM on 14 October 2010Explaining Arctic sea ice loss
Doug, good post. However, some humble suggestions. Maybe more focus needs to be placed on a) Polyak and b) Polar amplification. The following conclusion by Polyak et al., is in my opinion very striking: "The current reduction in Arctic ice cover started in the late 19th century,consistent with the rapidly warming climate,and became very pronounced over the last three decades.This ice loss appears to be unmatched over at least the last few thousand years and unexplainable by any of the known natural variabilities." Using cycles (internal climate variability) to explain long- term trends in Arctic ice does not work, unless one can demonstrate that the cycles themselves have become locked in a particular phase, or if one particular phase of the cycle has become favoured. But then, how does one then know for sure that the change in the cycle's behaviour is purely natural of affected by changes in the circulation brought about by AGW? The events unfolding in the Arctic are consistent with those predicted to occur in association with AGW by Hansen (1981) and Manabe et al. (1992). You might be interested in a new paper out by Miller et al. (2010, Quaternary Sci. Rev., same issue as the Polyak et al. paper) which finds that Arctic amplification on Quaternary time scales consistently exceeds the N. Hemisphere average by a factor of 3-4. Right now that factor is about 2. By forcing the biosphere into a net positive energy imbalance, we humans have set in motion a sequence of events in the Arctic which has led to the manifestation of polar amplification. Going by the work of Miller et al. (2010), the warming (and attendant reductions in ice) in the Arctic will likely continue to accelerate in coming decades on account of polar amplification. -
Ned at 02:36 AM on 14 October 2010New temperature reconstruction vindicates ...
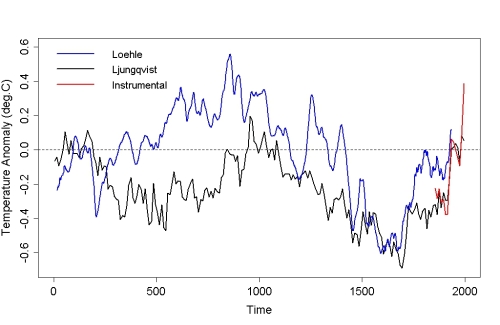
protestant writes: The Lundgqvist data ends on 1999 so therefore you need to ONLY add the temperature increase since then (with 10yr smoothing). Your "method" to add the thermometer data is HIGHLY suspicious, since the NH hasnt warmed since 1990 any more than 0.4 degrees. Best way would be to add the 2000-2009 decadal mean as a spot to the end and THATS IT. I think you're reading deceptive intent where none exists. I wanted to compare a number of different reconstructions including that of Loehle which isn't calibrated to anything else and ends in 1935. In order to do that, it's necessary to somehow recenter the various reconstructions. In Figure 2 I did this based on the period of overlap among the reconstructions, while in Figure 3 I did this by matching each one as closely as possible to the instrumental record during their period of overlap with the instrumental record. One can argue about which is better, but they're both up there. Comparing proxy-based reconstructions to the instrumental record is inherently problematic. Yes, the temporal resolution is different, and some proxies show a well known divergence from actual temperatures in recent decades. There's also the question of which instrumental record to use as a comparison (land vs land/ocean, NH vs global). Faced with those problems, one can either not compare to the instrumental record (and thus draw no conclusions about how past temperatures compare to the present) or one can try to match the proxy and instrumental records as closely as possible during their period of overlap. This is what I do in Figure 3. I understand Ljungqvist's comment that you cite ("a very cautious interpretation of the level of warmth since AD 1990 compared to that of the peak warming during the Roman Warm Period and the Medieval Warm Period is strongly suggested") and have no problem with that. However, the key point of my post is to assess the degree to which Ljungqvist "vindicates" Loehle (2008) vs "vindicating" other reconstructions. Loehle's reconstruction is supposed to be a global reconstruction, yet it shows a greater amplitude for NH-centric episodes than actual NH reconstructions (Ljungqvist, Mann, Moberg). To me, that suggests that insofar as Ljungqvist 2010 "vindicates" anyone, it's a much better match to Mann or Moberg than Loehle. -
muoncounter at 02:35 AM on 14 October 2010Explaining Arctic sea ice loss
#20: "winter average temp has increased, but the summer temps have been stable according to the satellite data." TIS, Prior discussion here may save you some effort. See this prior thread and this one as well. A search will bring up others; this subject gets a lot of attention (as well it should). Minimum (September) ice extent anomalies are increasing in magnitude more rapidly than maximum (March) anomalies. The melt season is also getting longer. Prior discussion noted that 'new ice' melts faster than 'old ice' and that ice thickness continues to decrease. The combination of longer melt season, rising temperatures and a higher percentage of new ice to old ice makes increasingly rapid melt inevitable, with or without AMO.
-
Philippe Chantreau at 02:33 AM on 14 October 2010Explaining Arctic sea ice loss
RSVP: "No one can deny Artic ice thinning or the opening of "northwest" passages. (...and I assume these still close up in winter.)" You mean, you don't really know that? And you couldn't bother doing the extremely basic fact-check before piping a comment? What is the point of commenting on a subject of which you spontaneously confess that you are so ill-informed? This: "land" and "water", quotations marks yours. Why the quotation marks? Are you trying to suggest that they are not really water or land? And this: "the Artic has a built in predisposition to melting anyway due to its lower elevations." The Arctic is an ocean. Lower elevations? I don't know what you're trying to say there. -
Daniel J. Andrews at 02:33 AM on 14 October 2010Billions of Blow Dryers: Some Missing Heat Returns to Haunt Us
I know it is officially off-topic, but things seem quieter here now. Just wanted to offer a very heartfelt thank you, Doug, for your salute to oceanographers and others who have to undergo tedious time-consuming and sometimes dangerous lengths just to grab a smidgen of data that amounts to a few brief paragraphs in a journal article. Thank you for recognizing what they, and others, have to undergo to collect that data. We lost four people in a helicopter crash a few years ago, and this past summer two others, whom I didn't know, crashed while working in the far north around Hudson Bay. Sometimes I think we scientists need to award medals, akin to the military medals, to our colleagues in any discipline who have died while doing their jobs. -
JMurphy at 02:30 AM on 14 October 2010The value of coherence in science
I think there is a very good example of 'so-called skeptic' incoherence at the moment, over the Wegman Report accusations. Previously we were told that the report was a serious, peer-reviewed scientific study headed by a serious statistician whose views on the 'hockey-stick' could be boiled down into the succint saying : "Method Wrong + Answer Correct = Bad Science". Now, however, we are being asked to believe that the report shouldn't be held up to as high a standard as peer-reviewed scientific studies (it was only a report to Congress that had to be made as intelligible as possible to the layman, for heaven's sake !); that Wegman can't be held responsible for everything in the report, especially the stuff he didn't know anything about (although you wouldn't have known that at the time); and that, anyway, the statistical bits are the most important bits and it doesn't matter if the rest of it is copied from elsewhere, i.e. "(Some) Method(s) Wrong + Answer Correct (as believed by all 'so-called skeptics') = (Not really, totally) Bad Science (especially the bits that 'so-called skeptics' need to accept as being true)". Try and rationalise that about-turn... -
michael sweet at 02:28 AM on 14 October 2010Explaining Arctic sea ice loss
TIS, There is a huge amount of data on the North West passage, you have just not looked for it. There are people who LIVE in the NW passage who actually write down each year what the ice is like. They have lived there for over 100 years so the record goes back a long way. Ships have a long tradition of writing down the ice concentrations they meet and that takes the record back into the 1700's, although not as complete the further back you go. Arctic explorers spent decades trying to get through the North West passage, starting with Cook in 1776, of course they kept records. Arctic temperatures over ice have stayed the same since the melting ice controls the temperature. The sign of AGW is more melting. NSIDC uses a chart of temperature at 1000 meters to see actual temperature rise. WUWT has a trick graph of surface temperature north of 80 degrees they use to fool people who don't pay attention. -
CBDunkerson at 02:23 AM on 14 October 2010Waste heat vs greenhouse warming
Over here RSVP suggested that waste heat from Northern hemisphere industrialized nations was responsible for the decline of Arctic sea ice. The 'evidence' for this is that Antarctica is not melting at the same rate as the Arctic sea ice and there are fewer industrial nations in the southern hemisphere. If this concept of 'geographically localized waste heat' were not completely ludicrous (hint: it is) we would of course see the greatest temperature increases at the most heavily industrialized sites. Thus, the area in and around New York City should show tremendous temperature anomalies with decreasing amounts radiating out from there and other industrial centers. The Arctic ocean, having virtually no industry, should of course only show comparatively minor warming from those distant industrial sites. This, of course, is not at all the case. The Arctic has warmed far more than New York City or any other industrial center. Because it has nothing to do with waste heat within a geographic region. -
archiesteel at 02:18 AM on 14 October 2010It's the sun
@Ken: why would I leave? I enjoy seeing you squirm around while trying to defend illogical points. Your arrogance only compounds the farcical nature of your arguments. "Where the Solar irradiance forcing crosses the axis is where TSI is neither warming or cooling the planet, in the absence of other forcings. Any disagreement with that?" TSI is warming the planet. How could radiated energy cause the planet to cool? Again, you're confusing absolute values with deltas. You have failed to successfully argue your point. You can stick around if you want, but you'll only make yourself look more foolish. Your choice. -
archiesteel at 02:11 AM on 14 October 2010Carbon Dioxide - Everyone's Favorite Pollutant
@BP: "If CO2, although non-toxic, is supposed to be harmful in some intricate way, putting a price tag on emissions is a possibility." CO2 *is* toxic, though not at the concentrations we're talking about. CO2 meets the legal criteria to be a pollutant. -
The Inconvenient Skeptic at 01:49 AM on 14 October 2010Explaining Arctic sea ice loss
Robert, As I stated I do not believe the AMO is the only factor, but there is not sufficient information of the impact on the northwest passage from the last warm AMO to know the full impact. What was the status from 1945-1955? All that can be verified is that 1944 was a low ice year. As the AMO stayed strong after that it is not possible to say what the status was. There is simply not sufficient data available on the state of the northwest passage from before to state if this is unprecedented or not. I will put something together on the Arctic temperatures. The winter average temp has increased, but the summer temps have been stable according to the satellite data. I will have it up by the end of the week, probably Friday. John -
Doug Bostrom at 01:45 AM on 14 October 2010Explaining Arctic sea ice loss
As always, a good general approach is to first read the research, then dispute the cause based on an informed perspective. -
RSVP at 01:31 AM on 14 October 2010Explaining Arctic sea ice loss
kdkd "The antarctic ice sheet many many times bigger than greenland. " Adelady "The Antarctic is much more exposed to cold being entirely surrounded by the chilly Southern Oceans." Ned "The distribution of CO2 is more or less uniform" No one can deny Artic ice thinning or the opening of "northwest" passages. (...and I assume these still close up in winter.) What can still be disputed however is the cause. In a bygone thread, the major reason forwarded to discount industrial waste heat as a significant climate forcer is how it pales numerically with the total radiative effects of incremental GHG over the entire Earth surface. What happens however when the comparison is made between the total heat output of industrial nations crouded above the 45 parallel the supposed incremental radiative forcing of GHG in that same restricted area. In addition, when comparing Artic and Antartic regions geographically, it is clear that one is "water" and the other "land". This apparently affects ice cumulation regardless of global temperatures (i.e. there never was 4000 feet of ice at the north pole), which means that the Artic has a built in predisposition to melting anyway due to its lower elevations. Since it doesnt take "much" to accomplish this, and waste heat is a "drop in the bucket" in the scheme of things, this may have more to do with what is really going on than is suspected.Moderator Response: Given its easily quantified irrelevance in comparison to natural variability, we'll do better to continue sequestering further discussion of waste heat in the existing "Waste heat vs greenhouse warming" thread. -
protestant at 01:31 AM on 14 October 2010New temperature reconstruction vindicates ...
Here is actually a screenshot from the paper, a more honest apples-to-oranges comparison: The modern maximum clearly fits to the MWP and RWP margins.
And even considering the fact that the graph uses data up to 1999 there is actually little or no need for such a comparison. Try calculating 2000-2009 minus 1990-1999 and add the result on the papers 1990 decaedal mean.
Neds plots are really exaggerated and falsely interpreted.
The modern maximum clearly fits to the MWP and RWP margins.
And even considering the fact that the graph uses data up to 1999 there is actually little or no need for such a comparison. Try calculating 2000-2009 minus 1990-1999 and add the result on the papers 1990 decaedal mean.
Neds plots are really exaggerated and falsely interpreted.
-
Ned at 01:18 AM on 14 October 2010Carbon Dioxide - Everyone's Favorite Pollutant
BP writes: The shift in costs alone should be enough to provide an incentive. Yes, I agree. BP continues: But having accomplished that much, there is no legitimate justification whatsoever for governments to keep the money and use it for inflating bureaucratic power structures through sponsoring pet projects with public money. Government is seldom wiser than the people in allocating resources, therefore carbon taxes should be fully refunded, let's say through VAT allowance. That's a purely subjective political preference. There's nothing inherently wrong with, say, taxing carbon and using the money to support health care or the military-industrial complex or whatever. That said, I happen to agree that the best option would be to refund effectively 100% of the revenue from a carbon tax to individuals (on a per capita basis). But I try to avoid saying things like "there is no legitimate justification whatsoever" for subjective policy preferences that happen to differ from my own. BP continues: [I]f taxation is based on the theory CO2 is a pollutant the general message is that anyone who can afford it, is free to pollute the environment. A detrimental message, especially because there are actual pollutants causing immediate harm, but still released into the environment unabated because it's much cheaper to pay the fine than to control emissions. Different pollutants have different impacts. There are some cases where essentially no release into the environment is acceptable. At the opposite extreme, in other cases (CO2, SO2, agricultural fertilizers, etc.) the total elimination of anthropogenic fluxes into the environment is neither necessary nor cost-effective ... but limiting the magnitude of the flux is necessary (to prevent AGW, acid rain, harmful algae blooms, etc.) Two methods for doing this are (1) directly regulating emissions, or (2) using taxes or other incentives to keep emissions low. It's true that (2) will "allow anyone who can afford it to continue to pollute the environment", while (1) is more "democratic". On the other hand, given your dislike for "big government" I would think you would prefer option (2), which doesn't involve governments making decisions about who can emit how much for what purpose. BP: The second reason is even more serious. There are legitimate, even natural sources of carbon dioxide emissions, in fact life on Earth as we know it would cease to exist as soon as one would succeed in stopping all emissions. Therefore the theory goes on differentiating between natural and anthropogenic sources. However, at the point of emission no such difference exists. [...] Of course one could attempt to make wearing gas masks obligatory in order to be able to measure this particular source of emission and tax it accordingly, but I don't think any politician who would go for such a move could keep his office for long. Please don't waste our time with stuff like that. Talk about forcing people to wear gas masks, stopping all non-fossil-fuel emissions, and ending life on earth just degrades the quality of the discussion. You would be much better off if you made a bit more effort to resist the inclination to set up and defeat absurd straw-man arguments that no actual person supports. BP then returns to the sphere of the reasonable, by suggesting that the appropriate way to impose a cost on fossil fuel emissions is by a tax on mining (coupled with his ideologically preferred redistribution of the resulting revenue to everyone). This is fine, and could have been usefully expressed without all the preceding baggage. Unfortunately, BP then goes on to conclude with But it can't be done based on the theory CO2 is a pollutant, because in case of real pollutants it is the emission that should be regulated (as opposed to simply taxed) and rightly so. [... For CO2,] a separate set of rules and regulations should be applied which is practicable only if CO2 is assigned to a different category under public nuisances, other than pollutants. This is purely circular reasoning. You've created a definition of "real pollutant" that essentially translates to "things that behave a certain way different from CO2" and then conclude that CO2 isn't a pollutant. However, many people on this site, and many national and international organizations, don't agree with your strictly limited definition of "pollutant". -
protestant at 01:09 AM on 14 October 2010New temperature reconstruction vindicates ...
#145. You are not serious. You use like 2 year trends to prove "accelerated warming". Plus some heavy La Nina- El Nino -cherrypicked trends. Your comparisons were as valuable as this:Nice cherrypicking mate. The problem is that any other shorter interval also includes a lot of noise from weather phenomenoms. Therefore you need to draw the lines from CREST-TO-CREST, on ENSO-neutral intervals. 1998 to 2010 is one of those intervals, and there is no statistically significant warming there. Also a note for the Neds original post: The Lundgqvist data ends on 1999 so therefore you need to ONLY add the temperature increase since then (with 10yr smoothing). Your "method" to add the thermometer data is HIGHLY suspicious, since the NH hasnt warmed since 1990 any more than 0.4 degrees. Best way would be to add the 2000-2009 decadal mean as a spot to the end and THATS IT. Even Taminos version shows its only 0.2K warmer than on MWP:
 (note that he didnt add any thermometer comparison to Loehle and THEN offset to the mean, therefore his offsets are bogus only to support his preconceived notions):
And the error margins on MWP are about +-0.2K
Also, from the paper itself, please read the actual paper before making such "comparisons":
"a very cautious interpretation of the level of warmth since AD 1990 compared to that of the peak warming during the Roman Warm Period and the Medieval Warm Period is strongly suggested."
Your comparisons DO NOT fall into category 'very cautious interpretation'.
And from McShane&Wyner pg. 3:
"It is not necessary to know very much about the underlying methods
to see that graphs such as Figure 1 are problematic as descriptive devices.
First, the superposition of the instrumental record (red) creates a strong but
entirely misleading contrast. The blue historical reconstruction is necessarily
smoother with less overall variation than the red instrumental record
since the reconstruction is, in a broad sense, a weighted average of all global
temperature histories conditional on the observed proxy record. Second,
the blue curve closely matches the red curve from 1850 AD to 1998 AD because
it has been calibrated to the instrumental period which has served as
training data. This sets up the erroneous visual expectation that the reconstructions
are more accurate than they really are."
Therefore the thermometer data is actually not even comparable to proxy data. And your methods HIGHLY problematic.
(note that he didnt add any thermometer comparison to Loehle and THEN offset to the mean, therefore his offsets are bogus only to support his preconceived notions):
And the error margins on MWP are about +-0.2K
Also, from the paper itself, please read the actual paper before making such "comparisons":
"a very cautious interpretation of the level of warmth since AD 1990 compared to that of the peak warming during the Roman Warm Period and the Medieval Warm Period is strongly suggested."
Your comparisons DO NOT fall into category 'very cautious interpretation'.
And from McShane&Wyner pg. 3:
"It is not necessary to know very much about the underlying methods
to see that graphs such as Figure 1 are problematic as descriptive devices.
First, the superposition of the instrumental record (red) creates a strong but
entirely misleading contrast. The blue historical reconstruction is necessarily
smoother with less overall variation than the red instrumental record
since the reconstruction is, in a broad sense, a weighted average of all global
temperature histories conditional on the observed proxy record. Second,
the blue curve closely matches the red curve from 1850 AD to 1998 AD because
it has been calibrated to the instrumental period which has served as
training data. This sets up the erroneous visual expectation that the reconstructions
are more accurate than they really are."
Therefore the thermometer data is actually not even comparable to proxy data. And your methods HIGHLY problematic.
-
Scrooge at 00:54 AM on 14 October 2010Explaining Arctic sea ice loss
Can't help but wonder if we shouldn't be looking more at the holocene to help us determine what we are getting into now. That looks like the time humans made it to Iceland and Greenland and it was by boat from the west. Of course its a lot easier for a band of nomads to survive a gradual climate change than for 6 billion to survive a more sudden change. Now I submit that climate change is like politics in that it all comes down to local. The holocene is believed to be regional. I wonder if someone looking back 5000 years from now might say the same thing. Though changes are happening faster now it still affects regions differently. AGW is now real for Russia and Korea with major crop failures and deaths. Here in the US it wasn't a great year for crops but we can survive it. If the weather patterns change Russia may have a good wheat crop and the US could have major crop failure. So even though its a global problem by squinting your eyes you might be able to only see regional problems. -
robert way at 00:31 AM on 14 October 2010Explaining Arctic sea ice loss
The Inconvenient Skeptic and Ned, The AMO is undoubtedly contributing to the current warming in the North Atlantic and likely does contribute to the loss of sea ice in the Arctic. I believe the AMO also correlates extremely well with Arctic and North Atlantic air temperatures. However the AMO cannot alone explain the significant reductions in Arctic sea ice without including an anthropogenic signal. The AMO in its positive stage represents an intensification of the THC bringing more warm water to the North Atlantic. In the past when the positive phases have occurred it is true that ice losses have subsequently occurred, but I would find it highly suspect to suggest that the Northwest passage was open fully in one year, let alone 3 in a row. -
Ken Lambert at 00:30 AM on 14 October 2010It's the sun
kdkd #688 You are actually looking sensible among some of this lot kdkd. I'm interstate for a few days - will catch up with you Monday. Maybe time to re-visit the karaoke and look for that CO2 saturation again. -
Ned at 00:30 AM on 14 October 2010Explaining Arctic sea ice loss
Roger, that's the basis of Bill Ruddiman's hypothesis (early anthropogenic influence on climate). See Plows, Plagues, and Petroleum if you haven't already read it. I am a bit doubtful. Also, there is at least some evidence that the present interglacial would have been relatively long even without anthropogenic meddling. A number of people think that MIS-11 (~400,000 years before present) is the closest analogue to current conditions, and it lasted much longer than the more recent interglacials. See Berger & Loutre (2002). It is difficult to be confident about this either way -- around 3000 years from now, summer insolation at 65 north will be very close to the value that triggered past glaciations. So while it's likely that this interglacial would have lasted another 50,000 years, if the glacial trigger is more sensitive then it's possible that the Earth would have started a slow transition into glaciation in the not too distant future. Of course, all this is out the window now, as you note, due to anthropogenic GHGs. (It also probably belongs in another thread....) -
Ken Lambert at 00:28 AM on 14 October 2010It's the sun
KR#687 So what do you find wrong with the baselines in GISS Fig 613 from Post #631 KR? I thought we agreed that circa AD 1700 - 1750 was a 'low temperature trajectory' - a Maunder Minimum in fact. Anyway kdkd seems to have no problem with 'holding all other variables constant' in order to ascertain the contribution of each. If one variable did depend on another in an identifiable relationship (lets say CO2 positive forcing is directly related to cloud cooling negative forcing) then the two variables could be treated as one with a known equation for the combined forcing. Go look at the CO2 forcing via the IPCC equation and tell me what the relative forcings are with Solar in say 1800, 1850, 1900, 1950 and 2005. In 2005 you can find Solar at about 0.3 - 0.4W/sq.m and CO2 at 1.66W/sq.m - hardly an order of magniude difference and only at the most recent end of the time scale. -
Doug Bostrom at 23:52 PM on 13 October 2010Explaining Arctic sea ice loss
Fresh thread, inconvenient timing; the copy of the Polyak article at UCAR is unavailable right now, hopefully temporarily. In the meantime Google has a cached copy here. -
Roger A. Wehage at 23:03 PM on 13 October 2010Explaining Arctic sea ice loss
Historical records of world temperatures from ice core samples over the past 410K years show rapid declines following peaks at 130K, 230K, 330K, and 410K years ago. However, in the last 15K years (not counting the industrial years), following the last dramatic temperature rise, global temperatures have remained relatively flat, with fluctuations varying by ±1.5°C or so. If history had anything to say about world temperatures, I would have expected a sharp downward trend, heading toward the next ice age. We see similar historical peaks in CO2. But about 15K years ago there was a small drop in CO2, only to shoot up again about 10K years ago, which might explain the stabilizing of temperatures. Are we overlooking a smaller human footprint on CO2 and global temperatures that may have extended back 10K years or so ago? When did man discover that systematic burning could be used to manage forests, and was that systematic burning more than what nature would have done alone? Put another way, has man been reducing forest stands for 10K years or more, which might be responsible for adding some CO2 to the atmosphere and stabilizing global temperatures? Man has also been burning coal and limited amounts of fossil fuels for thousands of years too. This would also have contributed to CO2, but maybe to a lesser extent than forest reductions. So, rather than nature returning Earth to the next ice age, man is turning it into a sauna. Is it a wonder that we are now seeing shrinking glaciers and ice caps when they should be growing? -
Berényi Péter at 22:56 PM on 13 October 2010Carbon Dioxide - Everyone's Favorite Pollutant
#179 kdkd at 08:42 AM on 13 October, 2010 You imply that chronic pollution is not a valid form of pollution, and that only acute incidents should be considered. And that government should have no role in the provision of infrastructure. What an absurd set of positions! If CO2, although non-toxic, is supposed to be harmful in some intricate way, putting a price tag on emissions is a possibility. As KR #170 puts it "A major motivation for such taxes, however, would be to penalize CO2 emission, providing an economic incentive for current power companies and industries to individually (i.e., not by state-directed mandates or methods) transition away from CO2 heavy methods, and over to profitable alternatives. The shift in costs alone should be enough to provide an incentive. But having accomplished that much, there is no legitimate justification whatsoever for governments to keep the money and use it for inflating bureaucratic power structures through sponsoring pet projects with public money. Government is seldom wiser than the people in allocating resources, therefore carbon taxes should be fully refunded, let's say through VAT allowance. But this solution still lacks conceptual clarity, for two reasons. First if taxation is based on the theory CO2 is a pollutant the general message is that anyone who can afford it, is free to pollute the environment. A detrimental message, especially because there are actual pollutants causing immediate harm, but still released into the environment unabated because it's much cheaper to pay the fine than to control emissions. The second reason is even more serious. There are legitimate, even natural sources of carbon dioxide emissions, in fact life on Earth as we know it would cease to exist as soon as one would succeed in stopping all emissions. Therefore the theory goes on differentiating between natural and anthropogenic sources. However, at the point of emission no such difference exists. The CO2 we exhale (up to 300 kg/person annually) is produced by oxidizing food while the food production and distribution chain involves massive use of energy generated by burning carbon-based fuels reclaimed from the Earth's crust. Of course one could attempt to make wearing gas masks obligatory in order to be able to measure this particular source of emission and tax it accordingly, but I don't think any politician who would go for such a move could keep his office for long. This is a general problem with CO2 emission control. There are so many points and ways of emission, that controlling them all is both exceedingly expensive and quite impossible with no infringement on private life. The alternate solution is of course to go only for large scale industrial emitters, for even if all emissions are equal, but some must be more equal than others. You can surely see what a mess it is. I tell you anyone who maintains only recycling of carbon withdrawn long ago from the carbon cycle by age old geological processes poses public danger, should go for regulation targeting this very step, not emissions. Cap and trade is a preposterous bubble scheme and it is used exactly that way. Therefore if some market intervention is supposed to be necessary in order to reduce digging up carbon, the only rational way is to increase mining fees, refund the excess government income to everyone immediately through tax reduction and let people decide how to spend it. But it can't be done based on the theory CO2 is a pollutant, because in case of real pollutants it is the emission that should be regulated (as opposed to simply taxed) and rightly so. On the other hand with carbon dioxide, as we have seen, it is not the case. Here a separate set of rules and regulations should be applied which is practicable only if CO2 is assigned to a different category under public nuisances, other than pollutants. It is still rather difficult to negotiate a proper price to carbon mining. In theory it should be equal to all the environmental costs its use imposes on the public (even if actual pollutants like soot or sulfur are handled separately by emission control). Unfortunately the science is surely not settled enough to make such a rational calculation possible, so it would be a political decision anyway. But at least it's not a move toward even more concentration of power and away from common sense as present day pseudo-solutions are. -
kainen28 at 22:40 PM on 13 October 2010What constitutes 'safe' global warming?
Informative post. Now a days global warming is serious problem. Global warming is certainly a global issue that needs a global solution. There are lots of reasons for Global Warming. he Global warming occurs due to rise in the temperature around the earths atmosphere. We can make efforts to stop global warming. Ways To Stop Global Warming Use solar system appliances. Plant more trees. Do not cut trees. Turn off the lights when not in room. Cover your pots while cooking. This will save energy which is require for preparation of food. -
Ned at 22:15 PM on 13 October 2010Explaining Arctic sea ice loss
Oh, by the way -- nice post, Doug. Very clear and well written. -
CBDunkerson at 22:15 PM on 13 October 2010Explaining Arctic sea ice loss
kdkd #7: "The latent heat of melting of all that ice will account for a staggering amount of heat in the long run." The worrisome thought to me is, 'what happens with all that heat once the ice is gone?' Right now the Arctic ocean is heating up each year, but much of that heat is 'expended' melting the sea ice through the Summer (at an average rate of about 1000 km^3 per year over the past decade). There were only 4000 km^3 of sea ice left at the end of the 2010 melt season... down from the previous record low 5800 km^3 the year before. So if the average decline over the past decade continued the Arctic would be ice free in September in four years. Even the average rate of decline since 1979, 400 km^3 per year, would have the Arctic melting out in ten years. The Arctic ocean is going to continue accumulating heat. That heat is going to continue melting more ice each year and I can't think of any reason that the volume loss trend should suddenly change radically. Some amount of ice around the Canadian archipelago and other 'land sheltered' areas will stick around, but the rest seems clearly headed to melt out. So when the ice is gone and that heat starts building up rather than getting 'balanced out' by having to melt the ice it seems clear that it will mean a longer period before the ocean begins to refreeze. If so then the 'Arctic amplification' we've seen the last 30 years may be small potatoes compared to what is coming in the next 30. -
Ned at 22:08 PM on 13 October 2010Explaining Arctic sea ice loss
RSVP writes: Is it only coincidental that 90 percent of the world's industry is located in the northern hemisphere, and that this problem is not being seen in the Antartic? If the problem were only due to CO2 the effects would be symetrical, and they are not. Yes, it is coincidental. The distribution of CO2 is more or less uniform but the impacts of warming are distributed irregularly due to regional atmospheric and ocean circulation. This has been understood for decades, and is not some kind of "post hoc" explanation. -
Ned at 22:02 PM on 13 October 2010Explaining Arctic sea ice loss
The moderator writes: Moderator Response: AMO also is touched on by another post on Skeptical Science. Is it? I didn't see anything in that post about the AMO, just references to the Arctic Oscillation and the North Atlantic Oscillation. Admittedly I skimmed the page fairly quickly and might have missed it. That said, I'm not personally a huge fan of the various "oscillations" when used as empirically correlated explanatory variables for other aspects of climate. With enough of these oscillations (ENSO, IOD, AO, AAO, NAO, AMO, PDO, and am I forgetting any?) it's almost always possible to find one (or better yet a combination of two) that will correlate with whatever you're looking at, especially if the time frame is short enough.
Prev 2154 2155 2156 2157 2158 2159 2160 2161 2162 2163 2164 2165 2166 2167 2168 2169 Next


