


 Arguments


Recent Comments
Prev 2201 2202 2203 2204 2205 2206 2207 2208 2209 2210 2211 2212 2213 2214 2215 2216 Next
Comments 110401 to 110450:
-
nerndt at 06:06 AM on 23 September 2010Climate Change: The 40 Year Delay Between Cause and Effect
As for your general idea that since the mass of the ocean is much greater than the mass of the atmosphere, we can safely ignore climate change ... well, that just makes no sense. The mass of the ocean was just as large at the end of the previous interglacial, but that didn't prevent the very radical climate change in which ice sheets spread southward for 80,000 years, eventually covering the place where I now sit with over 2 km of ice. Why would the mere existence of massive oceans prevent us from altering the climate in a similarly dramatic fashion in the opposite direction? That's just wishful thinking, frankly. Hi Ned. The point I was trying to make is that the largest contributor to any global warming is not the atmospher, but the water and land masses. The atmosphere only has 1/500 (or less) overall mass than the oceans and has minimal effect. The one time this may not be the case would be in a large catastrophic event (huge volcano or metror strike) which then changes the absorption of energy by the oceans and land masses and quickly causes climate change. -
johnd at 06:05 AM on 23 September 2010Climate Change: The 40 Year Delay Between Cause and Effect
On the point made in the lead article of this topic of CO2 properties as having been established in the laboratory, the behavior in the atmosphere should follow. The absorption of IR, being thermal energy, heat, in the atmosphere falls within certain limits due, not to the properties of CO2, but must be due that of the environment itself as CO2 can absorb heat to temperatures far in excess of normal conditions without any change of state occurring as this chart shows. The ability of it to radiate heat off, transfer heat to other adjacent matter will depend again on the state of the environment rather than any specific property of CO2 given it remains a gas at normal pressures at temperatures well in excess of anything within the normal environment.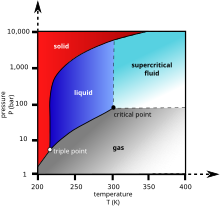
-
Anne van der Bom at 05:43 AM on 23 September 2010A detailed look at Hansen's 1988 projections
muoncounter #79 Actually, scenario B and C had an ‘El Chichon’ sized volcanic eruption in 1995. Pinatubo was much larger (about 4x I believe), so your point is still valid. The only way to deal with this is do multiple model runs, based on different scenarios. The inclusion of one or more volcanic eruptions then becomes part of those scenarios alongside the emissions. -
Paul D at 05:18 AM on 23 September 2010Does Climate Change Really Matter?
Kevin Judd: “Big storms and extreme weather require a lot of energy to drive them.” Arkadiusz Semczyszak response "Nothing could be further from the truth. Great storms require a considerable variation in energy over a small area." The Ville: Tell us something we don't know Arkadiusz. Since Kevin didn't actually define what a big storm was, I think you are making an assumption and then automatically correcting something without knowing what Kevin was referring to. If you weren't here to be deliberately negative, you would have asked for a clearer definition of what a big storm was and then made a comment on that. Arkadiusz Semczyszak: "...we understand that with the increase of the energy supply to such an system...number of extreme events as a result of warming MUST be reduced." The Ville: By your own definition you are incorrect. You earlier stated "Great storms require a considerable variation in energy over a small area.", not increased or decreased energy. Arkadiusz Semczyszak: "Polish scientists (Natural Disasters, 2008.) write: "In the years 1701-1850, ie during the period when the Earth was in the so-called Little Ice Age in the Caribbean basin hurricanes were almost three times higher than in the second half of last century." The Ville: Sorry, 'Polish scientists' were cherry picking or wildly wrong. See Ricardo García-Herreras work on Spanish records of hurricanes in that area and era. Given that the Polish were no where to be seen as far as Atlantic exploration is concerned, I think Spanish records are probably more accurate. Specifically between 1576 and 1601 there was a huge peak, they then dipped until 1760, then started peaking again. eg. during a large chunk of the 'LIA' there were both larger numbers and fewer. -
CBDunkerson at 05:03 AM on 23 September 2010Climate Change: The 40 Year Delay Between Cause and Effect
BmuS #17, dana1981's answer is probably the most useful you'll get. If you are really looking for the warming from CO2 emitted in JUST the year 1970 then we are talking about less than 2 ppm and the resulting warming would be exceedingly tiny. If you meant all CO2 emitted up THROUGH 1970 that's a much bigger factor, but difficult to quantify. Let's say CO2 had stabilized at the 1970 level. I think that was around 320 ppm. In that case, assuming a climate sensitivity of 3 for a doubling of CO2, I get; ln(320/280) * (3 / ln(560/280)) = 0.58 C Since we are 40 years past 1970 pretty much all of that warming should have now been cycled through into the atmosphere. Obviously, different climate sensitivity factors would yield different results, but the current 0.8 C warming is consistent with the 3 C 'fast feedback' sensitivity estimate. -
CBDunkerson at 04:47 AM on 23 September 2010Antarctica is gaining ice
DSL, wow that IS a bit odd. Antarctic sea ice is expected to eventually start declining, but this seems more likely to be some sort of short-term fluctuation. The 'growth' in Antarctic sea ice has been small enough that the current year amount still drops below the long term average semi-regularly. This contrasts with the situation in the Arctic where skeptics got excited earlier this year about the extent coming CLOSE to the long term average for the first time in years. Thus, the current dip is unusual, but not unprecedented. Looks like the Southern melt season started about two weeks early for some reason. -
dana1981 at 04:39 AM on 23 September 2010Climate Change: The 40 Year Delay Between Cause and Effect
beam me up scotty @ #17 - see Quantifying the human contribution to global warming. Short answer, it's approximately 100% over the past 35 years and approximately 80% over the past century. -
Antarctica is gaining ice
Yah, people, when does Antarctic sea ice extent begin to look a little freaky. I don't expect it to continue to nosedive, but I'd like to hear from any experts as to when the dive might/should stop. -
John Bear at 04:21 AM on 23 September 2010Does Climate Change Really Matter?
I agree with Mr. Judd’s argument. As Matt J. (comment 6) pointed out, 2-3 degrees Celsius is equivalent to 4-6 degrees Fahrenheit. An increase in several degrees might seem minute at first, but one needs to consider the scale upon which we are viewing these changes. Consider the human body for example. Our body’s hold a general temperature of around 98.6 degrees Fahrenheit; with a less than a two degree increase in our body’s core temperature we are classified as having a fever, entering a state of “sickness.” Now I know our bodies are different than the entire world; or, are they really that much different? The nature of the planet we live in is in no way less intricate than the incredible complexity of our bodies; both exist in a delicate balance. Countless systems work together in harmony under an ideal set of conditions. If the conditions in which these systems operate are altered even slightly, the consequences can be exponential. If you have a fever and catch a cold, are you able to operate at your normal day-to-day level? Now consider Earth “catching a cold,” the symptoms of our planet getting sick can be devastating not only now, but for future generations to come. -
Albatross at 04:11 AM on 23 September 2010Climate scientists respond to Monckton's misinformation
Hi Rob @38, "But Dr. Scott Mandia started it!"-- says the albatross pointing a huge wing at post #22. Seriously though, I think some politicans have borrowed a page from Hollywood-types in terms of antics used to "advance" their careers. Hmm, I have a self imposed deadline to meet and am clearly procrastinating. -
Rob Honeycutt at 04:03 AM on 23 September 2010Climate scientists respond to Monckton's misinformation
Albatross... Yeah, I'm sure as soon as John gets up we're both busted. ;-) Sometimes I think we're living in upside down world in US politics today where doing stupid things can actually propel your career. -
Albatross at 03:47 AM on 23 September 2010Climate scientists respond to Monckton's misinformation
Rob @36, No need to apologise to me, I'm just concerned that we are distracting from the point of the post-- that said, I do now feel obligated to answer questions asked of me. Hope John is not grumpy when he wakes up (; I'm sure that an AG can file a case whenever he or she chooses to (maybe I was not clear on that), but to do so without sufficient grounds is probably not good for one's career ;) -
archiesteel at 03:44 AM on 23 September 2010A detailed look at Hansen's 1988 projections
@angusmac: please re-read my response to this at #55. If you don't understand parts of it, please tell me. -
Albatross at 03:42 AM on 23 September 2010A detailed look at Hansen's 1988 projections
Badger @83, Maybe this will help. Dana and Tom, What you said :) Current equilibrium climate sensitivity for the GISS model is about 2.7 C. More info here. -
Rob Honeycutt at 03:40 AM on 23 September 2010Climate scientists respond to Monckton's misinformation
Albatross... Also sorry if we're going OT. I could be wrong but I think the AG probably can file a case regardless of whether it has grounds or not. And that's what happened. The case was completely without merit and was struck down by the judge. Literally, I think Cuccinelli was just trying to make noise in order to raise his own profile in politics. In that, the case didn't need to have any merit at all. It's just grandstanding for attention. For Cuccinelli it was mission accomplished. -
dana1981 at 03:17 AM on 23 September 2010A detailed look at Hansen's 1988 projections
Tom Dayton - well said. -
Albatross at 03:16 AM on 23 September 2010A detailed look at Hansen's 1988 projections
Angusmac, You claim, "If the hypothesis is not in good agreement with real world observations then it should be amended until a reasonable agreement is reached." The physics behind GHG forcing is a theory, not a hypothesis. Same holds true for the theory of anthropogenic climate change. The challenging part is getting models to simulate the complex climate system on the planet, and then seeing how the system responds to changes in internal and external forcing mechanisms. Models are wonderful resources b/c they permit one to undertake carefully planned experiments, and that is what Hansen et al. tackled in 1988. How might the climate system respond to increasing radiative forcing from GHGs? The 1988 paper was seminal, but as is often the case for seminal works, it was imperfect-- and Hansen et al. fully realized that much. The science (and models) has advanced since then...it seems it is only the skeptics who are stuck in 1988. It was through a combination of huge leaps in computing resources, better code, and by considering new data and advances in the science that modelers have been able to dramatically improve the models. The new generation of AOGCMs even include atmospheric chemistry. While the model in 1988 was imperfect, it certainly was not nearly as imperfect as some contrarians have elected to falsely state on the public record. That is what this whole post is about-- I really cannot understand why some people cannot see that. So Angus, you have the wrong end of the stick when you and others keep claiming that keep claiming that it is the scientists who are stuck in the past and not moving on. What you are complaining about in the quote (that I cited above) is actually exactly what scientists continue to strive towards. PS: Are you familiar with the Earth Simulator 2 project in Japan? -
dana1981 at 03:16 AM on 23 September 2010A detailed look at Hansen's 1988 projections
angusmac - yes, you're missing about 90% of my article. The issue has been amended. We don't currently believe that 4.2°C is the correct short-term climate sensitivity for 2xCO2, we believe it's around 3°C, which is confirmed by comparing Hansen's results to reality. I'd really prefer not to have to repeat this for a sixth time. Scenario C is irrelevant. It's "on the money" because its' a combination of a too-low forcing and a too-high sensitivity. Saying C is on the money is like saying if I go twice the speed limit and then half the speed limit, I was going the right speed the whole time. -
Tom Dayton at 03:14 AM on 23 September 2010A detailed look at Hansen's 1988 projections
angusmac, the "hypothesis" has been amended--considerably! The models currently "use" a sensitivity lower than the one Hansen used. I put "use" in quotes because the models do not take the sensitivity as an input; the net effect of all the factors in the models is summarizable as a sensitivity. But those amendments were not made simply as a reaction to the mis-prediction of the original model. Instead, the models started to be improved long before any meaningful evaluation of the accuracy of Hansen's prediction could be done. The improvements continue to be made to the underlying physics of the models. The "hypothesis" that is most important is that temperatures were predicted to rise, and have, as opposed to being unchanged or dropping. Less important is the exact rate of rise. Of course the rate is important, which is why research continues urgently. -
John Hartz at 03:11 AM on 23 September 2010A detailed look at Hansen's 1988 projections
I presume that Dr, Hansen and his team have maintained a log of changes they have made to the forecasting model they used in 1998. Is the log in the public domain? -
A detailed look at Hansen's 1988 projections
angusmac writes: If the hypothesis is not in good agreement with real world observations then it should be amended until a reasonable agreement is reached. Yes. And as dana1981 has repeatedly pointed out, the "hypothesis" here is basically that temperature would rise at a rate corresponding to a climate sensitivity of 4.2C per doubling of CO2. The observed trend suggests that this is too high, and that a value of 3.4C per doubling would be a better fit. Can we all agree on this? FWIW, 3.4C/doubling falls nicely within the IPCC's estimated range for climate sensitivity. -
John Hartz at 02:58 AM on 23 September 2010A detailed look at Hansen's 1988 projections
In the context of this discussion thread and the one associated with the article about Dr. Roger Pielke Sr’s pronouncements about OHC, I have a question. Are any of the current crop of climate models designed to forecastof how the heat content of the sub-systems comprising the climate will change under different GHG forcing scenarios? -
Albatross at 02:51 AM on 23 September 2010Climate scientists respond to Monckton's misinformation
Rob @34, I fear that John might edit this as it is OT, but I want to clarify something before letting everyone move on. The Virginia AG did not have grounds to investigate Mann, nor was it a legitimate action-- he was clearly on a witch hunt and fishing for something. In contrast, committing perjury is actionable and there is compelling and legitimate evidence to make that case here. -
angusmac at 02:45 AM on 23 September 2010A detailed look at Hansen's 1988 projections
Dana1981, am I missing something here? My contention is quite simple: real world emissions are following Scenario B whilst real world temperatures are following Scenario C. I thought that real (sceptical) science was about making observations, postulating a hypothesis and testing that hypothesis against the real world. If the hypothesis is not in good agreement with real world observations then it should be amended until a reasonable agreement is reached. Currently the hypothesis which supports Scenario B is not in good agreement with real world temperature measurements. Therefore it is either a poor hypothesis at best or it is incorrect at worst. Either way it should be amended. Hansen 2005 stated that Scenario B "was on the money." Now it looks as though Scenario C "is on the money." Consequently, if real world trends continue to follow Scenario C then computer model forcing and consequential temperature increases should be revised downwards to match real world observations. -
muoncounter at 02:42 AM on 23 September 2010A detailed look at Hansen's 1988 projections
All this wrangling over whether Hansen was 23% or 19% off seems to me to miss two basic points: -Way back at #5, mwof pointed out that the cooling effects of the Pinatubo eruption should be factored out of the comparison, as it effectively delayed the conditions necessary for continued heating. There is no way the effects of the eruption could have been predicted or modeled accurately and that renders such quantitative comparison moot. -Any claim that Hansen was off by 300% or 'got it wrong' is blatant nonsense. Whether you choose B, C or something in between, 300% error just isn't there. B predicts ~.7 deg rise by 2010; LOTI shows it to be ~.6. There's no significance to the second decimal place. -
Albatross at 02:37 AM on 23 September 2010A detailed look at Hansen's 1988 projections
BP @, Really, do you honestly want to go down this path? FIRST, the caption in one of the figures that you provided says it is for 2010s (i.e., 2010-2020). Well, is is now only 2010, and the data you showed go to 2009. So how about we compare apples with apples and remove that Figure? SECOND, there are way too few data points south of 45 S in the southern hemisphere to form a coherent picture. THIRD, by cherry picking these particular data, you are neglecting the recent and valuable work undertaken by several scientists on discrepancies between the satellite, RATPAC and AOGCM data. The data need to be placed in the appropriate context (Santer 2005, Trenberth 2006, Allen 2008, Haimberger 2008, Sherwood 2008, Titchner 2009, Bengstsson 2009) FOURTH, The GCM that Hansen used was incredibly coarse grid spacing in the horizontal (8 degress by 10 degrees; one degree is about 110 km, so the grid spacing was near 1000 km) and also in the vertical, so the model would smooth out features. As if that were not enough of an impediment, Hansen et al note that "Horizontal heat transport by the ocean is fixed at values estimated for today's climate, and the uptake of heat perturbations by the ocean beneath the mixed layer is approximated as vertical diffusion". It was not even a truly coupled atmosphere-ocean model. The fact that the model did as well as it did given that is a testament to the robustness of the underlying physics and Hansen's team. In view of the coarse grid spacing, the validation data should be on the same (or similar) grid spacing. Now two conclusions from Hansen et al.'s abstract which are relevant to this discussion: 1) "The greenhouse warming should be clearly identifiable in the 1990s; the global warming within the next several years is predicted to reach and maintain a level at least three standard deviations above the climatology of the 1950s" Verified by observations. For example, see Santer et al. (2003,2005). Also see various surface and tropospheric temperature data sets. 2) "Regions where an unambiguous warming appears earliest are low-latitude oceans, China and interior areas in Asia, and ocean areas near Antarctica and the north pole" Verified-- for example, see the maps provide by Dana in the post. We have also observed-- Polar amplification, warming over continental land masses in N. hemisphere. The southern oceans have also been warming, albeit at a slower pace-- new research from the University of Washington is showing that the warming in the southern oceans extends down very deep. Read more here -
archiesteel at 02:33 AM on 23 September 2010Climate Change: The 40 Year Delay Between Cause and Effect
Is it just me, or are contrarians becoming increasingly sloppy here? I guess it's a tribute to the science presented here that there would be so many scientifically poor comments trying to attack the points made in the articles: the more influential a science web site becomes, the more it is perceived as a threat by those who are politically opposed to it. Thus, the greater the number of contrarian/trolling comments. -
muoncounter at 02:24 AM on 23 September 2010Climate Change: The 40 Year Delay Between Cause and Effect
#10:"meaning of lag is not that the response starts with a delay, but that the full effect will be seen later." In addition to 'turning off the burner' for a bit, the flattened rate of increase in CO2 after Pinatubo also 'took the lid off the soup pot' (its lunch time here). This essentially delays the continued heating and that should have an effect on the furious discussion over Hansen's 1988 projections. #11: "continues to build up greater heat which circulates around in the oceans for decades before making its way to the atmosphere. " The deep oceans are very cold. I would imagine the lag for measurable ocean heating is orders of magnitude more than 40 years. Since the air heats up (and loses heat) far more rapidly, why does ocean heat storage even enter into the discussion of surface (air) temperatures? -
Albatross at 02:19 AM on 23 September 2010Climate scientists respond to Monckton's misinformation
Jeff T, Until not too long ago I would have agreed with you Jeff. But, IMHO, when appropriate, we now have to fight fire with fire. If compelling evidence exists of perjury, then surely as law abiding citizens we should not let such acts go unchallenged? Taking Monckton to task is not the same as the "witch hunt" undertaken by the Virginia AG. I hope that you can see the huge difference not only in terms of evidence, but motives to, in the case of Monckton. This is a very different kettle of fish. I agree that one should stick to the science, hence my delight that the scientists took the time and effort to counter Monckton using facts. Additionally, Monckton has been debunked so many times to no avail. So, IMO, suggesting that scientists are not permitted to take legal action when warranted, and nor should that be frowned upon, is not fair nor reasonable. Why should someone be given free pass in the event that they committed perjury? Taking the high road does not mean that we have to check our principles and justice system at the door. -
John Hartz at 02:16 AM on 23 September 2010A detailed look at Hansen's 1988 projections
In the interest of full disclosure… I am the one who prodded the NETDR to post on this comment thread. During the course of the past four weeks or so, the NETDR and I have been mud wrestling about global warming/climate change on the comment threads of relevant articles posted on the website of USA Today. Since he has repeatedly badmouthed Dr. Hansen and his projections, I wanted to see how he would fare in “debating” with individuals who have legitimate expertise in these matters. Some of you have proven my contention that the NETDR’s assertions are akin to blocks of Swiss cheese. If any you are gluttons for punishment, you can check out my most recent marathon debate with the NETDR by going to: http://content.usatoday.com/communities/sciencefair/post/2010/09/global-warming-good-news-fewer-big-ocean-storms-possible/1 -
Climate Change: The 40 Year Delay Between Cause and Effect
nerndt writes: What stood out most in the article was the line "The mass of the oceans is around 500 times that of the atmosphere." [...] This is the key point that has mad me a true skeptic on the oeverall effect of CO2 causing global warming. All energy in the atmospaher has a 1/500 effect compared to the oceans, and C)2 has a 1/100 effect compared to all greenhouse gases. The number DO NOT add up. First off, the statement "C02 has a 1/100 effect compared to all greenhouse gases" is just plain wrong. Because the effects of different GHGs overlap, it's not straightforward to say that gas X causes percentage P of the total effect, while gas Y causes percentage Q. But CO2 clearly has a large warming effect on the climate. See How do we know more CO2 is causing warming? Water vapor is the most powerful greenhouse gas Or, for vastly more detail: CO2: An Insignificant Trace Gas? As for your general idea that since the mass of the ocean is much greater than the mass of the atmosphere, we can safely ignore climate change ... well, that just makes no sense. The mass of the ocean was just as large at the end of the previous interglacial, but that didn't prevent the very radical climate change in which ice sheets spread southward for 80,000 years, eventually covering the place where I now sit with over 2 km of ice. Why would the mere existence of massive oceans prevent us from altering the climate in a similarly dramatic fashion in the opposite direction? That's just wishful thinking, frankly. -
Rob Honeycutt at 01:56 AM on 23 September 2010Does Climate Change Really Matter?
There's a minor grammatical error in the second to the last paragraph. I believe that would be "affected" not "effected." -
beam me up scotty at 01:41 AM on 23 September 2010Climate Change: The 40 Year Delay Between Cause and Effect
Question: What percentage of the current .8C warming is due to CO2 that was emitted in 1970? Can that be calculated? -
Jeff T at 01:34 AM on 23 September 2010Climate scientists respond to Monckton's misinformation
Re #21 (ProfMandia) and #22 (Albatross). Can we please stay away from recommending criminal prosecution? It may be justified, but it makes us too similar to the Attorney General of Virginia threatening Michael Mann. Let's stick to the science. -
dana1981 at 01:33 AM on 23 September 2010A detailed look at Hansen's 1988 projections
Anne van der Bom - you are correct, and I tried to be careful in my phrasing. Hansen employed a climate model which had a climate sensitivity of 4.2°C for 2xCO2. actually thoughtfull - you got it. All Scenarios are included for completeness, but it really only makes sense to look at B. We could look at C and adjust for the differences in GHGs there too, but there's no much point, since B is closer to reality. As for the percentages, Hansen's model sensitivity was off by 19% and his temp projections were off by 23%, the difference being the 5-10% excess in Scenario B forcing as compared to actual forcing. HumanityRules - approximately 100% of the temp change since 1984 has been to GHGs. The IPCC looks at the temp change over a longer period of time, which has been partially natural. Scenario A is constantly accelerating GHG emissions, whereas B is a linear increase in emissions. Thus Scenario B is effectively business as usual. Berényi Péter - the tropical toposphere remains a question mark, whether the cooling you discuss even exists or if it's an error in the data. With all the correct projections made by Hansen (high accuracy in spatial distribution, within 23% of the warming trend), to claim his 'prediction was falsified' because one aspect may or may not be there is ridiculous. That's like saying getting 90% on a test is an F because it's not 100%. Badgersouth - it's worthwhile to examine the accuracy of climate models 22 years ago, because even though they've vastly improved since then, they're still based on the same fundamental physics. -
Albatross at 01:24 AM on 23 September 2010A detailed look at Hansen's 1988 projections
Hi Badger, Good question. The only reason I can think of is because to this day "skeptics" and those in denial about AGW keep touting Hansen's projection as "evidence" that climate models do not work at all. Or, that the projections were "wrong" then and so they will all be wrong now-- silly logic, but for those not in the know such statements are at the very least confusing and/or sow doubt, especially when not provided context or updates on the latest developments. So sadly, people like John and Dana have to spend their valuable time addressing the confusion and trying to undue the confusion. A perfect analogy for this Hansen paper is the 1998 Hockey Stick paper (MBH98), MBH98 did have some issues (like all seminal techniques it was not perfect), but he science has advanced (in part b/c of that seminal work) and technique shave been improved upon or refined, yet the contrarians to this day are still stuck 1998, or is that 1988? My suggestion to NETDR, BP and HR (and HR enough with the rhetoric already HR (e.g., "catastrophists") is to please move on. -
Jeff T at 01:15 AM on 23 September 2010Climate Change: The 40 Year Delay Between Cause and Effect
Greenhouse gases do trap radiation, but greenhouses stay warm largely because they prevent convection. Thus, the statement, "Like glass greenhouses, greenhouse gases allow sunlight to pass through unhindered, but trap heat radiation on its way out." is incorrect and should be modified. Even in a basic version, statements should be accurate. -
John Hartz at 00:51 AM on 23 September 2010A detailed look at Hansen's 1988 projections
@Albatross: On the one hand, I can understand why it is important to debunk all of the false charges made about the validity of forecasts made by Dr. James Hansen in 1998. On the other hand, given how far the state-of-art in climate modeling has advanced over the past two decades plus, why is the validity of forecasts made in 1998 cause for such consternation today? I’m not a scientist. I’m just trying to learn the lay of the land so to speak. -
Phila at 00:28 AM on 23 September 2010Climate Change: The 40 Year Delay Between Cause and Effect
#12 Arkadiusz Semczyszak As usual, you're cherrypicking, and ignoring the authors' interpretation of their own work. "The more carbon dioxide you put in, the more acidic the ocean becomes, reducing its ability to hold CO2" said the study's lead author, Samar Khatiwala, an oceanographer at Columbia University's Lamont-Doherty Earth Observatory. "Because of this chemical effect, over time, the ocean is expected to become a less efficient sink of manmade carbon. The surprise is that we may already be seeing evidence for this, perhaps compounded by the ocean's slow circulation in the face of accelerating emissions...." Khatiwala says there are still large uncertainties, but in any case, natural mechanisms cannot be depended upon to mitigate increasing human-produced emissions. "What our ocean study and other recent land studies suggest is that we cannot count on these sinks operating in the future as they have in the past, and keep on subsidizing our ever-growing appetite for fossil fuels," he said. -
nerndt at 00:26 AM on 23 September 2010Climate Change: The 40 Year Delay Between Cause and Effect
What stood out most in the article was the line "The mass of the oceans is around 500 times that of the atmosphere." This is an extremely compelling point specifying that the total effect of atmospheric conditions on climate change has at best a 1/500 effect compared to the oceans. This does not even include the effect of the land mass as well (perhaps another 1/7 more land/ocena versus atmospheric effect). This is the key point that has mad me a true skeptic on the oeverall effect of CO2 causing global warming. All energy in the atmospaher has a 1/500 effect compared to the oceans, and C)2 has a 1/100 effect compared to all greenhouse gases. The number DO NOT add up. -
grypo at 00:24 AM on 23 September 2010Climate Change: The 40 Year Delay Between Cause and Effect
Thank you CB! Arkadiusz Semczyszak "Why Hasn’t Earth Warmed as Much as Expected?, AMS Journals, Schwartz et al., 2010.:" This paper discusses some uncertainty as to whether Climate Sensitivity is at the low range or whether aerosols contribute more to cooling than previously thought. But to understand fully what this paper suggests, you need to read the conclusions: "Even if the earth’s climate sensitivity is at the low end of the IPCC estimated ‘‘likely’’ range, continued emission ofCO2 at the present rate would exhaust in just a few decades the shared global resource of the incremental amount of CO2 that can be added to the atmosphere without exceeding proposed maximum increases in GMST. If the sensitivity is greater, the allowable incremental emission decreases sharply , essentially to zero at the present best estimate of climate ensitivity, and is actually negative for greater values of this sensitivity. "Reconstruction of the history of anthropogenic CO 2 concentrations in the ocean." Uncertainties as to the distribution of CO2 sink in the ocean does not change what we know about the carbon cycle and what content is in the atmosphere. The passage before what you quoted in the abstract says: "The release of fossil fuel CO2 to the atmosphere by human activity has been implicated as the predominant cause of recent global climate change1. The ocean plays a crucial role in mitigating the effects of this perturbation to the climate system, sequestering 20 to 35 per cent of anthropogenic CO2 emissions2, 3, 4. Although much progress has been made in recent years in understanding and quantifying this sink" "... and I have to invest billions of dollars in synthetic trees ... ?" Nothing you've posted here would lead anyone to not invest in mitigation and adaption. -
HumanityRules at 00:19 AM on 23 September 2010A detailed look at Hansen's 1988 projections
Sorry Dana I didn't see you were the author. #70 is aimed at you. -
Berényi Péter at 00:16 AM on 23 September 2010A detailed look at Hansen's 1988 projections
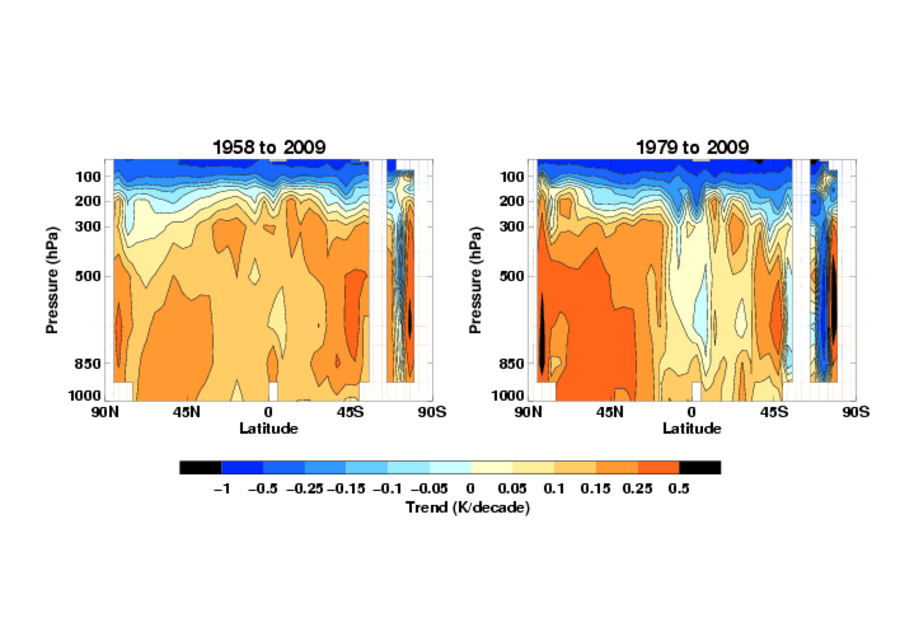
Posted by dana1981 on Monday, 20 September, 2010 at 11:38 AM Had Hansen used a climate model with a climate sensitivity of approximate 3.4°C for 2xCO2 (at least in the short-term, it's likely larger in the long-term due to slow-acting feedbacks), he would have projected the ensuing rate of global surface temperature change accurately. Not only that, but he projected the spatial distribution of the warming with a high level of accuracy. OK, let's have a closer look. Hansen 1988 has also predicted the decadal mean temperature change for scenario B as a function of pressure and latitude. Now, since then we have got some actual data about this temperature trend distribution. The Hadley Centre of the UK Met Office has a near real-time updated dataset called HadAT (globally gridded radiosonde temperature anomalies from 1958 to present).

Linear trends in zonal mean temperature (K/decade) in HadAT2 1979-2009. 1000 hPa data are from HadCRUT2v subsampled to the time-varying HadAT2 500hPa availability The image above is explained in this publication: Internal report for DEFRA, pp. 11 HadAT: An update to 2005 and development of the dataset website Coleman, H. and Thorne, P.W. As you can clearly see, predicted and observed zonal trends have nothing to do with each other: neither high, nor low level of accuracy can be detected. Particular attention should be payed to the cooling trend in the tropical mid-troposphere (-0.5°C/century) and the severe cooling between 65S and 70S along the entire air column (down to -5°C/century). These features are absolutely lacking in Hansen's prediction, therefore the take-home message should be "Hansen's 22 year old prediction is falsified". We can talk about if anthropogenic global warming theory were wrong on which the model was based or it was a flawed implementation, but there is no question about Hansen's failure. BTW, the tropical upper tropospheric cold spot observed and documented in HadAT2 is inconsistent with surface warming according to even the most recent computational climate models. So neither Hansen nor his followers can get the sign of change right in some particularly important regions. Taking into account this wider failure, we can safely bet "climate models and the anthropogenic global warming theory are wrong", quite independent of Hansen's 1988 blunder. -
HumanityRules at 00:16 AM on 23 September 2010A detailed look at Hansen's 1988 projections
The other question I have is to do with scenario A, B and C. Having read the paper I'd sort of assumed that A was the "business as usual" option and the catastrophists really on this for the fearful future. Is this a wrong assumption on my part? -
HumanityRules at 00:10 AM on 23 September 2010A detailed look at Hansen's 1988 projections
John, is there an assumption in your calculations that 100% of the temperature rise over this period is due to the forcing of human GHGs? Because the IPCC's "most" is starting to look like "all". -
Daniel Bailey at 00:06 AM on 23 September 2010Does Climate Change Really Matter?
Re: cruzn246 (1)"There is no upswing in extreme weather."
Your Jedi mind tricks won't work on us here. The Yooper -
Byron Smith at 23:50 PM on 22 September 2010Does Climate Change Really Matter?
The effects you are most likely to experience is an increase in extreme weather. Actually, might it not be more likely that the effects most readers (who will be more likely to come from relatively rich developed countries with more moderate climates) will be the knock on effects of extreme weather elsewhere, experienced as economic turbulence and the political effects of food insecurity. But hard to know exactly what is going to hit a given person personally first. Some may experience extreme weather directly, but I suspect that many more will face knock on consequences of declining food production. That is, climate change will probably affect many people in ways that they don't think of as due to climate change, but it will be one of the significant background causes. @Roger A. Wehage Now I don't believe in God, so I tend to think that man was not created in His image and can therefore become extinct I do believe in God and tend to think that humanity was created in God's image, but I also think that we can become extinct. There is no divine promise of personal or civilisational protection. -
Arkadiusz Semczyszak at 23:47 PM on 22 September 2010Climate Change: The 40 Year Delay Between Cause and Effect
Why Hasn’t Earth Warmed as Much as Expected?, AMS Journals, Schwartz et al., 2010.: “The observed increase in global mean surface temperature (GMST) over the industrial era is less than 40% of that expected from observed increases in long-lived greenhouse gases together with the best-estimate equilibrium climate sensitivity given by the 2007 Assessment Report of the Intergovernmental Panel on Climate Change (IPCC).” “Current uncertainty in climate sensitivity is shown to preclude determining the amount of future fossil fuel CO2 emissions that would be compatible with any chosen maximum allowable increase in GMST; even the sign of SUCH ALLOWABLE FUTURE EMISSIONS IS UNCONSTRAINED.” Ensemble reconstruction constraints on the global carbon cycle sensitivity to climate, Frank et al. 2010, Nature : “But themagnitudeof theclimate sensitivityof theglobal carboncycle (termed c), and thus of its positive feedback strength, is under debate, giving rise to large uncertainties in global warming projections.”. “The average correlation between individual temperature reconstructions and the mean CO2 record is 0.47 over the pre-industrial 1050–1800 period (all years are AD), increasing to 0.57 with a 50-year CO2 response lag—such timing is consistent with modelled CO2 response to a temperature step change.” “Yet, great scatter in c, from a few to more than 40 p.p.m.v. per uC, closely reflects the choice of the individual temperature and/or CO2 estimates used for analysis. Particularly relevant to constraining sensitivities of the Earth’s coupled climate system is the amplitude of hemispheric to global-scale ...” “Approximately 40% of the uncertainty related to projected warming of the twenty-first century stems from the unknown behaviour of the carbon cycle, which is an important component of the global climate system.” “Coupled carbon–climate models show a wide range in feedback strength, with 20–200 p.p.m.v. of temperature-driven CO2 by 2100 ...” “Our results ... ... suggest 80% less potential amplification of ongoing global warming.”. Reconstruction of the history of anthropogenic CO 2 concentrations in the ocean. Khatiwala et al. 2009.: “Although much progress has been made in recent years in understanding and quantifying this sink, considerable uncertainties remain as to the distribution of anthropogenic CO 2 in the ocean, its rate of uptake over the industrial era, and the relative roles of the ocean and terrestrial biosphere in anthropogenic CO 2 sequestration.” Summarize: ... such allowable future emissions is unconstrained ..., ... large uncertainties in global warming projections ..., ... great scatter ..., ... 40% of the uncertainty ..., ... wide range ..., ... 80% less potential amplification ..., ... considerable uncertainties ... ... and I have to invest billions of dollars in synthetic trees ... ? -
CBDunkerson at 23:45 PM on 22 September 2010Climate Change: The 40 Year Delay Between Cause and Effect
Following on Riccardo's comments and going back to the 'pot of water' analogy... Pinatubo was the equivalent of turning the stove off for several seconds. All that dust in the air had an immediate impact on temperatures, but within a couple of years it had all fallen back to the surface and was no longer a factor. Yes, less heat went into the oceans during those few years and thus there is also a 'long term' impact, but since the 'forcing' from the dust only lasted a short time the cumulative cooling effect was small. When you add CO2 to the atmosphere the level stays elevated and thus continues to build up greater heat which circulates around in the oceans for decades before making its way to the atmosphere. -
Ken Lambert at 23:45 PM on 22 September 2010Should The Earth Be Cooling?
#65 Handsome concession Yooper. Look forward to engaging on the details.
Prev 2201 2202 2203 2204 2205 2206 2207 2208 2209 2210 2211 2212 2213 2214 2215 2216 Next


