


 Arguments


Recent Comments
Prev 2231 2232 2233 2234 2235 2236 2237 2238 2239 2240 2241 2242 2243 2244 2245 2246 Next
Comments 111901 to 111950:
-
Daniel Bailey at 07:08 AM on 8 September 2010Plain english rebuttal to 'Global warming isn't happening' argument
Re: ResqDogz (13) A short version of the CO2 is caused by us thread: Due to its isotopic signature, the 40% extra CO2 above background interglacial levels is due to us. WE are the problem. The Yooper -
ResqDogz at 06:57 AM on 8 September 2010Plain english rebuttal to 'Global warming isn't happening' argument
Wonderfully simplistic explanation.. but the problem remains: How to convince those obstinate skeptics that mankind CONTRIBUTES to - and exacerbates - global warming? I'm way past tired of hearing "oh, it's naturally cyclical (warming) - and we [mankind] have but a miniscule contribution.. if at all".... What simplistic retort might you have for THEM (other than my first urge to string a few expletives together... you know - something they're SURE to comprehend!)???Response: The question of mankind contributing to global warming is indeed the main subject of this website. We have a basic version that looks briefly at 10 human fingerprints on climate change. There's a more in-depth version that takes you through the logical progression of evidence for human caused global warming. Then if you're a glutton for punishment, there's the 'Advanced version' that looks in detail at a number of human fingerprints on climate change. -
Daniel Bailey at 06:51 AM on 8 September 2010Human CO2 is a tiny % of CO2 emissions
Re: John Ballam (58) Mostly. Consider, though, that we now have CO2 levels approximately 40% higher than "normal" interglacial highs... Something to chew on. The Yooper -
john ballam at 06:46 AM on 8 September 2010Human CO2 is a tiny % of CO2 emissions
Thank you for those answers. So, it's the RATE of addition of CO2 that is the problem. A 3% increase over thousands of years would be largely taken up by the various sinks and could indeed be called "tiny", but 3% in a few decades is unprecedented and too much for the system to bear. Getting there? -
José M. Sousa at 06:33 AM on 8 September 2010What do you get when you put a climate scientist and 52 skeptics in a room?
Great Stephen Schneider! -
Rob Honeycutt at 06:13 AM on 8 September 2010What do you get when you put a climate scientist and 52 skeptics in a room?
Really, a brilliant format for a discussion. It was really good. The deniers in the audience were very on top of the issues they have with climate change. You could tell a lot from the moments where you could hear the whole audience groan at something Stephen said. Climate scientists should take note of those moments and formulate clear answers for those. I hope that some other climate scientists take up this example that Stephen set. I'd love to see Richard Alley do a similar program. I'm sure there are some other climate scientists out there who are also good communicators who could do the same. Trenberth should be up there. -
Ned at 05:42 AM on 8 September 2010Human CO2 is a tiny % of CO2 emissions
John Ballam, I second Tom Dayton's remark that this is a good question. Something to keep in mind is that if natural sources and sinks weren't approximately in balance, Earth would quickly become inhospitable for life as we know it. Thus, the fact that our species and our civilization exist (and we are able to ask questions about these things) necessarily implies that we must live on a planet where natural sinks and sources are more or less balanced. Over the long term, however, sources and sinks do fluctuate slowly, as Tom Dayton points out. Thus, there are time periods when CO2 is higher or lower. Note, e.g., the Pleistocene glacial/interglacial cycle, when CO2 naturally fluctuated by around 100 ppm: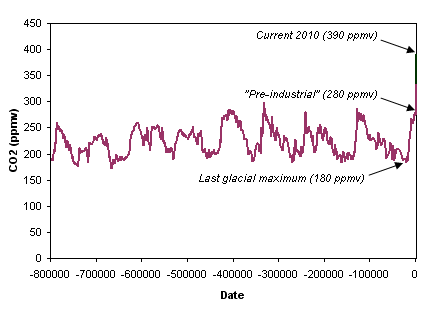 Figure 1: CO2 concentration over the past 800,000 years from ice cores at Dome C, Vostok, Taylor Dome, and Law Dome.
However, as seen on the far right side of that figure, we're currently raising CO2 much more rapidly, and to much higher levels, than anything seen during those glacial/interglacial cycles.
Figure 1: CO2 concentration over the past 800,000 years from ice cores at Dome C, Vostok, Taylor Dome, and Law Dome.
However, as seen on the far right side of that figure, we're currently raising CO2 much more rapidly, and to much higher levels, than anything seen during those glacial/interglacial cycles.
-
Tom Dayton at 05:19 AM on 8 September 2010Human CO2 is a tiny % of CO2 emissions
Good question, John Ballam. Your last paragraph is part of the answer. But since humans continue to add CO2, that new future equilibrium point keeps moving. The other, more subtle, part of the answer is that there is no one special equilibrium temperature for the Earth. The temperature and climate stability of the last few thousand years has allowed human civilization to flourish, but in previous eras the climate was quite different due to different degrees of the various forcings and feedbacks. Except for sudden events such as meteor and comet impacts, changes in the past mostly have been gradual in terms of human lifetime and even human civilizations. So the climate never really reaches an equilibrium, because some forcing or feedback always is changing. But for humans' practical purposes, slow changes are close enough to equilibrium for coping. The human release of massive amounts of CO2 is so fast that the resulting climate changes will be too fast that coping will be tremendously difficult, expensive, and painful. -
Albatross at 05:16 AM on 8 September 2010What do you get when you put a climate scientist and 52 skeptics in a room?
Yes, Schneider had a wonderful balance of immense knowledge, oratory skills and PR skills. He will be sorely missed. IMHO, this is what more climate scientists need to start doing-- outreach and public education are key. I hope this program gets aired widely. -
john ballam at 05:06 AM on 8 September 2010Human CO2 is a tiny % of CO2 emissions
Can you answer what I think is a more sophisticated version of the “too small to matter” argument? It is often said that natural sources and sinks are in balance, but human emissions throw this balance out and positive feedback sets in. This is in danger of sounding like Gaia-based woo woo. My question is this; why is there a balance in the first place? In other words, why is the equilibrium stable without human activity but unstable with human activity? And in writing that, I think I might have figured out the answer to my own question, though I have never seen this written down. Is it that for *any* CO2 concentration, there is an equilibrium temperature, which the Earth will reach eventually. Human emissions have shifted that equilibrium position higher. We wiould eventually get to a stable point at current CO2 levels, but it will be much higher than today’s temperature. Is that it? John -
tobyjoyce at 05:00 AM on 8 September 2010What do you get when you put a climate scientist and 52 skeptics in a room?
I also learned a lot from this discussion, one of them being that "denialists" are mostly confused people who had fastened onto convincing but poor arguments that Schneider was able to refute. Schneider is a great loss. Possibly only someone of his stature and breadth of knowledge could deal with so many arguments in the same session. We don't have many of his calibre to replace him. -
Ned at 04:54 AM on 8 September 2010Ocean cooling: skeptic arguments drowned by data
Obviously, there is a lot less ice than there used to be (on both land & sea) and the energy used to melt that ice had to come from somewhere. So yes, that would tend to reduce the apparent warming of the ocean and atmosphere. But the magnitude of that latent heat is pretty small, even if PIOMAS were severely underestimating ice melt. Melting all the normal Sept. sea ice in the Arctic (~13400 km3) would take around 6.7 * 10^20 J. For comparison, the units in the graph of "Upper Ocean Heat Content Anomaly" are 10^22 J, two orders of magnitude larger. I made a typing error (though not a calculation error) in my previous comment up-thread. Melting one gigaton of ice is 3.3355 * 10^17 J, not 333.55. The calculations in that comment were done using the correct number; I just wrote the wrong one when transcribing it here. Sorry! -
CBDunkerson at 04:53 AM on 8 September 2010Ocean cooling: skeptic arguments drowned by data
macwithoutfries, the difference between the PIOMAS and ICESat results on the graph you show is actually fairly small... and if 10,000 km^3 of Arctic sea ice had been lost since 2005 the total would now be negative. :] We should see how well PIOMAS has done when Cryosat II data starts getting released in the next couple of months. BTW, PIOMAS just updated earlier today with results through 8/31. Looks like the anomaly is at about -9,500 km^3. Given that's against a baseline of ~14,000 km^3 that puts the total volume around 4,500 km^3. The previous record minimum (last September) was 5,800 km^3... and we haven't hit the minimum for this year yet. -
macwithoutfries at 04:32 AM on 8 September 2010Ocean cooling: skeptic arguments drowned by data
Ned #29 Could it be that (at least since around 2005) the model behind PIOMAS might be way too conservative ? - see ICESat and the end on this graph If the actual volume lost from 2005 to 2010 would be in the range of 10000 km3 things already start looking a little different ... -
CBDunkerson at 04:02 AM on 8 September 2010Climate and chaos
Dan, that's an interesting comment about determining probabilities for extreme weather events. For instance, the Russian heat wave and wildfires... this is a weather event which has never happened before in recorded history. As I see it that means either it wasn't possible under previous climate conditions or it would have required such a rare combination of factors that it just never happened until now. If it were possible to put numbers to that it'd go a long way towards putting the whole 'no single weather event can be directly attributed to global warming' bit into proper perspective. -
CBDunkerson at 03:56 AM on 8 September 2010What do you get when you put a climate scientist and 52 skeptics in a room?
I think he gave an 'UHI biases are factored into the temperature record' answer to what was actually an 'Anthony Watts says poor station siting skews the temperature record' question, but sometimes it can be difficult to figure out exactly which skeptic argument is being made... especially when relayed by someone at several removes from the original claim. -
CBW at 03:44 AM on 8 September 2010Is climate science settled? Especially the important parts?
RSVP, there will always be people clamoring for some kind of action on everything that goes on in the world. But if we were to take action that significantly reduced the risks posed by climate change, it would be the science that would tell us that the risks were reduced. -
davidwwalters at 03:40 AM on 8 September 2010What do you get when you put a climate scientist and 52 skeptics in a room?
This is a must see for every one of you climate scientist frustrated by the confusion among the public. You (climate scientists) have your work cut out for you. As an interested layperson, I only hope that viewing this can give an insight on how to better frame your arguments for public consumption. I learned a lot from Stephen Schneider's discussion. -
Dan Olner at 03:11 AM on 8 September 2010Climate and chaos
Top: "But everybody is fast on the draw to attribute the heat wave of 2010 or the monsoon disaster in Pakistan to climate." No they're not. Some people have started asking what statistical methods might allow us to attribute probabilities that these sort of events are climate-change driven. -
JMurphy at 03:10 AM on 8 September 2010Climate and chaos
Not so, TOP. Although it is projected/predicted that global warming will result in higher global temperatures (and therefore hotter heatwaves) and more/heavier precipitation in certain regions, I can't see where "everyone" is attributing particular heat-waves or monsoon disasters to climate, let along global warming. They do, however, add to the long list of evidence backing the theory of global warming, and are more significant than the claims of the so-called skeptics whenever we have a local cold spell or lots of snow. -
TOP at 02:56 AM on 8 September 2010Climate and chaos
But everybody is fast on the draw to attribute the heat wave of 2010 or the monsoon disaster in Pakistan to climate. -
MarkR at 02:47 AM on 8 September 2010What do you get when you put a climate scientist and 52 skeptics in a room?
theendisfar: Scientific discourse between scientists is different from the level required with the public. If someone tells me that a set of my measurements are wrong, it will likely take hours, and possibly weeks or months, to check that (unless, of course, the stuff is already published in the peer reviewed literature). You might be more interested in the question: 'what happens when you have thousands of scientists of different approaches working on a problem and only being able to publish work which passes a minimum standard of scientific quality according to an anonymous review of their peers'. We already have that, and you're welcome to take a look through as much peer reviewed literature as you want. -
Rob Honeycutt at 01:37 AM on 8 September 2010What do you get when you put a climate scientist and 52 skeptics in a room?
Daniel.... If it'd been a snake... ;-) -
Yvan Dutil at 01:24 AM on 8 September 2010Climate and chaos
Roulette is a chaotic system. Nevertheless, you can easily predict the odds of winning. If they change much from their predicted values banks will notice. Chotic does not means that average behaviour is unpredictable. Only the short terms trajectory is. This is why this si called deteerministe chaos. Nevertheless, you might observed unpredictable jump in dynamics. Pickover called them "magic doors". This is a well documented phenomenon. -
Daniel Bailey at 01:09 AM on 8 September 2010What do you get when you put a climate scientist and 52 skeptics in a room?
Re: robhon (9)"Does anyone know where to view this after the airing?"
See the link BaerbelW (6) kindly provided above. The Yooper -
Rob Honeycutt at 00:59 AM on 8 September 2010What do you get when you put a climate scientist and 52 skeptics in a room?
Does anyone know where to view this after the airing? -
John Brookes at 00:58 AM on 8 September 2010What do you get when you put a climate scientist and 52 skeptics in a room?
I watched, and it was pretty good. All the usual dodgy arguments came out. Particularly illuminating was the woman who complained how she was treated when she published a "skeptic" article. Schneider sympathised with her, and pointed out that he had been subject to much abuse, including death threats. That may have made some people think. I just love the level of understanding that climate scientists have! -
RSVP at 00:48 AM on 8 September 2010Is climate science settled? Especially the important parts?
Article asks... "Shouldn’t we wait for 100% certainty before taking action?" What would define "taking action"?... or rather, how much action, (and what actions) would be enough action? ...no matter how much action is taken, there will always be those clamoring that not enough action is being taken, that and a never ending stream of scientific papers to back up these claims... -
chris1204 at 00:33 AM on 8 September 2010Ocean cooling: skeptic arguments drowned by data
MattJ @9: Shadow on lungs does not automatically equate with lung cancer. It could be TB, a viral infection, and a host of other illnesses. I'd choose another metaphor :-) Or maybe stick with the metaphor - if BP & HR are right then the metaphor may well be apt - the shadow mightn't be quite what we think it is. -
chris1204 at 00:24 AM on 8 September 2010Is climate science settled? Especially the important parts?
Adelady: I'm glad you pay insurance. Most of us pay some form of insurance - we rarely view ourseloves as winners when we get an insurance payout. I guess some have issues about the costs of some proposed premiums. -
Tom Dayton at 00:14 AM on 8 September 2010Ocean cooling: skeptic arguments drowned by data
Good question, LazyTeenager. Go to the Argo home page and look on the left side for the links about Argo Data. A key is "gridding," which is construction of a single temperature per geographic grid cell, which provides equal weighting per geographic area. -
LazyTeenager at 23:46 PM on 7 September 2010Ocean cooling: skeptic arguments drowned by data
Question: can someone explain how the Argo float data is used to infer a global average temperature. This sounds like a naive question I know but it crosses my mind that samples made by buoys carried by ocean currents and subject to periodic submersions may not produce an unbiassed sample and some adjustments would be needed. -
Phil at 23:33 PM on 7 September 2010Climate change: Water vapor makes for a wet argument
JohnD, Here is a scenario that might help you understand the energy budget diagram. You and your wife wish to buy presents for your three children; You put in $324, your wife puts in $168. Your baby gets a $24 rattle, your young son gets computer games worth $78 and your recently graduated daughter gets clothes worth $390. (The numbers have, of course, been chosen to match the heat budget ones in Trenberths diagram) Three questions: 1. How much money is left ? 2. How much did you (as opposed to your wife) contribute to each present (3 answers) ? 3. How important is it that your daughter got a present $66 more than you contributed ? -
kdkd at 23:25 PM on 7 September 2010Ocean cooling: skeptic arguments drowned by data
Ken #28 Please explain why in a large complex, difficult to measure system like the ocean, that you never discuss issues relating to measurement uncertainty? This glaring omission really detracts from your argument, and if you want to be taken seriously you need to address it. -
adelady at 23:15 PM on 7 September 2010What do you get when you put a climate scientist and 52 skeptics in a room?
It's worth it. Just one woman publicly said that the bathtub analogy explained the 3% accumulation to her. I'll bet there were a few others, and they all have friends and relatives who'll hear a different story from now on. And many of the others seemed impressed to find that he had neither horns nor tail. -
Ned at 23:06 PM on 7 September 2010Ocean cooling: skeptic arguments drowned by data
macwithoutfries and others: I don't think the latent heat associated with melting ice is large enough to play much role in this question. Unless I'm getting my orders of magnitudes scrambled, melting one gigaton of ice requires 333.55 x 10^17 J. Let's consider both sea ice and land ice. Over the past decade, according to PIOMAS, the Arctic Ocean has lost around 500-1000 km3 of sea ice volume per year, depending on what you pick as starting and ending dates. This works out to around 1.5 to 3 x 10^20 J/year. Sea ice in the southern hemisphere mostly disappears every year, so it's not really relevant. For land ice, NSIDC says that in recent years melting land ice has contributed 1.19 mm/year to global sea level rise (1993-2003 ... presumably more since 2003, but this is good enough for now). This corresponds to 433 gigatons/year, or 1.4 x 10^20 J/year. So ... the latent heat taken up by melting sea and land ice has been on the approximate order of 4 X 10^20 J/year. This is a couple of orders of magnitude smaller than the values being quoted in this thread for upper ocean heat content anomaly. -
BaerbelW at 22:41 PM on 7 September 2010What do you get when you put a climate scientist and 52 skeptics in a room?
The program can now be watched via the "webextra" tab on the SBS-website. I'm not through watching it yet but it for sure is interesting! -
Ken Lambert at 22:33 PM on 7 September 2010Ocean cooling: skeptic arguments drowned by data
HR #14 Good points HR. BP #5 has of course thrown a very big spanner in the OHC works. Moderator John has produced a rerun of the chart of OHC for the top 700m from a prior thread: "Robust warming of the upper oceans" here: http://www.skepticalscience.com/news.php?p=2&t=78&&n=202 Please re-read BP#6,#16,#30,#45,#72, and my own humble contributions #24, #43, #60. I think that we showed that the jump in the OHC chart in the 2002-03 period was impossible; and most probably an artifact of the XBT to Argo transition - ie; an offset. Yet 'scientists' simply did a linear curve fit through this composite chart and called it 0.64W/sq.m rise in OHC equivalent for 16 years. Yet if you average Lyman's 7 curves on the 2010 chart from 2003-2010 - it is pretty flat - strangely coinciding with the full deployment of Argo. Could it be that better Argo measurement has shown little if any OHC increase for the last 7 years? Could that possibly mean that far less extensive and inaccurate XBT measurements prior to 2002 were not very reliable, and that the whole OHC story prior to 2002 is likely to be as useful as a third armpit? Which punches a hole right through the theory of an increasing warming imbalance of the order of 0.9W/sq.m. And you all wonder why there are sceptics? Hello? -
VeryTallGuy at 22:31 PM on 7 September 2010Ocean cooling: skeptic arguments drowned by data
gpwayne@6 Pielke says "with respect to the diagnosis of global warming using Joules of heat accumulation in the oceans, snapshots of heat content at different times are all that is needed. There is no time lag in heating or cooling. The Joules are either there or they are not. The assessment of a long-term linear trend is not needed." Now it strikes me that fundamental here is the variability in the data. Be it via measurement error, bias caused by changing currents, changes in the balance of latent (ice melt) vs sensible heat etc etc, there is inherent variability. Personally, I'd look for changes beyond 2 sigma as a basic test as to whether a claim was significant or not. I'd guess that Pielke's assertion that snapshots are meaningful fails this test, in the same way that BP's use of quarterly data isn't meaningful. I had a quick look for the raw data, but it's in too complex and fragmented a form on the NOAA site for me to run a regression quickly. I'd guess that the natural variability precludes any quantitative use of the data without at least looking at a 5 and maybe 10 -20 year period. Anyone more competent than me able to give us the trend since (say) 1970 and the standard deviation of residuals of the 12 month and three month averages ? Does anyone other than Pielke and BP seriously think individual datapoints can be used as a snapshot to calibrate the overall global heat balance ? -
macwithoutfries at 22:25 PM on 7 September 2010Ocean cooling: skeptic arguments drowned by data
The '2004-2009 anomaly' on which Pielke Sr. clings is probably from the huge latent heat from the arctic ice loss - which also happened to be at a very high level in the 2004-2009 interval - combined with the constant decrease in solar output consistent with the downward trend of the solar cycle! -
Tony O at 22:08 PM on 7 September 2010What do you get when you put a climate scientist and 52 skeptics in a room?
All the usual denier talking points, Stephen Schneider had so much patience. -
Rob Painting at 21:50 PM on 7 September 2010Ocean cooling: skeptic arguments drowned by data
HR @24 - "This is not a mechanism to get the energy to depths were it can't be measured by ARGO." I didn't suggest it was, I would have said so otherwise. Regardless, interesting that such a short lived event "may" be a significant player in ocean heat transport. -
theendisfar at 21:50 PM on 7 September 2010What do you get when you put a climate scientist and 52 skeptics in a room?
What do you get when you put 2 scientists in a room when one is a Skeptic and one is an Advocate of Anthropogenic Global Warning? -
HumanityRules at 21:27 PM on 7 September 2010Ocean cooling: skeptic arguments drowned by data
20.Daniel Bailey From reading his posts I get the feeling Pielke is happy to engage with climate scientists of all shades. I can understand why he wants to avoid moderating comments while at the same time being frustrated by it. 21.gpwayne Erm are we reading the same thing? It's all about science. Can you quote the emotionalism? The only time he gets personnal is to refute your name calling and even then he uses his peer-reviewed work to show your error rather than claims of victimhood. 23.Dappledwater These seem still only to describe mixing in the upper ocean (above 1km). This is not a mechanism to get the energy to depths were it can't be measured by ARGO. -
Rob Painting at 21:14 PM on 7 September 2010Climate change: Water vapor makes for a wet argument
MattJ @71 -"The biggest failing I see in Trenberth's diagram is that although sure, the energies add up as you say, the huge value of energy in backradiation is never explained" scaddenp @72 - "Since it is a pciture of global heat flows, I cant see what you could gain by day/night - its day somewhere, night somewhere." The diagram is clear to me as well, but how many laypeople overlook the contribution of incoming solar radiation? i.e. it only occurs to the side of the Earth facing the sun, whereas back radiation occurs day & night all over the planet?, I'd guess quite a few. -
Paul D at 20:34 PM on 7 September 2010What do you get when you put a climate scientist and 52 skeptics in a room?
I tried viewing the video in the UK, but it isn't streamed live. However I can watch last weeks episode, so the Schneider talk should work later. BTW, the long shots of the studio make it look very futuristic. -
Rob Painting at 20:20 PM on 7 September 2010Ocean cooling: skeptic arguments drowned by data
AT @15 - "It is relatively hard to get warmer water to go DOWN a column of water" More pieces of the puzzle seem to be emerging all the time Observational evidence for an ocean heat pump induced by tropical cyclones (Sriver 2007) & Climate change: Tropical cyclones in the mix -
Rob Painting at 19:38 PM on 7 September 2010Hurricanes And Climate Change: Boy Is This Science Not Settled!
Graham (moderator) @44 - The Elsner 2008 paper doesn't address my question. I'll continue fossicking through the literature on hurricanes, I'm sure you're busy enough. -
RSVP at 17:39 PM on 7 September 2010Ocean cooling: skeptic arguments drowned by data
Dumb question: I would expect "nondenialists" and/or real field experts claim that the methodology for gathering data has improved immensely since the 1950's, and that since there is now more data, the "real" ocean temperature over time is being acquired. Meanwhile, however, it has supposedly been increasing. How does one differentiate these two effects? -
SolarSauna at 16:39 PM on 7 September 2010What do you get when you put a climate scientist and 52 skeptics in a room?
There is an amazing recent talk and video by Steve Schneider at: http://www.edge.org/3rd_culture/schneider08/schneider08_index.html
Prev 2231 2232 2233 2234 2235 2236 2237 2238 2239 2240 2241 2242 2243 2244 2245 2246 Next


