


 Arguments


Recent Comments
Prev 218 219 220 221 222 223 224 225 226 227 228 229 230 231 232 233 Next
Comments 11251 to 11300:
-
JWRebel at 06:25 AM on 13 March 2019Wallace Broecker: Scientists memorialize a titan of climate science
Sorry: [Edit @1] Shift to 100,000 from 41,000 year cycles
-
JWRebel at 06:18 AM on 13 March 2019Wallace Broecker: Scientists memorialize a titan of climate science
Dated 08 Mar 2019
-
JWRebel at 06:17 AM on 13 March 2019Wallace Broecker: Scientists memorialize a titan of climate science
Off topic but related, interesting article on the role of ocean circulation in climate and carbon cycle feed-backs determining ice-age periodicity and the shift from 100,000 to 41,000 year cycles by Hasenfratz et al
http://science.sciencemag.org/content/363/6431/1080/tab-pdf
-
Philippe Chantreau at 01:10 AM on 13 March 201997% consensus on human-caused global warming has been disproven
Good question Postkey. I don't recall anyone ever really be that specific. No quote is provided. And it is, in fact, off topic. This thread is about Anthony Watts' and others assertion that the consensus is based on only one paper, and that said paper was flawed enough to invalidate the results. As usual, Watts is full of it.
-
John Hartz at 01:06 AM on 13 March 2019The temperature evolution after 2016 suggests hotter future
Recommended supplementl reading:
Global Warming ‘Hiatus’ Is the Climate Change Myth That Refuses to Die by Kevin Cowtan & Stephan Lewandowski, DeSmog, Mar 9, 2019
-
Johnboy at 01:02 AM on 13 March 2019The temperature evolution after 2016 suggests hotter future
Great post and comments. Looking at Evan’s plot @1, one could say “ok denialists, let’s ignore El Ninõ years”. What do we have left, a plot of annual temperatures, complete with annual variations, that have warmed about 1°C since 1970.
-
Evan at 00:53 AM on 13 March 20192019 SkS Weekly Climate Change & Global Warming Digest #10
The politicians only get to be politicians if they are elected, regardless of how much money they raise. If we stop electing climate-change deniers, we might start making progress.
-
Evan at 23:33 PM on 12 March 2019The temperature evolution after 2016 suggests hotter future
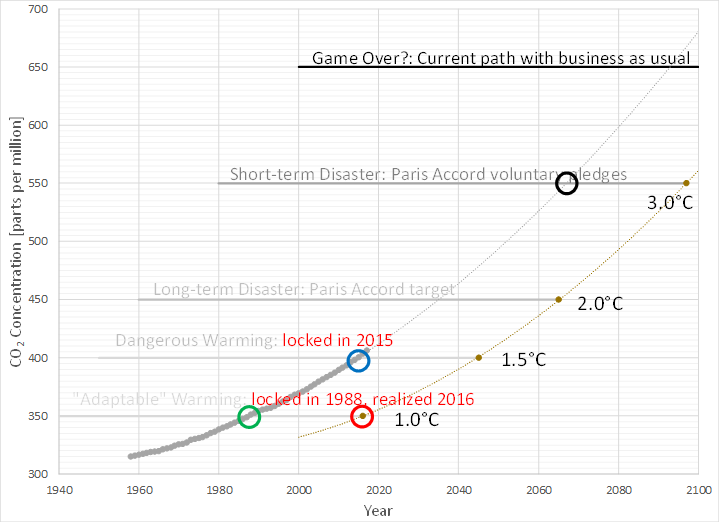
SirCharles@6 Interesting graph. It would require 0.5C of warming in the 2020's, vs the 0.2C/decade of warming that we've typically experienced. Anything is possible, but I've struggled with this kind of messaging. I decided to base my projections on the Keeling Curve, because if you fit 60 years of CO2 data you get a quadratic function that fits the data with a fitting parameter of 0.99 (1.0 represents a perfect fit). We are trying to motivate action based on the most solid evidence we have, and I think the Keeling curve comes about as close as we can to solid data that we can use to confidently project what will happen if we don't take drastic action.
I'm not suggesting your curve is wrong. I am simply suggesting that the Keeling curve on its own is scary enough to motivate action, and it is based on 60 years of solid evidence of how the entire system (humans + nature) has been responding.
The gray data points that are mushed together to form a thick, gray line from 1958 to 2018 is the data for the Keeling curve. The thin curve on the left shows rising CO2 projected into the future based on a fit of the 60-year Keeling curve and indicates when we are projected to lock in particular temperature anomalies based on a climate sensitivity of 3C/doubling CO2. The curve on the right projects when we will realize that temperature anomaly, based on a 30-year time lag between commitment and realization.
-
Speno at 23:01 PM on 12 March 2019Water vapor is the most powerful greenhouse gas
And to whoever asked, a positive feedback loop isn't necessarily runaway. It can give diminishing returns, due to many other factors at play. Which would be why we don't see runaway heating from water vapour
-
Speno at 22:55 PM on 12 March 2019Water vapor is the most powerful greenhouse gas
Which also addresses Mizimi's comment about how animals make a bigger difference in terms of heat. I havent confirmed anything on that study, but methane doesn't last in the air for the same amount of time CO2 does, it's significantly shorter. Thus it is already in a stable equilibrium. As more methane is put In, the old methane is coming out of the system at the same time. Its not the same for CO2 as we haven't been putting it in the system at a stable rate for long enough that the oldest will start coming out of the system.
-
Speno at 22:49 PM on 12 March 2019Water vapor is the most powerful greenhouse gas
I'll also add that even if water vapour wasn't a positive feedback loop, it doesn't matter if water vapour keeps in a huge amount of heat compared to CO2, That doesn't somehow make the CO2 induced warming insignificant. Such a claim is trying to trick you by warping your perspective.
-
SirCharles at 22:33 PM on 12 March 2019The temperature evolution after 2016 suggests hotter future

-
Postkey at 19:43 PM on 12 March 201997% consensus on human-caused global warming has been disproven
"The problem is when people use the study and try to state 97% believe +50% of warming is CO2 and that its dangerous (President Obama and the authors)."
Are there 'people' that use the study and try to state 97% believe +50% of warming is CO2 and that its dangerous (President Obama and the authors)."
-
Ari Jokimäki at 16:49 PM on 12 March 2019The temperature evolution after 2016 suggests hotter future
Thanks all! Nigelj, to me the graphs open up clearly larger, and for example the texts on them are easy to read, so I suggest it might have to do something with your browser. If others have problems with graphs, let me know.
-
scaddenp at 13:19 PM on 12 March 2019The temperature evolution after 2016 suggests hotter future
BOb, the trouble is, that pseudo-skeptics and misinformers are doing exactly the same thing.
-
Bob Loblaw at 11:31 AM on 12 March 2019The temperature evolution after 2016 suggests hotter future
Yes, well-done Ari.
As for the "no warming since..." gambit, I mentioned this previous SkS comment a couple of weeks ago over at Tamino's, but it is worth pointing to it again. From July 2016:
...and here is the image it contained:

-
Daniel Bailey at 08:31 AM on 12 March 201997% consensus on human-caused global warming has been disproven
"There is no significant disagreement on the main points in the scientific community"
Indeed, the evidence for AGW is as robust as for Auschwitz.
Abundant attribution studies show that pretty much all of the observed warming since the 1950s is from human activities, primarily via the human burning of fossil fuels. This is a more appropriate thread for you to read on that, including the comments.
-
scaddenp at 08:15 AM on 12 March 201997% consensus on human-caused global warming has been disproven
"We" go with what the published science supports. The ECS is estimated at around 3 and there is no way to realize that over such a short time period. If you want to argue for low sensitivity, then do so here or here (after first reading the article and associated papers)
The point of the consensus study is to show that a scientific consensus exists and that it is strong. What would be your alternative basis for policy in any field? I find it hard to believe you would advocate government policy follow the extreme fringe in say medicine, building standards, etc. The consensus might be wrong even if very strong but this is rare and no basis for policy.
If you believe part of the warming is natural, (and hopefully you also believe in conservation of energy), then perhaps you might indicate which natural source do think is providing the extra energy?
-
Philippe Chantreau at 07:48 AM on 12 March 201997% consensus on human-caused global warming has been disproven
Perhaps the whole argument is ridiculous but quite frequent. We've seen it here countless times, as well as other of the type "it's not warming." That one is gone for now but give a couple more years following the massive 2016 El Nino and it will be back. It's been a very common piece of BS to attempt arguing that there is disagreement in the scientific community. It comes in fact more regularly than others because those who use it know that the general population is not educated enough to tell it's BS. There is no significant disagreement on the main points in the scientific community.
As for the equilibrium sensitivity for doubling, there is abundant scientific litterature suggesting that 1 degree is unrealistically low. If you want to argue further on that, there is probably a more appropriate thread.
-
pmcvay at 06:57 AM on 12 March 201997% consensus on human-caused global warming has been disproven
The whole argument is ridiculous. Every skeptic (denier) i know including myself falls within category 1 or 2. There may be a few category 3s but none I know. The problem is when people use the study and try to state 97% believe +50% of warming is CO2 and that its dangerous (President Obama and the authors). The study does not support this.
The real debate is over sensitivity for doubling CO2. Is it around 1 degree C as most skeptics believe or 3,4 or 10 as most of you seem to believe? The models and the theory were tuned during a 30 year natural warming period. The future will tell. I could point out that since 1955 we have had enough CO2 increase to cause 1/2 of doubling warming and warming has been about .6 C degrees. I believe part of this warming was natural so I see no reason to move off my 1 C degree number.
-
nigelj at 05:15 AM on 12 March 2019The temperature evolution after 2016 suggests hotter future
Yeah good article. However the link to the bigger graph is not much of a bigger graph, and is hard to read (unless my browser is playing up).
The denialists are wrong to argue we are back to alleged pause temperatures as can be seen in the global temeprature record here.
I wouldn't worry too much about the denialists. I would suggest most people looking at that NASA graph (or Hadcrut) can see the pause was inconsequential and about 6 - 8 years long in terms of surface warming, and the trend in the latest graph is towards continued warming especially when you look at the lowess smoothing line. People do basic graphs in maths at school and would understand things can be bumpy but its the longer term trend we look at. The only people who won't get this are extremely poorly educated people, and those determined not to grasp it, because of ideological or other reasons that make them sceptical of the science. Of course they should still be refuted.
There was a problem when warming did look flat after 1998 that required complicated but correct explanations about natural variability, but that period is obviously over looking at the NASA graph. It also has to be said the so called pause was never long enough or strong enough to suggest the underlying greenhouse gas warming process had somehow stopped, or that some unexpected natural process had taken over the climate. It's just that because of el nino / la nina we end up with a bumpy graph that looks like an escalator.
The point I'm making is while the article is excellent and of interest to enquiring minds, things have to also be kept simple from the general publics perspective, and a simple graph says a lot to me. I think most educated people looking at the latest NASA graph would see an obvious continuing warming trend.
-
william5331 at 05:14 AM on 12 March 20192019 SkS Weekly Climate Change & Global Warming Digest #10
Politicians will not listen to the children. They will only listen to the people who will finance their next election campaign. Who Pays the Piper Calls the Tune. The solution is obvious.
-
Evan at 03:45 AM on 12 March 2019The temperature evolution after 2016 suggests hotter future
Great post Ari.
I've posted the following graph below, but in light of Ari's work, I feel it is worth repeating. If we plot temperature anomaly and fit a line to it, and then take the highest temperature anomaly in each decade and fit a line to it, the two lines are parallel. The implication is that as Ari and others suggest, there are years of peak warming because of the El Nino cycle, but the trend of these peak temperatures appears to be the same as the trend for the entire data set.
No surprise, but just another way to look at the data, and another way to counter the argument that we are cooling.

-
michael sweet at 22:46 PM on 11 March 2019Earth’s oceans are routinely breaking heat records
Dr. C,
Your question is difficult to understand. You seem to suggest that as the ocean warms, more CO2 will dissolve in it.
This notion is mistaken. As the temperature of a liquid increases the solubility of a gas in the liquid decreases. Specifically, as the temperature of the ocean increases the solubility of gasses in the ocean decreases.
That means that as the ocean temperature increases it will outgas CO2 and lead to more CO2 in the atmosphere. Human emissions are so large that this effect is negligible so far.
An additional problem is that increasing ocean temperatures means less oxygen dissolved in the ocean which kills fish and other organisms. This effect is significant and parts of the ocean, especially the tropics and the deep ocean, are becoming more depleted in oxygen.
I have very strong recollections of boiling water in General Chemistry lab to remove the CO2 for use in titrations. Hot water does not hold gasses.
The moderator refers to the fact that as the gas pressure increases more gas dissolves in the ocean. This effect causes much more CO2 to dissolve in the ocean, about 25% of released CO2, and causes increased ocean acidification. If you do not mind ocean acidification killing all the fish than this effect does reduce air concentrations of CO2. If humans stopped emitting CO2 today the atmospheric concentration of CO2 would decrease as the deep ocean absorbed more CO2 due to the concentrations effect.
Does that answser your question?
-
John Hartz at 13:00 PM on 11 March 2019What's in the Green New Deal? Four key issues to understand
Recommended supplemental reading:
The Green New Deal: One climate scientist’s view, from the other side of the Atlantic by Myles Allen, Bulletin of the Atomic Scientists, Mar 8, 2019
-
scaddenp at 12:36 PM on 11 March 2019What's in the Green New Deal? Four key issues to understand
Hmm, I see over at desmogblog, that there are some democrats with views that I think are more realistic.
Mike Bloomberg, former New York City Mayor, criticized the GND in a statement announcing he would not run for president. "The idea of a Green New Deal — first suggested by the columnist Tom Friedman more than a decade ago — stands no chance of passage in the Senate over the next two years. But Mother Nature does not wait on our political calendar, and neither can we,” he wrote.
Former congressman John Delaney (D-MD), meanwhile, has been vocally critical of the GND. In a pair of tweets from February 14, Delaney called the GND “a step backwards in fighting climate change because its unrealistic goals and linkage to other unrelated policies will make it harder to do anything.”
“The Green New Deal as it has been proposed is about as realistic as Trump saying that Mexico is going to pay for the wall,” he tweeted.
Delaney argued that his opposition to the GND revolves around the sweeping scope with which the resolution ties climate change policy to other big reforms. “I actually don’t think the Green New Deal is the way to go,” he said in an interview with The Hill. “The reason is that I want to do something about fixing climate change tomorrow. I don’t want to tie it to fixing health care.”
All good points.
-
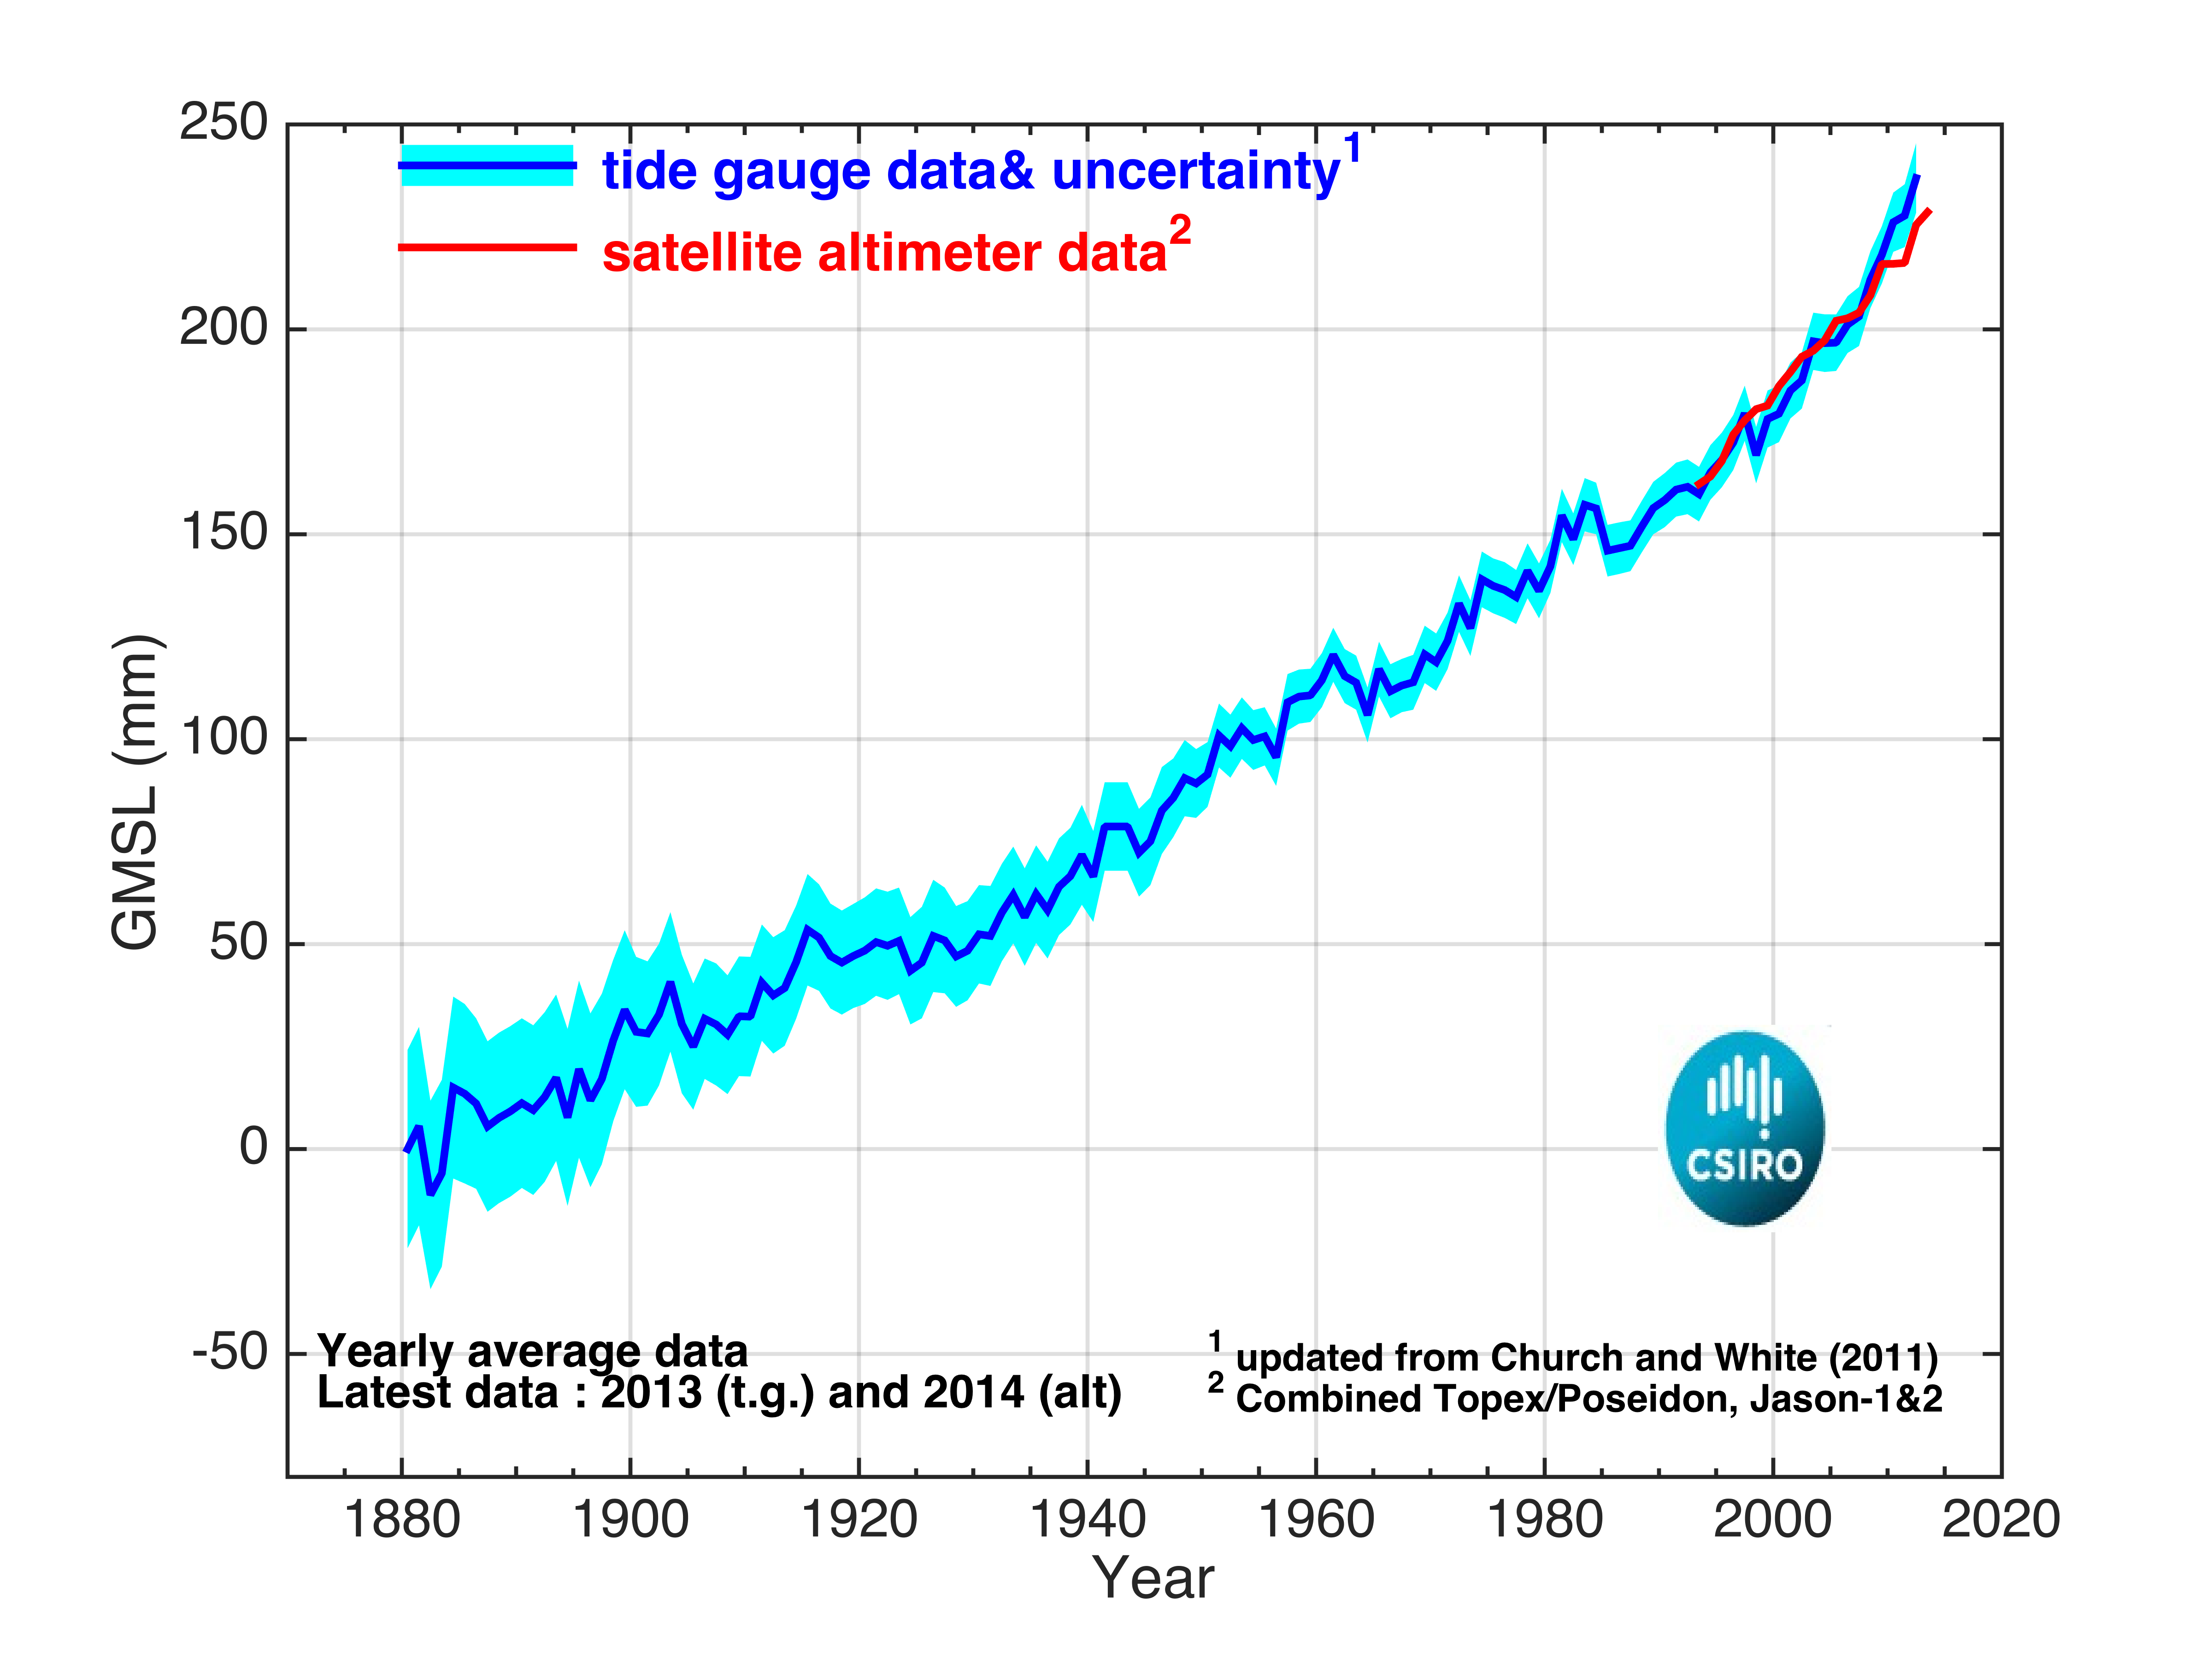
scaddenp at 06:09 AM on 11 March 2019Sea level rise is exaggerated
Here is better comparison of satellite and tide guage data from CSIRO.
-
scaddenp at 05:58 AM on 11 March 2019Sea level rise is exaggerated
Sealevel rise is not even across the globe.
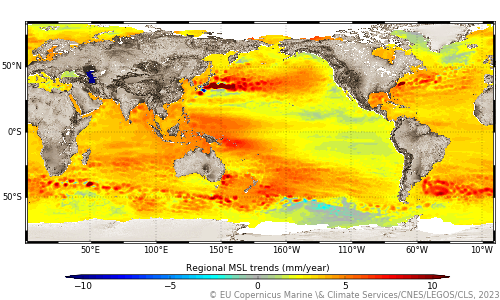
Note that sealevel measured from satellite altimetry is based on height change with respect to the reference ellipsoid, avoiding the issue of subsidence or tectonics which plague tide guages (though both measurements systems yield comparable results).
Sealevels are falling close to melting ice thanks to reduced gravitional attraction and isostatic rebound. See here for more detailed explanation.
-
Mal Adapted at 05:39 AM on 11 March 2019Next self-paced run of Denial101x starts on March 5
Tangentially to my last: I recently came across Charles David Keeling's 1998 autobiographical sketch. Great stuff. His contribution to the modern understanding of climate change was immense.
-
Mal Adapted at 05:27 AM on 11 March 2019Next self-paced run of Denial101x starts on March 5
Alonerock,
Ben Davidson's claim that climate scientists ignore substantial incident energy fluxes is simply false: see this Oregon State University tutorial.
In any case, attribution of the recent, accelerating rise of global mean surface temperature to enhanced 'greenhouse' forcing is based on the radiative properties of the oceans, land and atmosphere. During the last 60 years, GMST has risen by more 0.9 degrees C (Berkeley Earth dataset), while atmospheric CO2 has increased from 315 ppm to 410 ppm (the Keeling curve). No significant trend in incident energy can be shown in that interval, however: thus the proportional contributions of the regions of the incident EM spectrum, along with high energy particle fluxes, are not relevant.
-
Bob Loblaw at 02:29 AM on 11 March 2019Freedom of Information (FOI) requests were ignored
To address the specific quote that Rogue provides in #17:
The quote should be interpreted as an indication that the single "temperature" value provided by the UAH model calculations (based on satellete-measured atmospheric radiation emissions - AKA brightness) are dependent on atmospheric conditions over the layer from the surface to roughly 8km. The value is not equally-weighted for all heights within that range. Spencer's web site shows the weighting for the various model values they produce:
")
-
DrC at 02:29 AM on 11 March 2019Earth’s oceans are routinely breaking heat records
As this is your first post, Skeptical Science respectfully reminds you to please follow our comments policy. Thank You!
I signed up for this site because of some fascinating scientific dialogue from 2010. Wow, has the tenor changed.
My understanding of the functioning of the oceans/atmosphere interaction is that 99% of the carbon dioxide of the surface of the earth is dissolved in the oceans. Therefore one must assume that the oceans act as a buffer in large measure for the amount of carbon dioxide in the atmosphere. Am I mistaken, or is it not true that as the temperature of a liquid increases its capacity for dissolved gases increases up to a point of the liquid becoming a gas itself, boiling. As such, I think it is reasonable to expect a very small rise in the temperature of the ocean to cause a rather massive affect on a relatively small amount of carbon dioxide in the atmosphere. Has this been studied? Does anyone have any references to address this functioning of the ocean as a CO2 buffer?
Moderator Response:[TD] The amount of CO2 able to be held by the oceans is a function of not only the temperature of the ocean, but the amount of CO2 in the atmosphere. For details, in the left margin below the thermometer, click the "OA not OK" button.
-
Daniel Bailey at 01:34 AM on 11 March 2019Freedom of Information (FOI) requests were ignored
I would consider the satellite termperature record a useful supplement to the surface temperature record, but only as a supplement to it.
Other instrument packages on the satellite platforms are a great deal more useful.
-
Eclectic at 00:45 AM on 11 March 2019Freedom of Information (FOI) requests were ignored
Roque ,
If I understand Daniel's comment correctly :- you should pay little or no attention to the satellite record ~ it measures the air temperature (at best) at high altitude . . . say like the uppermost part of Mount Everest . . . which is of small relevance to the important global surface warming [land and ocean] where humans, plants, animals and fish, are living.
Worse, the satellite record is sometimes quoted with the intention of deceiving the uninformed citizen. If you follow the satellite record, you will notice that it tends to lag the surface temperatures by a number of months ~ so it adds little to the more accurate surface temperature records. Overall, the satellites have been disappointing / borderline useless.
-
Daniel Bailey at 00:39 AM on 11 March 2019Antarctica is too cold to lose ice
As Eclectic notes, do not post the same comment on more than 1 page here. Put it on the most appropriate thread and wait for feedback.
Repeated from the other thread, augmented by extra content in response to the Schroeder paper:The paper itself makes it clear that this result only applies to the area of the Thwaites Glacier. Not the WAIS in its entirety nor the rest of the Antarctic Ice Sheet, all of which are showing significant mass losses. Per the PAPER:
"We estimate a minimum average geothermal flux value of about 114 mW/m2 with a notional uncertainty of about 10 mW/m2 for the Thwaites Glacier catchment with areas exceeding 200 mW/m2"
So not a lot more than actual mean heat flows of continents and oceans, which are 65 and 101 mW m−2, respectively. And just in the area of Thwaites Glacier. A very tiny subset of the WAIS, itself a small portion of the overall Antarctic Ice Sheet.
Further, the authors of the paper have themselves repudiated misinterpretations of their paper:
"Dear Cryolist,
The last couple of days have been interesting. What seemed like an innocuous chat with a San Antonio AM radio station about the findings of our new paper on geothermal flux under Thwaites Glacier rapidly turned into a confusing internet news story on how we had disproven anthropogenic global warming (this news story has now been taken down at our request). This is obviously not the case.
For the record:
-Our study has no bearing on whether or not anthropogenic global warning is occurring.
-The amount of basal melting we find, although elevated compared to typical values estimated for Antarctica, is minor compared with both ice flux over the grounding line, snow fall in the catchment, and near the grounding line, the implied geothermal melting is small compared to the ice lost observed through various methods.
-We believe the main effect of this elevated heat flow is on the distribution and evolution of basal traction in the catchment. There may be a role for time varying interior boundary conditions to influence ice dynamics, complementing the now well established links to ice shelf thinning and ocean dynamics.
By and large, the media response to the paper has been accurate, but there obviously have been some outliers."
Cheers,
Duncan Young, Don Blankenship, Enrica Quartini and Dustin Schroeder
Additionally, vulcanism has been present in Antarctica for well over 50 million years.
The ice sheet there formed 34 million years ago, and persisted since, in spite of that vulcanism. A subglacial heat mantle plume would have produced detectable subglacial drainage and melting events. None has been detected for the Pine Island Glacier and the adjacent Thwaites Glacier has proven largely insensitive to the presence of such a mantle heat source:
And
The heat coming from the geothermal activities under the ice is not a whole lot more than that coming from a dormant volcano.
People walk on dormant volcanoes. Trees grow on them.
In Antarctica, ice forms on them.
Marie Byrd Land
The volcanic heat plume mentioned under the ice of a portion of Antarctica is fossil heat; its last activity predates the formation of the Antarctic Ice Sheet (itself more than 34 million years old).
So the ice in the area formed anyway, in spite of the supposed "volcano".
Influence of a West Antarctic mantle plume on ice sheet basal conditions
-
roque at 00:30 AM on 11 March 2019Sea level rise is exaggerated
Do an Earth mean sea level has any real meaning ?
https://www.psmsl.org/products/trends/
 Moderator Response:
[DB] As a professional nautical cartographer, I can assure you that mean sea level has a concrete meaning. If you have an actual question, please be more specific.
Reduced image width (keep image widths below 500 to avoid breaking page formatting).
-
Daniel Bailey at 00:29 AM on 11 March 2019Antarctica is gaining ice
Vulcanism has been present in Antarctica for well over 50 million years.
The ice sheet there formed 34 million years ago, and persisted since, in spite of that vulcanism. A subglacial heat mantle plume would have produced detectable subglacial drainage and melting events. None has been detected for the Pine Island Glacier and the adjacent Thwaites Glacier has proven largely insensitive to the presence of such a mantle heat source:
And
The heat coming from the geothermal activities under the ice is not a whole lot more than that coming from a dormant volcano.
People walk on dormant volcanoes. Trees grow on them.
In Antarctica, ice forms on them.
Marie Byrd Land
The volcanic heat plume mentioned under the ice of a portion of Antarctica is fossil heat; its last activity predates the formation of the Antarctic Ice Sheet (itself more than 34 million years old).
So the ice in the area formed anyway, in spite of the supposed "volcano".
Influence of a West Antarctic mantle plume on ice sheet basal conditions
-
Eclectic at 00:26 AM on 11 March 2019Antarctica is too cold to lose ice
btw Roque , it is best to keep your comments on one thread, not spread between two threads . . . which gets messy and confusing.
I have replied on your other thread. (The issue is a nothingburger, basically. But sea-level rise might increase faster, if, as some suggest, AGW-caused melting of West Antarctic ice leaves a lighter weight of ice . . . which might allow an increase in volcanic activity undereneath. )
-
Daniel Bailey at 00:21 AM on 11 March 2019Freedom of Information (FOI) requests were ignored
1. Satellite sensors measure brightness, not temperatures. Temperatures can be inferred from brightness, but there are numerous "corrections" and "adjustments" to the raw data that must take place prior to these inferred numbers being considered reliable. The corrections to the satellite data vastly outweigh the minor changes to the surface station data during the homogenization process.
2. Data series span multiple generations of orbital platforms. A tremendous amount of "corrections" and "adjustments" to the data are needed for these time series to become long enough to achieve statistical significance.
3. The one data channel that some favor among all the satellite data channels is that of the TLT. This is nominally of the lower troposphere. The TLT channel is a synthetic (derived) product, and not a measured product. Further, it is not a measurement of the surface (where people live), but of the lower troposphere (where airplanes fly). Thus, it CANNOT be used to compare to surface temperatures.
4. The known uncertainties in the satellite trend, as estimated by the record providers, are five times the known uncertainties in the thermometer record trend.
5. Thermometer measurements from ground-based and radiosonde instrument packages are still the gold standard. Note that the radiosonde temperature series goes back to 1958, so it's a longer and more robust series than is the satellite record. It shows continued warming of the lower troposphere.
In summary:
1. Satellites don't measure temperatures, they measure brightness
2. Satellites don't measure the surface temperatures, where people live
3. Satellites measure brightness of the air thousands of feet above the surface, where birds and airplanes fly
4. Satellites convert brightness to temperatures via computer models
5. The known uncertainties in the satellite trend, as estimated by the record providers, are five times the known uncertainties in the thermometer record trend. -
roque at 00:16 AM on 11 March 2019Freedom of Information (FOI) requests were ignored
I do not understand above comments as I found on UAH website : "The satellite-based instruments measure the temperature of the atmosphere from the surface up to an altitude of about eight kilometers above sea level."
-
Eclectic at 00:10 AM on 11 March 2019Antarctica is gaining ice
Roque @484 ,
you can get more information from the University of Washington, which studies this area.
If I understand it correctly, there was no suggestion that the 91 previously unknown volcanoes were new (i.e. producing additional new heat to melt the overlying ice). So presumably all the local volcanoes have been producing heat for thousands of years ~ not much changed over the 5-6000 years demonstrated in the glacial records there.
But do note that there is a possibility that, as AGW causes more melting, there will be less weight of ice pressing down on the volcanic areas . . . and the volcanoes might therefore be able to increase their activity in the future (contributing to even faster ice melt & sea-level rise over an uncertain period). This is just one more of the uncertainties about rate of sea-level rise over the next century or more.
-
roque at 23:50 PM on 10 March 2019Antarctica is too cold to lose ice
In addition to my previous post : Evidence for elevated and spatially variable geothermal flux beneath the West Antarctic Ice Sheet
https://www.pnas.org/content/111/25/9070
" Our results further suggest that the subglacial water system of Thwaites Glacier may be responding to heterogeneous and temporally variable basal melting driven by the evolution of rift-associated volcanism and support the hypothesis that both heterogeneous geothermal flux (6) and local magmatic processes (5) could be critical factors in determining the future behavior of the WAIS." -
roque at 23:43 PM on 10 March 2019Antarctica is too cold to lose ice
It seems the melting of the land ice of the west coast has to be found in the volcanoes underneath the glaciers that have been discovered, not in human activity. A 2017 study claimed to have found 138 volcanoes, of which 91 were previously unknown. See :
https://sp.lyellcollection.org/content/early/2017/05/26/SP461.7
-
roque at 20:50 PM on 10 March 2019Antarctica is gaining ice
It seems the melting of the land ice of the west coast has to be found in the volcanoes that have been discovered not in the human activity. A 2017 study claimed to have found 138 volcanoes, of which 91 were previously unknown. See :
https://sp.lyellcollection.org/content/early/2017/05/26/SP461.7
-
MA Rodger at 18:58 PM on 10 March 2019Next self-paced run of Denial101x starts on March 5
Alonerock @46,
As nigelj @47/48, I too have not seen the need to watch the whole video (or actually listen - I was multi-tasking). I managed 9 minutes of the forty.
The speaker sets out that Total Slar Irradiance dips by up to 0.3% during a solar storm and also that this is not a good measure of the Climate Forcing for such an event. Indeed, it is argued the dip is likely the opposite - an increase in Climate Forcing. Further, this 0.3% dip in TSI is of the same magnitude as AGW and the only way we can assess AGW is by subtracting the natural Climate Forcings. Thus we have a problem if the natural Climate Forcing is so poorly accounted.
The speaker seems to be on the path of attributing recent global warming, not to AGW, but to the 0.3% dips in TSI which are not dips at all.
And the problems with such a proposal are:-
(1) The 0.3% occurs for just a day or two every few years (that is the major ones - the biggest by far was 0.3% or 4Wm^-2 and occurred once for three days back in 2003) while the assumption (which would make the 0.3% significant) is that such events are working 24/7/365, as is AGW.
(2) If such events were being mis-accounted by climatology (as claimed) and they were significant (as claimed), it would have to be demonstrated that such events are coincidental with the global warming. Thus these storms must be absent prior to 1970. And the warming must appear in the weeks months following these occasional events. The pre-satellite era has no such data but satellite data shows no indication of a post-1970 phenomenon having just started in 1976. And the best of luck matching the magnitude and timing of these big solar flares with climate warming. (The 2003 flare was followed by nothing of note bar several 2004 months that were rather cooler than previous.)
-
nigelj at 14:17 PM on 10 March 2019Next self-paced run of Denial101x starts on March 5
Alonerock
Correction. Ben Davidson appears to be claiming climate scientists only consider the UV component of solar irradiance, and ignore the rest so radio waves, xrays, gamma rays, cosmic rays and that they also ignore the solar wind and high energy protons (I confess dont know what high energy protons are about). But as I said scientists obviously don't see these as significant in warming, and they are the experts.
-
nigelj at 13:13 PM on 10 March 2019Next self-paced run of Denial101x starts on March 5
Alonerock
Regarding the Ben Davidson video. I've read somewhere that the guy is a lawyer, a science sceptic, and a conspiracy theorest, and it all goes beyond climate change.
I didn't watch his video in full. I gave it 15 minutes, and he is obviously not a scientist. His main argument appears to be scientists only consider impacts on earths climate of total solar irradiance and ignore other emissions from the sun including he claims xrays, solar winds, magnetic fluxes and high energy protons and their possible effects on warming. I'm not a physicist, but I would hazard a fairly confident guess that scientists ignore this material because these things have no bearing on earths climate, or are insignificant.
Physicists know what impact different forms of particles and radiation have, because it's in their training, and so they don't waste time with non starters. In addition there would have to be some proof that these fluxes have changed substantially since the 1980s when warming really started in earnest, and davidson provides none. Instead he just goes on about 11 year cycles and yearly cycles which can't explain a change over a sustained 50 year period of warming. His theories are all just crazy stuff.
I mean I'm not going to waste my time watching his numerous long videos on all sorts of scientific issues. The guy is a lawyer so is hardly likely to have anything credible to say on particle physics, and has proven he is not a logical thinker and is captured by motivated reasoning as below:
-
alonerock at 11:37 AM on 10 March 2019Next self-paced run of Denial101x starts on March 5
Can someone please comment on the flaws in this "Fatal flaw in climate change science" video on youtube for me ?
https://www.youtube.com/watch?v=NYoOcaqCzxo
He seems to almost totally ignore discussing CO2 and thousands of years of data that does not fit his agenda. Is this person speaking Ben Davidson, and whoever it is, what are his credentials?
Thanks in advance for any help any of you are willing to porovide to me, and I understand if everyone is too busy. I will work on this on my own as well.
-
Eclectic at 09:45 AM on 10 March 2019Next self-paced run of Denial101x starts on March 5
Fair enough, PhilippeC .
As far as pattern recognition :- one of my favorite signs of denialism is the rhetorical mention of Galileo or Einstein or Feynman or Popper [Popper, in reference to "falsifiability"]. That's almost an infallible sign of failure of logic (either as Dunning-Krugerism, and/or insincerity).
I'd be grateful if you Philippe, Nigelj, or anyone else, could suggest some other prominent names to add to the list.
Over the years, despite hundreds of cases of faux-skeptics claiming that they have valid evidence or valid references supporting their "position", I have never encountered even a single one who could bring forward any valid evidence. Typically all they have is deluded, pseudo-scientific ideas and/or tinfoil-hat conspiracy ideation. Crackpot , Shill , or Conspiracist . . . or a combination thereof.
So I am not holding my breath in waiting for Prometheus's revelations (if they come at all).
-
nigelj at 05:44 AM on 10 March 2019Next self-paced run of Denial101x starts on March 5
Phillipe Chantreau @42 &43
I'm not impressed with Prometheus statements either, as is probably apparent. However I tried to be reasonably non combative, and give him a few points, bearing in mind brutal rhetoric makes us look adversarial.
It probably comes down to what he means by "psychological denial". I have to assume he just didn't like the examples of logical fallacies and felt they didn't apply to his scientific scepticism. However his rhetoric on bias and politics is full of the same logical fallacies! Did you notice this?
Prometheus was one of the Greek Gods. A trickster.
However its really important people understand at no point did the article suggest all scientific scepticism was based on logical fallacies, just that they are common in the climate scepticism issue. I think more attention should have been placed on these fallacies much earlier in all mass media discussions on the climate issue.
He suggests this website stay away from politics and fills his own comments with politics. He is trying to have things both ways.
Anyway you don't need to defend yourself to me. Prometheus raised the issue of alleged relevant sceptical arguments, so its reasonable to ask for a few examples. He raised the claim of bias and has now tried to claim its off topic and all our fault for concentrating on it. I think he's just running away from the issue because he has no real case.
He would need to show systemic bias in the way government agencies do science. So far all he is come up with are a couple of unrelated operational matters and some 50 year old quote by Einstein that has no real relevance to the issue at hand. And contrary to Prometheus assertions Einstein would have understood logical fallacies perfectly well. They are nothing to do with free speech issues as such.
However if Prometheus is out there he can make some comments on the open threads like the weekly digest but he must expect to be challenged and not see this as adversity (in the negative sense).
An easy case can be made that corporate sponsered scientific research is likely to have more bias than any government funding mechanism and / or agency. I think Prometheus sounds like he / she has libertarian views suspicious of government, and this can easily move from healthy suspicion to tin foil hat material. If Prometheus disagrees explain in detail, and stop dodging the issue with silly claims people are not being constructive.
There's no evidene of systemic bias in government sponsered research and here is a list of some of the astonishing scientific achievements and technology spinoffs just from the NASA programme alone.
Prev 218 219 220 221 222 223 224 225 226 227 228 229 230 231 232 233 Next


