


 Arguments


Recent Comments
Prev 2348 2349 2350 2351 2352 2353 2354 2355 2356 2357 2358 2359 2360 2361 2362 2363 Next
Comments 117751 to 117800:
-
Berényi Péter at 18:05 PM on 25 June 2010Ocean acidification
Compare it to distribution of Chlorophyll a concentration along the tropics. Notice huge deep blue desert in south Pacific with rather high pH. At higher latitudes it's a different story, as CO2 solubility increases with decreasing water temperature.
-
Berényi Péter at 17:30 PM on 25 June 2010How many climate scientists are climate skeptics?
Re: Moderator Response: The last several comments already are collected together. Click the "Recent Comments" link in the blue horizontal bar that is at the top of every page. Each comment's time-date stamp is a link to that particular comment's original location.Thanks, I haven't noticed. It helps a lot. As soon as people start using it the discussion can get more focused. -
Doug Bostrom at 16:19 PM on 25 June 2010September 2010 Arctic Ice Extent Handicapping Via ARCUS
Further to HR's thoughts about psychological influences on predictions, I took a closer look at the rationales and methods described in the supporting material for the SEARCH collection. With the exception of Wilson and Wellman it's hard to see where the psych angle fits in. I suspect the undershoots have a lot to do w/the statistical input to the various models in play but I don't have the chops to prove that, rather I'll just surmise that if the trajectory of past statistics is overwhelmed by variability expressing itself as an upswing the upshot would tend to be an undershoot. Doubtless the expert cohort in the SEARCH participants could help to clarify that. -
Berényi Péter at 15:57 PM on 25 June 2010Ocean acidification
#34 VoxRat at 09:47 AM on 25 June, 2010 Do you know what the pH was? Yessir!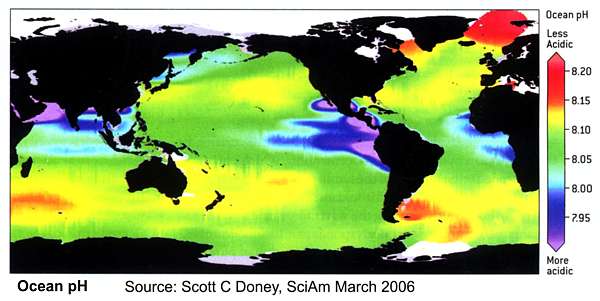 Guess where upwelling occurs.
-
RSVP at 15:38 PM on 25 June 2010How Jo Nova doesn't get past climate change
<> Quite prophetic assuming this was before the internet (for the first part of the quote), and more so if you consider how quickly certain comments on this site get deleted. -
scaddenp at 14:16 PM on 25 June 2010September 2010 Arctic Ice Extent Handicapping Via ARCUS
"Sept/Oct 2007 levels that caused panic at the IPCC". Reference please for this "IPCC panic". However the rate of decline in ice is getting well beyond IPCC predictions so it is a cause for concern if it persists. -
Neven at 14:06 PM on 25 June 2010September 2010 Arctic Ice Extent Handicapping Via ARCUS
Panic at the IPCC? The IPCC is like 50 years behind the current trend. No, the IPCC is much too skeptic on this point (and on sea level rise). I have passed the phase of apeshit. I don't the envy all the people who still have it in front them. I had several years to digest it. ;-) -
gallopingcamel at 13:57 PM on 25 June 2010September 2010 Arctic Ice Extent Handicapping Via ARCUS
Given that the ice sheet extent is on track to dip below the record low Sept/Oct 2007 levels that caused panic at the IPCC, you folks are showing admirable restraint. Nobody is going ape s**t. As usual BP is way above my pay grade but I will keep coming back in the hope that my grey cells will improve. -
Neven at 13:44 PM on 25 June 2010September 2010 Arctic Ice Extent Handicapping Via ARCUS
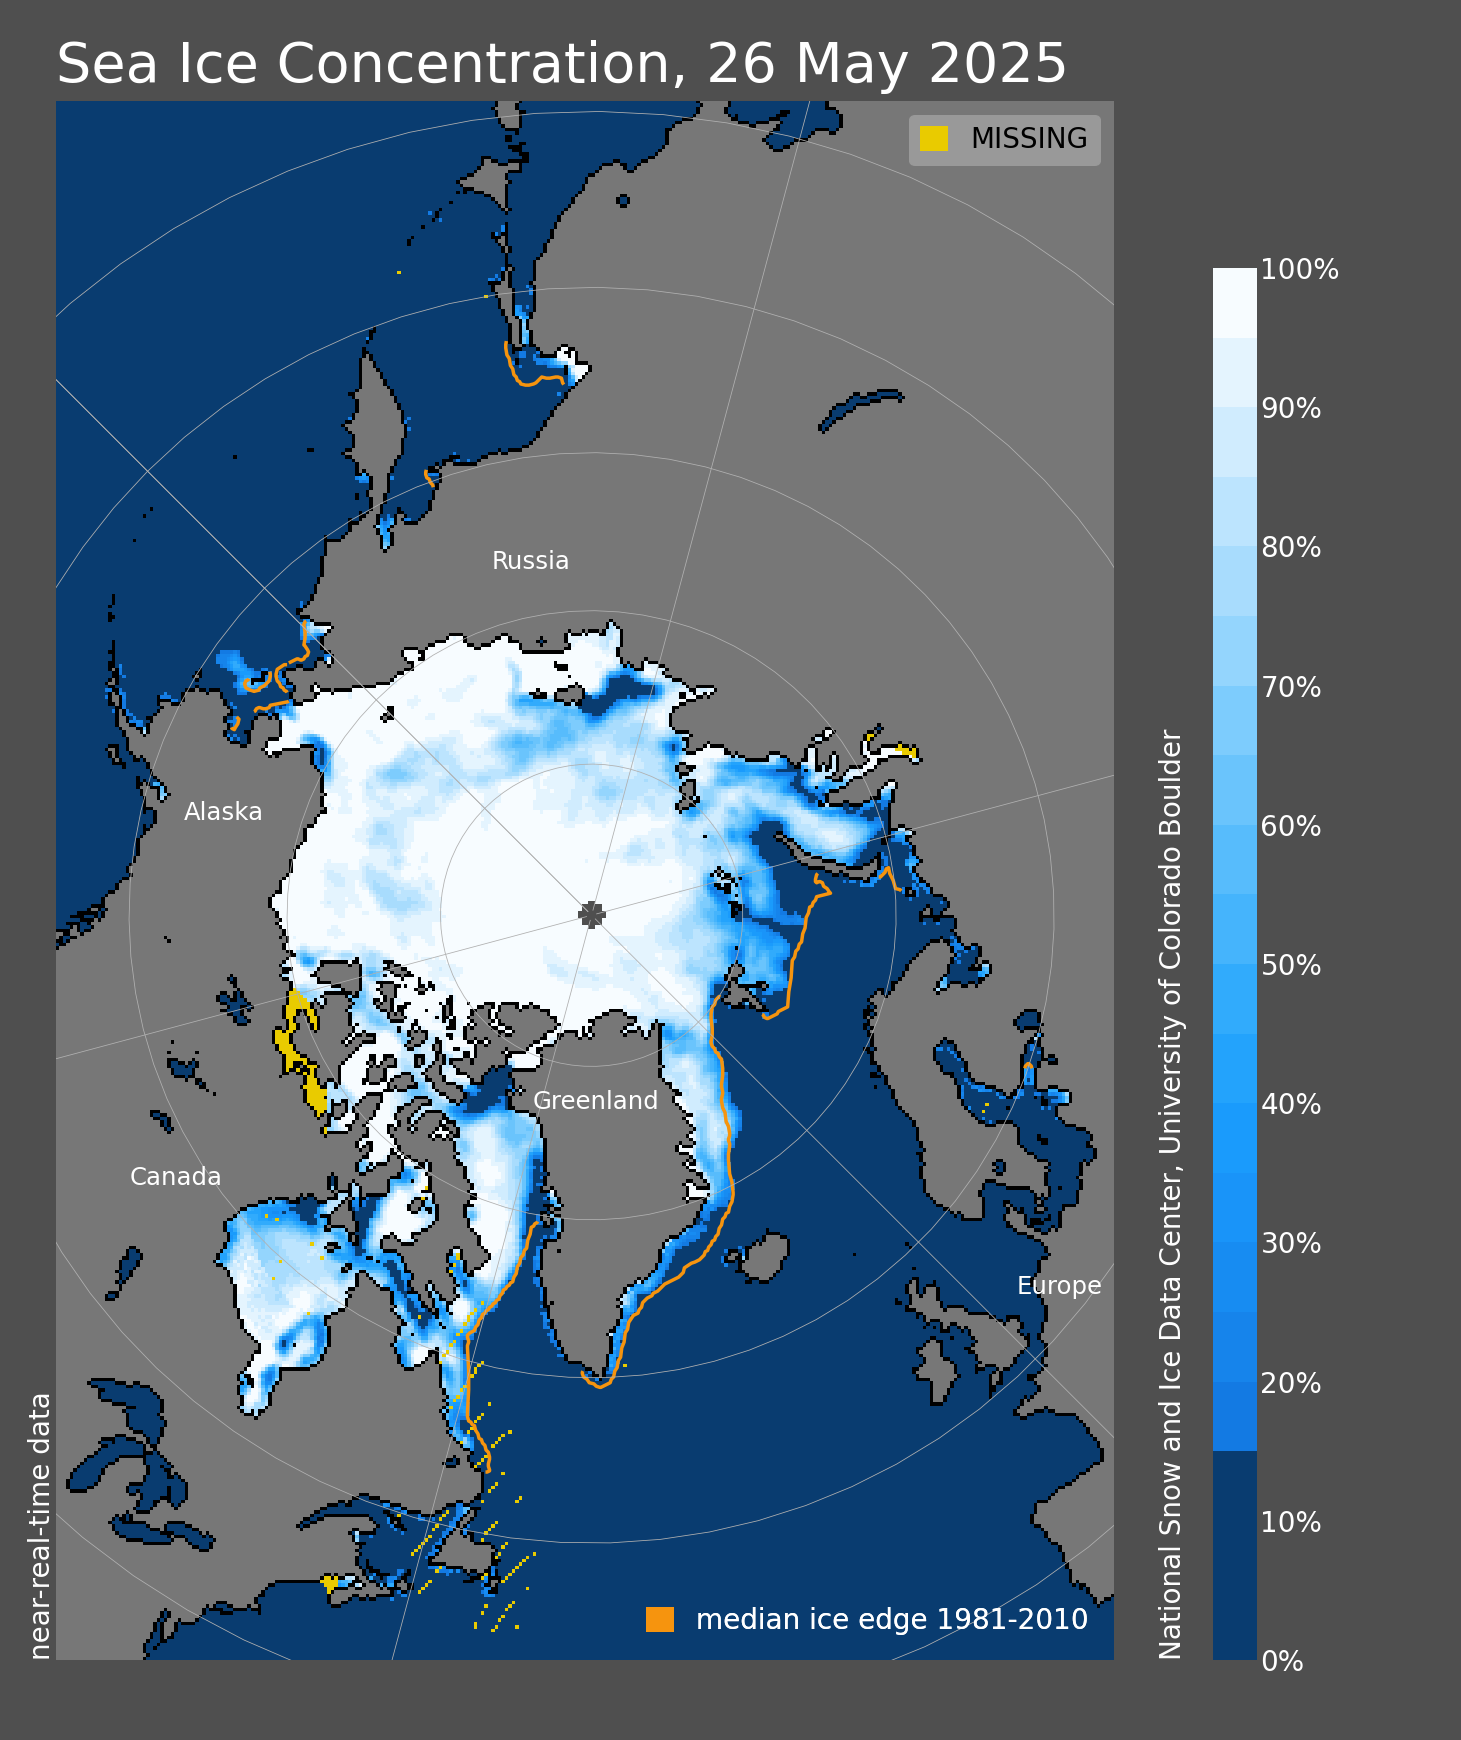
Of course it's all down to weather, but it's the preconditioning (or thinning if you will) of the ice that makes the influence of different weather patterns relevant. In the 80's there were also freak years like 2007, but because the multiyear ice was so thick, the minimum sea ice extent easily stayed above, what was it, 8 million square km. I've also written a piece on the Cryosphere Today archive data and the discrepancy with the daily ice concentration map on the front page. No conclusions, unfortunately, but the archive maps look fishy to me. BTW, one of the NOAA webcams stationed at the North Pole seems to be showing a first melt pond. -
HumanityRules at 13:09 PM on 25 June 2010September 2010 Arctic Ice Extent Handicapping Via ARCUS
22 Neven So what you're suggesting is it's all down to the weather? -
HumanityRules at 13:06 PM on 25 June 2010September 2010 Arctic Ice Extent Handicapping Via ARCUS
Given were all in baseless prediction mode I'll give it a go. I'm going to agree with 14 Berényi Péter and disagree with 10 CBDunkerson that the central Arctic Ocean ice is looking better through this winter than the past few years. I think the archive data from Cryosphere Today also suggests this. I think people here were right in previous discussions that the greater ice accumulation at some parts of the periphery this winter was destined to quickly melt as witnessed by the steep decline over the past few months. So I predict through the summer the melt will slow more quickly than previous years due to the better central Arctic ice and we'll end up somewhere near the 30year trend average plus a few tenth of a million sq km because I'm an optimist. So I'll go with 5.4 I also predict that PIOMAS will underestimate again this year. -
Neven at 12:46 PM on 25 June 2010September 2010 Arctic Ice Extent Handicapping Via ARCUS
It's not so surprising, considering the fact that 2007 took everyone completely off guard. Had the weather conditions of 2008 and 2009 come anywhere near those of 2007 the record would have been broken again. The same goes for this year. The ice in the Arctic Basin has perhaps recovered somewhat, but it is irrelevant if we get 2007 weather conditions. -
HumanityRules at 12:11 PM on 25 June 2010September 2010 Arctic Ice Extent Handicapping Via ARCUS
I should just point out 2008 predictions weren't as bad as 2009. 11/14 underpredicted the ice extent (3/14 overpredicted) but there still seems a bias towards low predictions. -
Doug Bostrom at 12:04 PM on 25 June 2010September 2010 Arctic Ice Extent Handicapping Via ARCUS
HR, thanks for calling those past predictions to our attention. I should have included those but confess I did not dig back to find 'em. What we know of human nature suggests that it would indeed be difficult to entirely isolate our psychology from the 2007 surprise. For my part I remain impressed by the "Joe Public" prediction, particularly as it was made in February. I'd love to see a breakout of the distribution but it's not in the supporting materials. -
HumanityRules at 11:49 AM on 25 June 2010September 2010 Arctic Ice Extent Handicapping Via ARCUS
It appears that SEARCH have been gathering Sept minima for 3 years. Fortunately they archive the 2008 AND 2009 predictions. A similar clustering occurred in both those years unfortunately all predictions underestimated the actual ice extents. So the clustering this year does not necessarily indicate were the final extent will be. I can't help thinking that the extraordinary ice extent in 2007 is in some way playing through these prediction methods to give a low bias. If it's not this I'd love to know what's causing this bias? On a side note. The recent WUWT ice discussions have largely centred around the skill of PIPS v2 and PIOMAS to predict ice volume. PIPS don't seem to have submitted predictions to SEARCH but PIOMAS have (in the shape of Zhang et al). The PIOMAS predictions for 2009 seem particularly poor giving the 2nd worst prediction in May and 4th worst in June. I see from Doug's article Zhang is on the low side for 2010 again.
-
Neven at 11:37 AM on 25 June 2010September 2010 Arctic Ice Extent Handicapping Via ARCUS
That GIF is using 2% of my CPU. BP, you're increasing my carbon footprint. Go to the PIPS webpage and hear your CPU fan spin up (because of the snow effect in the background). :-) Peter, maybe you can add a ice thickness colour index. -
Doug Bostrom at 11:12 AM on 25 June 2010September 2010 Arctic Ice Extent Handicapping Via ARCUS
Squint hard enough and you can see whatever you want. Frolicking polar bears, submariners with Mai Tais, whatever. That GIF is using 2% of my CPU. BP, you're increasing my carbon footprint. -
Neven at 10:59 AM on 25 June 2010September 2010 Arctic Ice Extent Handicapping Via ARCUS
Thanks, Doug. I figured a summary of WUWT Arctic sea ice chest-thumping could prove to be helpful in case we get a new record. It's a dirty job, but someone's got to do it. ;-) -
Andrew Xnn at 10:50 AM on 25 June 2010September 2010 Arctic Ice Extent Handicapping Via ARCUS
Too bad it's too late for "official" predictions. However, it seems clear enough now from the mobility of the ice flows, that this will be record low year. So, I'll say it be as much as 1 million km^2 less than 2007. That will put it in a range between 3.3 to 4.3 million km^2; 3.8 for an average. -
Berényi Péter at 10:21 AM on 25 June 2010September 2010 Arctic Ice Extent Handicapping Via ARCUS
Compare the two animations carefully. What can you see inside the arctic basin?

-
VoxRat at 09:47 AM on 25 June 2010Ocean acidification
Berenyi Peter: "These are upwelling areas and life just loves it. It's like an oasis in desert." You need to bear in mind there are (at least) three separate things to consider here. (1) pCO2 (2) (some) "life just loves" upwellings because among the things being upwelled are a lot of potential nutrients. (3) What we're talking about here is ocean acidification. All other things being equal, increasing pCO2 will decrease the pH. But all other things are *not* equal in this local upwelling perturbation. Do you know what the pH was? -
Doug Bostrom at 09:29 AM on 25 June 2010September 2010 Arctic Ice Extent Handicapping Via ARCUS
Goddard-trackers ought to check out Neven's piece, if nothing else for the writing which is simultaneously entertaining, concise and dense with information, thereby assisting the reader through a thicket of arcana. No mean feat. Is it any wonder newspapers are dying? How can any general-circulation print organ keep up with the likes of folks such as Neven? -
Neven at 09:03 AM on 25 June 2010September 2010 Arctic Ice Extent Handicapping Via ARCUS
Steven Goddard writes below that he agrees with the prediction I made in late 2009 that we’d see another 500,000 km2 of Arctic sea ice recovery in 2010. My analysis indicates the highest late summer extent since 2006. And then finally 2 days ago: I’m forecasting a summer minimum of 5.5 million km², based on JAXA. i.e. higher than 2009, lower than 2006. For a timeline of WUWT antics, read my blog post over at the Arctic Sea Ice blog. -
Berényi Péter at 08:51 AM on 25 June 2010Ocean acidification
Well, one thing you should be aware of. Really high CO2 partial pressure levels in oceans come from below, not above. These are upwelling areas and life just loves it. It's like an oasis in desert. Limnol. Oceanogr., 55(1), 2010, 239–248 Ocean acidification hotspots: Spatiotemporal dynamics of the seawater CO2 system of eastern Pacific coral reefs Manzello, Derek P. "During upwelling in the Galápagos, mean pCO2 [...] at five different sites ranged from 53.1 to 73.5 Pa" (524-725 ppm) This water comes from the abyss, has seen surface a long time ago. The same for California Undercurrent. Upwelling water pCO2 is 800 ppm.
-
VoxRat at 08:13 AM on 25 June 2010Ocean acidification
GeoGuy (#27) – "the operative word you use is “Dissolved”. Not all CO2 entering the ocean gets dissolved." Actually it is, *by definition*. Unless it's entering a s macroscopic bubbles. "Here is a sketchy outline of the process... [clipped misguided elementary chemistry lesson]" You've described a chemical equilibrium: CO2(aq) + H2O <-> H2CO3 ... but you've neglected the fact that - *in the ocean* - there's a further reaction: H2CO3 + OH(-) <-> HCO3(-) + H2O. So as fast as those CO2's react to produce carbonic acid (H2CO3), they soak up one hydroxide ion (OH-). That's acidification - it has exactly the same effect on the pH as does one half the number of sulfuric acid molecules: H2SO4 + 2OH(-) <-> SO4(2-) + 2H2O -
Doug Bostrom at 08:01 AM on 25 June 2010How many climate scientists are climate skeptics?
Omnologos, are you getting your information second-hand by any chance? One could write anything if one does not bother to do fact-checking. Revkin: - The Intergovernmental Panel on Climate Change released the full slate of 831 authors for its fifth assessment of the causes and consequences of climate change, due in 2014. There are many names familiar to Dot Earth readers. The panel made a point of noting its effort to include a wide range of views. Have a look around the working groups (links to lists) and discuss notable participants. - A paper published in the Proceedings of the National Academy of Sciences attempted to sort hundreds of publishing climate scientists into two categories — those convinced and unconvinced of the basics on human-driven global warming — and found nearly all of those with long, heavily cited publishing records were convinced. Not surprisingly, the study has been embraced by proponents of swift action to curb greenhouse gases and attacked by skeptics. More surprisingly, at least a few seasoned climate researchers who are eager for action on emissions also found the work wanting. In a comment following a post by Roger Pielke Jr. of the University of Colorado describing the “black list” effect of such labeling efforts, Eric Steig, a geochemist at the University of Washington and contributor to the Realclimate.org blog, criticized the paper’s methods and intent, saying he was “totally appalled.” Where do you find Revkin's comment? Meanwhile, given Steig's contribution to RealClimate today (which I'm guessing you've not actually read) I'd say it's likely he's taken a closer look. Maybe Revkin should ask again. As to Pielke's "blacklist" it's a silly canard and seems accepted as such outside of WUWT. It's clear this paper touched a nerve in a painful way, hence all the squeals of outrage and references to Nazis etc. -
Chris G at 08:00 AM on 25 June 2010Watts it like at a climate skeptic speakers event?
Regarding public debates, if Bohr and Oppenheimer had a public debate on some aspect of nuclear physics, how the heck would the average person have been able to determine who's argument was better? It's the same thing with climate science. Actually, there already is a forum for public debate of climate science. They are called research journals, peer-reviewed ones at that. Anyone who thinks that only staid agreement occurs in these publications hasn't followed any lines between dissenting researchers. Lindzen appears to be the most worthy champion of the no-problem camp. But then, if he is correct that earth's climate is self-regulating, how does he explain the large range of climates in earth's past? -
VoxRat at 07:55 AM on 25 June 2010Ocean acidification
GeoGuy (#27) I stand by my numbers: The following links indicate that the pH of sulphuric acid and carbonic acid are 0.7 and 5.65 respectively. " Whatever those links say, your statement makes no sense. The pH of a solution of sulphuric acid can be anywhere from <1 to 7, ***depending on the concentration***. You ***seem*** to be thinking of pKa, not pH. But, as I explained, if the solution your putting the carbonic or sulfuric acid into (in this case the ocean) is at a pH substantially above either pKa, both carbonic and sulfuric acid are going to be contribute comparably to acidification. (They'll differ by a factor of 2, since sulfuric produces two hydrogen ions for every one produced by CO2. "The premise is also based on the concept that pH approximates the negative Log 10 of the molar concentration of dissolved hydrogen ions." I have a bachelor's degree in chemistry and a doctorate in biochemistry GeoGuy. I really don't need you to explain how pH works. Believe me. You're wrong on this. -
Chris G at 07:24 AM on 25 June 2010Watts it like at a climate skeptic speakers event?
Here's an article that might be relevant. http://wwwp.dailyclimate.org/tdc-newsroom/usda/climate-change-comes-to-your-backyard Those who say that an increase in CO2 will lead to an increase in agricultural productivity are basically saying something along the lines that currently farmers have optimized their production for a different zone from the one in which they live, that all plants have the same requirements for temperature and water, or that there is no cost and no loss of productivity associated with retooling to grow a different crop. Maybe parts of Canada and Siberia will be able to support growing wheat where they weren't before. So what? Open Google Earth and compare areas where wheat is grown with tundra regions. Wheat growing regions have roads, railways, and towns with shops, hospitals, and schools every 20-40 miles. How many people think you can put those into new regions at no cost or loss of productivity? -
omnologos at 07:24 AM on 25 June 2010How many climate scientists are climate skeptics?
Given what Schmidt, Steig, Revkin and even Slate have been saying in the past couple of days, can we all agree that in this case John (Cook) should have shown at least some hints of "healthy skepticism" about the PNAS paper? Otherwise, one could write that Skeptical Science vigorously criticises any evidence against man-made global warming and yet eagerly, even blindly embraces any argument, op-ed piece, blog or study that supports global warming. As per the end of the Slate article, "Hyping this paper [...] simply reinforces the dangerous perception that climate activists will credulously push any news that might further their case. For those who care about this issue, that's tragic." -
pdjakow at 07:22 AM on 25 June 2010September 2010 Arctic Ice Extent Handicapping Via ARCUS
@dhogaza "Earlier Goddard had said it would "recover" to the 2006 level, 5.8+." Source? -
Doug Bostrom at 07:03 AM on 25 June 2010Is the long-term trend in CO2 caused by warming of the oceans?
Lifted from Michael Tobis' blog: "The system of scholastic disputations encouraged in the Universities of the middle ages had unfortunately trained men to habits of indefinite argumentation, and they often preferred absurd and extravagant propositions, because greater still was required to maintain them; the end and object of such intellectual combats being victory and not truth. "No theory could be too farfetched or fantastical not to attract some followers, provided it fell in with popular notions..." --Charles Lyell in "Principles of Geology" (1830) Except, Lon, we're not in the Middle Ages. Most of us, anyway. For that matter you're not even arguing. -
Doug Bostrom at 06:55 AM on 25 June 2010How many climate scientists are climate skeptics?
In the way of progress on the central issue Anderegg's paper addresses, that of the disproportionately loud voice of often unfounded dissent, the AGU makes this announcement: Climate experts available to answer journalists’ science questions WASHINGTON-A growing number of climate scientists are signing up with the American Geophysical Union (AGU) to serve as sources for the news media of accurate scientific information about climate. So far, more than 115 climate specialists have volunteered for AGU’s new referral database. The database will enable AGU staff to readily match questions from reporters to experts in relevant disciplines. All of the scientists who have signed up to date are members of AGU, the world’s largest organization of Earth and space scientists, which has 58,000 members. AGU is establishing this new service in order to better address journalists’ needs for accurate, timely information about climate science. This initiative follows another effort that was conceived of and organized by AGU members last December around the United Nations Climate Change Conference in Copenhagen. That project brought together journalists and climate scientists, via email, so that reporters covering the conference could get climate science questions answered around the clock. The new referral service will receive journalists’ questions and other queries via emails or phone calls to AGU’s press office staff, who will then pass queries along quickly to appropriate scientist-volunteers. This new service will match scientists to reporters’ queries primarily during business hours (East Coast USA) and will be ongoing. ... Questions should focus on science, not on policy, and should include a deadline so that responses can be returned with appropriate speed. Answers to questions will reflect the responding scientists’ knowledge and research and do not represent official positions of the AGU. More -
Lon Hocker at 06:30 AM on 25 June 2010Is the long-term trend in CO2 caused by warming of the oceans?
e: The satellite measured anomaly is not the same as El Niños/La Niñas. CBDunkerson: Thank you for your strangely illogical comment. I found it amusing. As with e, I see little hope in helping you. Doug: Stop picking on e and CBDunkerson! -
Doug Bostrom at 06:29 AM on 25 June 2010How many climate scientists are climate skeptics?
Gavin Schmidt and Eric Steig have posted a useful discussion of this paper at RealClimate. There is a lot of discussion this week about a new paper in PNAS (Andregg et al, 2010) that tries to assess the credibility of scientists who have made public declarations about policy directions. This come from a long tradition of papers (and drafts) where people have tried to assess the state of the ’scientific consensus’ (Oreskes, Brown et al, Bray and von Storch, Doran and Zimmerman etc.). What has bedevilled all these attempts is that since it is very difficult to get scientists to respond to direct questions (response rates for surveys are pitiful), proxy data of some sort or another are often used that may or may not be useful for the specifics of the ‘consensus’ being tested (which itself is often not clearly defined). Is the test based on agreeing with every word in the IPCC report? Or just the basic science elements? Does it mean adhering to a specific policy option? Or merely stating that ’something’ should be done about emissions? Related issues arise from mis-specified or ambiguous survey questions, and from the obvious fact that opinions about climate in general are quite varied and sometimes can’t easily be placed in neatly labelled boxes. Given these methodological issues (and there are others), why do people bother? The answer lies squarely in the nature of the public ‘debate’ on climate. For decades, one of the main tools in the arsenal of those seeking to prevent actions to reduce emissions has been to declare the that the science is too uncertain to justify anything. To that end, folks like Fred Singer, Art Robinson, the Cato Institute and the ‘Friends’ of Science have periodically organised letters and petitions to indicate (or imply) that ‘very important scientists’ disagree with Kyoto, or the Earth Summit or Copenhagen or the IPCC etc. These are clearly attempts at ‘arguments from authority’, and like most such attempts, are fallacious and, indeed, misleading. They are misleading because as anyone with any familiarity with the field knows, the basic consensus is almost universally accepted. That is, the planet is warming, that human activities are contributing to the greenhouse gases in the atmosphere (chiefly, but not exclusively CO2), that these changes are playing a big role in the current warming, and thus, further increases in the levels of GHGs in the atmosphere are very likely to cause further warming which could have serious impacts. You can go to any standard meeting or workshop, browse the abstracts, look at any assessment, ask any of the National Academies etc. and receive the same answer. There are certainly disputes about more detailed or specific issues (as there is in any scientific field), and lots of research continues to improve our quantitative understanding of the system, but the basic issues (as outlined above) are very widely (though not universally) accepted. It is in response to these attempts to portray the scientific community as fractured and in disagreement, that many people have tried to find quantitative ways to assess the degree of consensus among scientists on the science and, as with this new paper, the degree of credibility and expertise among the signers of various letters advocating policies. The post has numerous embedded links, discusses methodological problems w/Anderegg et al and how significant those may be. Well worth reading the whole thing.
-
Doug Bostrom at 05:27 AM on 25 June 2010Ocean acidification
Geo Guy I think what you're suggesting is that we can't reliably attribute pH changes to C02 because there's a possible confounding influence from anthropogenic H2S04. It's possible to attribute pH changes to a particular source without reference to others. For instance, as a simple example let's say you have a container of water and two containers of sulfuric acid. Adding each container (slowly, of course!) of acid will change the pH a certain amount independently of the other. The situation of C02 and oceans is more complicated, of course, because the transport mechanism of C02 into the ocean and the associated chemical circus is more intricate than simply pouring acid into water. To figure out how much pH change can be exerted by a particular source one has to resort to models whether the source is C02 or H2S04. Given that pH changes from H2S04 will be additive with changes from C02, it's not strictly necessary to isolate H2S04 contributions; improving confidence in attribution to C02 can be done by improving the models used to calculate those contributions, coupled of course with direct observations. For those of us (me, for instance) who need some reasonable amount of information on the topic here's a useful paper that describes in detail accessible to us how atmospheric C02 interacts with the ocean: Ocean acidification due to increasing atmospheric carbon dioxide (pdf, Royal Society, Raven et al, 2005). Digging down, here's a really terrific paper describing the development of a model and providing some rich detail (including a fairly comprehensive table of equilibrium reactions) on how these processes can be modeled: Studying ocean acidification with conservative, stable numerical schemes for nonequilibrium air-ocean exchange and ocean equilibrium chemistry (pdf, JGR, MZ Jacobson, 2005) -
DarkSkywise at 05:06 AM on 25 June 2010Ocean acidification
Geo Guy #26 - Unfortunately, there's no such thing as "the pH of sulphuric acid and carbonic acid". As in the links you've provided, the pH is not only dependant on the strength of the acid (the pKa), but also on the concentration. The sulfuric acid pH example has a concentration of "0.1 mol dm3"... if there would be enough SO2 in the atmosphere to reach such levels, you and I wouldn't be typing this. ;) -
Geo Guy at 04:13 AM on 25 June 2010Ocean acidification
VoxRat # 19 – the operative word you use is “Dissolved”. Not all CO2 entering the ocean gets dissolved.. Here is a sketchy outline of the process. As with the O2, the CO2 must cross the surface of the liquid: CO2(g) CO2(aq) It's a little easier for the CO2 to do so than for oxygen, because the oxygen ends of the molecule have a partial negative charge are better able to hydrogen-bond to the water as a result. The CO2 rather slowly acquires a shell of water molecules. A fraction of these hydrated carbon dioxide molecules react with the water to produce carbonic acid (H2CO3): CO2(aq) + H2O H2CO3(aq) -
Geo Guy at 03:59 AM on 25 June 2010Ocean acidification
VoxRat # 17 – I stand by my numbers: The following links indicate that the pH of sulphuric acid and carbonic acid are 0.7 and 5.65 respectively. The premise is also based on the concept that pH approximates the negative Log 10 of the molar concentration of dissolved hydrogen ions. http://home.clara.net/rod.beavon/sulphuric_acid.htm http://www.chem.usu.edu/~sbialkow/Classes/3600/Overheads/Carbonate/CO2.html -
Geo Guy at 03:48 AM on 25 June 2010Ocean acidification
GaryB # 15 – I never implied we shouldn’t, however 100% of the focus has been on Anthropic CO2 which is incorrect – a factor that continues to be characteristic of the debate. In order to determine the real effect of CO2 on ocean acidity, we need to factor out all of the effects of alternative sources that contribute to a rise on ocean acidity. -
Geo Guy at 03:44 AM on 25 June 2010Ocean acidification
Doug_bostrom # 14 – while you raise some good points, I believe that given the location of many coal fired generators in the US (east coast) it is likely that much of the exhaust finds itself falling directly into the ocean. Estimates for a linger time vary from 2 to 5 days – certainly enough time for the westerly winds to transport the SO2 and associated pollution over the Atlantic. Similar situations exist in Asia. Another factor to consider, as I pointed out, is the exhaust from ships using bunker oil which falls over the ocean as well. The point I was trying to make is that sulphuric acid is so much stronger than carbonic acid that once you factor in all of the relevant parameters, in my view it is difficult to attribute increased acidification of the ocean strictly on increased CO2. -
CBDunkerson at 03:16 AM on 25 June 2010September 2010 Arctic Ice Extent Handicapping Via ARCUS
Considering how low the ice concentration looks as compared to prior years I'm gonna be bold and guess a new record low at 3.9. Frankly, from that map, it looks like everything could melt out except a roughly triangular blob anchored across the northern edge of Greenland and Ellsmere Island and stretching northwards towards Severnaya Zemlya. -
dankd at 03:08 AM on 25 June 2010How Jo Nova doesn't get past climate change
Small correction- the temperature blip just after the K-T boundary is actually the Paleocene-Eocene Thermal Maximum (PETM), not a result of the KT asteroid impact, but a separate event about 10 million years later. It has its own very interesting literature, and would be really hard to explain with a small climate sensitivity. See, for example Dunkley-Jones et al. (2010) and references therein: http://rsta.royalsocietypublishing.org/content/368/1919/2395.abstract -
Jim Eager at 02:48 AM on 25 June 2010September 2010 Arctic Ice Extent Handicapping Via ARCUS
I'm thinking between 5.0 and 4.5, maybe 4.25, bracketing 2008. Not that I can base that on anything more sophisticated than looking at the IARC-JAXA multi-year plot and the PIOMAS volume model, mind. -
dhogaza at 02:22 AM on 25 June 2010September 2010 Arctic Ice Extent Handicapping Via ARCUS
"Have Goddard sign up." Earlier Goddard had said it would "recover" to the 2006 level, 5.8+. Now he's saying 5.5 and is claiming he never predicted 5.8, because as he puts it, "5.5 is the first numerical estimate I've made" (i.e. saying "same as 2006" doesn't count because he didn't append " which was 5.8" to the sentence). But posters there are holding him to the 5.8 number. We shall see. -
Berényi Péter at 00:37 AM on 25 June 2010How many climate scientists are climate skeptics?
Re: Moderator Response to #105 Geo Guy at 04:49 AM on 24 June, 2010 [...] Please continue any discussion of these topics in the appropriate threads.It would be much easier to do that if links to last several comments would be listed in left column belowLatest Posts
.Moderator Response: The last several comments already are collected together. Click the "Recent Comments" link in the blue horizontal bar that is at the top of every page. Each comment's time-date stamp is a link to that particular comment's original location. -
JMurphy at 00:30 AM on 25 June 2010Watts it like at a climate skeptic speakers event?
Perhaps the sparse attendance is linked to this article on Climate Progress, which points out the falling readership of anti-science blogs, particularly on ClimateAudit but also on WUWT. Good discussions there, too, beneath the article. -
Is the long-term trend in CO2 caused by warming of the oceans?
As a side note Lon, from your post: ...it seems unavoidable that the causality is opposite from that which has been offered by the IPCC. The temperature increase is causing the change in the increase of CO2. As others have pointed out, including John in his original post, this statement is factually incorrect. The IPCC in fact does conclude that temperature changes cause changes in the rate of CO2 accumulation (they even reference El Niños/La Niñas specifically), the topic is discussed in the IPCC AR4 Working Group 1 report, section 7.3.2.4.1. If nothing else, can you at least address this simple factual error? -
Berényi Péter at 23:59 PM on 24 June 2010How many climate scientists are climate skeptics?
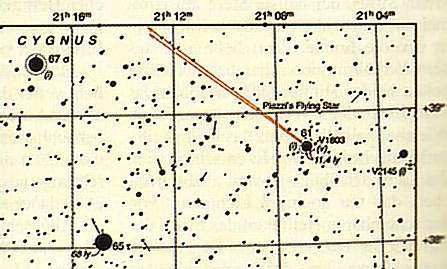
#102 chriscanaris at 01:15 AM on 24 June, 2010 Galileo was no diplomat (he also fudged his famous leaning tower of Pisa experiments). He published a dialogue in which he made the proponent of the Ptolemaic system appear a buffoon. Worse than that. Dialogo (published in March 1632, Florence) featured Simplicio (a convinced Aristotelian character, proponent of the Ptolemaic system) after Maffeo Barberini, his former friend and admirerer, who was the ruling pope, Urban VIII by then. As Simplicio looks rather silly most of the time, the pope was not happy at all. It was popular science, a bestseller, written in Italian, not Latin, the proper language for scientific papers. On top of that his treatment of tides (fourth day) as proof of terrestrial motion was fundamentally flawed. First undeniable proof of Earth's motion came in 1727, almost a hundred years later, by the discovery of an unpredicted effect, stellar aberration. James Bradley was looking for stellar parallax, which was predicted since Aristarchus' time, but as usual, he has found something else. The first successful stellar parallax measurement was performed in 1838 by Friedrich Wilhelm Bessel on 61 Cygni.
 Science takes time.
In 1783 Friedrich Wilhelm Herschel published his paper on Solar Motion and introduced the term Solar Apex. Therefore not even the Heliocentric world view was correct, the Sun also moved (toward Lambda Herculis).
The Catholic Church was more or less up to date with science. In 1758 they dropped the general prohibition of books advocating heliocentrism and in 1822 the Sacred Congregation of the Inquisition allowed printing of heliocentric books in Rome.
In 1916 Albert Einstein explained God does not care. A center of your choice is as good as any other.
Then came the ultimate triumph of Geocentric World View with the adoption of WGS 84 and advent of GPS.
Science takes time.
In 1783 Friedrich Wilhelm Herschel published his paper on Solar Motion and introduced the term Solar Apex. Therefore not even the Heliocentric world view was correct, the Sun also moved (toward Lambda Herculis).
The Catholic Church was more or less up to date with science. In 1758 they dropped the general prohibition of books advocating heliocentrism and in 1822 the Sacred Congregation of the Inquisition allowed printing of heliocentric books in Rome.
In 1916 Albert Einstein explained God does not care. A center of your choice is as good as any other.
Then came the ultimate triumph of Geocentric World View with the adoption of WGS 84 and advent of GPS.
-
Is the long-term trend in CO2 caused by warming of the oceans?
Lon I understand your post just fine, in summary: a) Rate of CO2 accumulation correlates to temperature anomaly. (I don't dispute this) b) Temperature anomaly correlates with el ninos. (no dispute here either) c) Transitively, rate of CO2 accumulation correlates with el ninos. (still no dispute here) d) El Ninos are not caused by CO2. (again no dispute here) e) You conclude from the above that the effects of temperature change are the direct source of CO2 in the atmosphere. It is the final step where you have made an illogical leap. The proposition in e) simply does not follow logically from the statements above it. You cannot conclude from a correlation to rate that there exists a direct causation. Only a correlation to level can suggest that. Statements b-c are direct transitive extensions of statement a, they do not magically turn your correlation of rate to a correlation of level. The model you provided is just a quantitative restatement of your correlation to rate, it too does not magically transform your data into a correlation of level (and it also makes some ridiculous predictions). Honestly I don't have much hope left that you will understand any of this, but I can't help feeling like there exists some combination of words that will make this clear to you.
Prev 2348 2349 2350 2351 2352 2353 2354 2355 2356 2357 2358 2359 2360 2361 2362 2363 Next


