


 Arguments


Recent Comments
Prev 2352 2353 2354 2355 2356 2357 2358 2359 2360 2361 2362 2363 2364 2365 2366 2367 Next
Comments 117951 to 118000:
-
johnd at 05:41 AM on 23 June 2010Watts it like at a climate skeptic speakers event?
Ian Forrester at 02:50 AM, you have tried to divert from the issue under discussion, namely whether or not CO2 has a fertilisation effect, is a plant food.Moderator Response: We can take a hint! Please discuss this further on a more appropriate thread. Thanks! -
Karl_from_Wylie at 05:29 AM on 23 June 2010How many climate scientists are climate skeptics?
Survey is not surprising. Would you be surprised to find a survey of Catholic priests found only 3 to 5 percent are agnostic? -
Berényi Péter at 05:28 AM on 23 June 2010How many climate scientists are climate skeptics?
#34 e at 03:42 AM on 23 June, 2010 since you seem hung up on the word "priorities", perhaps the NSF's discussion of Investment Priorities would be more what you are looking for Unfortunately we'll not be able to decide the question whether rejection of Pielke's proposal was based on a fair application of these pretty vague priorities, as rejected proposals are undocumented at the NSF site. See Pielke Sr.'s recommendations.- present ALL proposal abstracts, reviews of both accepted and rejected proposals and program managers decision letters (or e-mails) on line for public access
- present the date of submission and final acceptance (or rejection) of the proposal.
-
Ian Forrester at 05:27 AM on 23 June 2010How many climate scientists are climate skeptics?
Geoguy, your reference to the Oregon petition shows how deeply in the AGW denier camp you are embedded. The response to the OIM petition was based on a simultaneous presentation of a fraudulent paper (made to look as if it had been published in PNAS) along with rather misleading questions. As an indicator of how scientists and others feel about AGW it is useless. -
Doug Bostrom at 05:24 AM on 23 June 2010How many climate scientists are climate skeptics?
Checking in at WUWT, I see the Anderegg paper is being celebrated, with Anderegg et al likened somewhat paradoxically to both Nazis as well as Communists. Watts does his very best to establish that Anderegg's paper contains a "black list," which it does not. Watts is also mixed up about the authorship of the paper, or at least he's rhetorically reversing the author relationships in order to improve the artistic merit of his impressionism. Pielke Jr. is also working the same "black list" conflation angle. This paper -really- touched a nerve. Here's (pdf) the Anderegg paper. Can you find a "black list?" I can't. -
CBW at 05:13 AM on 23 June 2010How many climate scientists are climate skeptics?
fydijkstra, like any other research paper, Anderegg's addresses some questions, not ALL POSSIBLE questions. There is broad agreement within the climate science community about the fact that the climate is warming and that human activity is the cause. There is not now, nor will there ever be complete agreement on every aspect of the problem. That's not how science works and that's not how people work. Science, by definition, takes place at the edges of knowledge where human understanding is incomplete and work must be done to ferret out the truth. It is both unrealistic and unnecessary to require unanimity before taking action. We know that smoking causes disease, despite the fact that there are still people disputing that reality. And research into the effects of smoking continues. But it would have had severe public health consequences to not have taken action while waiting for every scientist to be in complete agreement with all of findings of the consensus, or while waiting for the research to be "complete." -
Doug Bostrom at 05:04 AM on 23 June 2010How many climate scientists are climate skeptics?
fydijkstra ignoring for a moment the evidence that anthropogenic climate change does seem to be having a number of knock-on effects, before any policy response can happen the public and by extension policy makers need to have some sense of whether the -fundamentals- of anthropogenic climate change are reliable. That's why Anderegg et al stick with the notion of "tenets of anthropogenic climate change." They're not querying on "chapter and verse" but instead basic mechanisms and basic attributions. The fundamental thrust of the research is to help understand the disparity of understanding this topic between scientists and the lay public. There's a legitimate need for investigation of this. Beyond applications this gulf of understanding is a subject of keen curiosity for social science researchers because it's rather strange and difficult to explain. Sometimes just reading the abstract can be helpful: Anderegg: Although preliminary estimates from published literature and expert surveys suggest striking agreement among climate scientists on the tenets of anthropogenic climate change (ACC), the American public expresses substantial doubt about both the anthropogenic cause and the level of scientific agreement underpinning ACC. A broad analysis of the climate scientist community itself, the distribution of credibility of dissenting researchers relative to agreeing researchers, and the level of agreement among top climate experts has not been conducted and would inform future ACC discussions. Here, we use an extensive dataset of 1,372 climate researchers and their publication and citation data to show that (i) 97–98% of the climate researchers most actively publishing in the field support the tenets of ACC outlined by the Intergovernmental Panel on Climate Change, and (ii) the relative climate expertise and scientific prominence of the researchers unconvinced of ACC are substantially below that of the convinced researchers. The source of public confusion will hopefully be tracked down in a scientific way as opposed to simply speculating based on PR expenditures by interested parties. Anderegg and others are following that path of inquiry. -
dhogaza at 04:50 AM on 23 June 2010How many climate scientists are climate skeptics?
Yes, BP, it is normal practice for granting agency program directors to set and use priorities. Grant decisions are made by them, not by the reviewers. Reviewers are just advisers.
In fact, the prior setting and later using of priorities is one of the mechanisms that helps to keep the process objective. The rejection letter cited above points out that reviewers felt the research had merit, it just didn't match well with priorities. Of course, if there had been fewer grant requests in the queue, perhaps the rejection letter would've been an approval. -
fydijkstra at 04:38 AM on 23 June 2010How many climate scientists are climate skeptics?
This should not appear on Skeptical Science (just as the Anderregg article should not have been published in any seriously reviewed journal). 'Skeptical Science' claims to be skeptical in a better way than the so called climate skeptics. Well, there we go! Is the unthinkingly acceptance of such an article the real skepticism? I have always thougth that skeptics do not accept things without first asking a lot of questions. "97 to 98% of climate scientists are convinced by the evidence of human caused climate change." OK, maybe that in a certain sample of climate scientists 97% answer 'yes' to such an umbrella statement. But of what are they really convinced? How much has the globe really warmed in the last 2 centuries? Which part of that warming is due to human activities and which is due to natural factors? Which human acivities have caused climate change? Do they really trust climate models? Do they believe the predictions of these models about sea level change, disaster damage, health risks? Etc. etc. etc. Climate skeptics claim that there is no scientific consensus on these issues. The Anderegg article does not in any way show the contrary. -
Doug Bostrom at 04:37 AM on 23 June 2010How many climate scientists are climate skeptics?
Geo Guy suggests that in assessing climate-related publications we must eliminate those researchers whose work is most closely associated with climate research. Down the road we're going to look on this period as akin to a situation where we were repeatedly forced to submit to digital prostate exams from self-professed doctors unable to distinguish their thumbs from their middle fingers, only later to discover to our chagrin that the gland in question was perfectly healthy all along. -
Is the long-term trend in CO2 caused by warming of the oceans?
Lon, You can make guesses all day long as to what the parameters in your model represent, but it does nothing to change the conclusions that you can logically draw from your model in and of itself. You've made some very dramatic conclusions in your WUWT post, and suggested that these conclusions can be drawn directly from the results of your model. Now, without inserting information that is not directly included in your model or it's results, please explain why this is the case. -
mazibuko at 04:21 AM on 23 June 2010How many climate scientists are climate skeptics?
I really can't see how this paper is terribly helpful, and it's top stat is actually wrong--I believe the highest value in the "unconvinced section" is the Pielke Sr. data point. Pielke Sr. states fairly clearly that he is convinced by the evidence, although thinks that land use has a greater influence on climate than in commonly accepted. Minds are already made up on this, and more proof of "consensus" isn't going to convince any skeptics. This is simply another artillery round in the ongoing war, which will in due course be answered by a return volley (however feeble or unconvincing it may be to those of us who don't indulge in conspiracy theories). -
barry1487 at 04:05 AM on 23 June 2010How Jo Nova doesn't get the CO2 lag
robhon,Actually, I just went back and was looking through Knutti 2005 and they say in the introduction, "Atmospheric CO2 is prescribed directly in the idealized scenarios used here, other forcings are not considered." So, they get 1.4C to 6.5C without other forcings.
True - those figures are derived by including estimated feedbacks to CO2 forcing. They don't consider other forcings. -
Geo Guy at 03:58 AM on 23 June 2010How many climate scientists are climate skeptics?
I think your post was made without due assessment of the supporting evidence. With respect to Doran 2009, his work entailed a web-based survey of 10,257 earth scientists, of which 3,146 responded. Of these 5% (157) were reported to be climate scientists. What isn’t evident is the response from those climate scientists for the two questions. Even at that, only 82 percent answered yes to the question: “Do you think human activity is a significant contributing factor in changing mean global temperatures?” Now, the above question does NOT ask “Do you think human activity is DRIVING the change in mean global temperatures.” Which I believe would have resulted in a different level of response. For instance I personally believe that human activity IS a significant factor in changing mean global temperatures, however not in the way being promoted by IPCC. In addition I do not feel that mean is a valid measurement to determine what man’s impact is on global temperatures. With respect to your comment that “very few scientists who actually have expertise in climate science.” How can you use that argument when you use someone else's work (Doran 2009) who, based on your criteria, should not be considered given that the survey focused on responses from 3,146 geoscientists of which only 5% were climate scientists? Climate science is not a topic by itself. Instead it incorporates knowledge from a number of scientific disciplines, including geoscientists, physicists, chemists, biologists, atmospheric and environmentalists to name some and which composed over 50% of those who signed the OISM petition. This is in sharp contrast to your reported 39 scientists. Furthermore you have consistently provided links in this blog to studies carried out by biologists, geoscientists etc so if they are good enough to support your position on climate change, similarly educated scientists should be accepted for their contrary view point. As for Anderegg et al, 2010, when you delve into their respondents, close to 50% were associated with the IPCC which from a statistical perspective, should be removed from the data as having a conflict of interest. You are using the same authors to support the findings of a panel to which they contributed. In addition there is no method to verify that all of those scientists that were included in the list were in fact climate scientists (given that you seem to reject any contrarian viewpoint from a scientist that isn’t a climate scientist. You can’t have it both ways. In the end, you conclusion is contrived and extremely biased and holds no credence. -
tobyjoyce at 03:57 AM on 23 June 2010How many climate scientists are climate skeptics?
Here is the link for #39 Oreskes paper -
tobyjoyce at 03:55 AM on 23 June 2010How many climate scientists are climate skeptics?
Incidentally, didn't Naomi Oreskes publish a similar paper some years ago? With similar findings? Wasn't she accused of cherry-picking the data, then cleared? She was not accused of making a Blacklist, as I have seen on blogs like Spencer's and Watts', a spin that seems to be Pielkes Jnr.'s. Oreskes paper -
Doug Bostrom at 03:53 AM on 23 June 2010How many climate scientists are climate skeptics?
Regarding Pielke, how about some data? Here's recent history of funded proposals from the program Pielke suggests is being lead by dishonest and biased program officers: Pielke-gripe awarded cohort Can you spot the dishonesty? -
Gneiss at 03:53 AM on 23 June 2010How many climate scientists are climate skeptics?
BP asks, "Is it normal practice to reject a proposal supported by reviewers based on the Program Director's unspecified priorities? Not even that. An unspecified entity's unspecified priorities." I guess you've never submitted an NSF proposal. Yes, it is quite normal. That is basically a form letter, which I and probably many others here have seen at times in response to our own lovely proposals. What's new here is the black-helicopters belief that let-them-down-gently boilerplate wording now reveals a sinister political intent. -
LWeisenthal at 03:49 AM on 23 June 2010How many climate scientists are climate skeptics?
With reference to: "Generally, scientists aren't funded to do work that's already been done." Actually, this is the type of work which does get funded, in the real world. In 1982, Emil Frei of Harvard gave the Karnofsky address at the American Society of Clinical Oncology meetings. He spoke about two types of scientists: Investigators and Discoverers. Investigators advance timid and most often trivial hypotheses, based upon prior work. This type of work has a high probability of success, and the success reassures the scientific community. Investigators succeed and are esteemed by their mentors and peers. At best, investigative research results in single step advances, which change no paradigms. Discoverers take risks. They usually fail. Their thinking disturbs both mentors and peers. But when they succeed, the result is a multi-step advance and sometimes a true paradigm shift (e.g. the bacterial causation of peptic ulcer disease). The problem comes when investigators become imbued with so much certitude that would be discoverers can never get funded and when discoveries can't get published. The weakest of all arguments in favor of a given theory is the degree of peer acceptance. This is purely a political argument and not a scientific argument. - Larry Weisenthal/Huntington Beach, CA -
Riccardo at 03:46 AM on 23 June 2010How climate skeptics mislead
so, Berényi Péter did calculations on a state wide basis regardless of the actual siting of the met stations (i.e. attributing the same increase in population to all stations) and kindly leave to us to do the proper calculations. In the meanwhile he maintains his quite strong claim, waiting for us to prove it. Great. -
Rob Honeycutt at 03:43 AM on 23 June 2010How many climate scientists are climate skeptics?
LWeisenthal... I think this was stated previously but I'll reiterate. No one is claiming that there is 100% absolute proof that there is no other answer than AGW. No one is claiming there can't be another answer. They are claiming that science, when it gets to this level of study, with so many independent lines of evidence pointing to the same conclusion, it's most likely that the general consensus of the scientific community is correct. Might there be another explanation? Of course. Is it likely? Not very. -
How many climate scientists are climate skeptics?
Actually BP, since you seem hung up on the word "priorities", perhaps the NSF's discussion of Investment Priorities would be more what you are looking for. This is from the NSF's Strategic Plan, publically available on their website. -
AuntSally at 03:26 AM on 23 June 2010How many climate scientists are climate skeptics?
Couple of thoughts based on these comments... 1. Generally, scientists aren't funded to do work that's already been done. So "proving" the human connection is not a priority, as there's already an enormous preponderance of evidence. And for this reason, one is unlikely to get funded to pursue research which a priori disregards this preponderance of evidence. (No one will fund your gravity research if your a priori hypothesis is that things don't fall when you drop them.) 2. I'm still amazed at the "science isn't done by consensus" comments. Nonsense. The difference, however, is that the consensus is evidence-based and it's the consensus of the relevant scientific community. Further, I generally find such comments intellectually dishonest (e.g., Arkadiusz above): if the stats were reversed -- if 98% disagreed with AGW -- the mantra would be "See, this proves people have nothing to do with it." Certainly they wouldn't be fighting for the necessity of listening to the "alarmist 2%." -
Tom Dayton at 03:26 AM on 23 June 2010How many climate scientists are climate skeptics?
Yes, BP, it is normal practice for granting agency program directors to set and use priorities. Grant decisions are made by them, not by the reviewers. Reviewers are just advisers. -
How many climate scientists are climate skeptics?
BP, >Is it normal practice to reject a proposal supported by reviewers based on the Program Director's unspecified priorities? The priorities are not unspecified, you can read about them here and here. -
tobyjoyce at 03:17 AM on 23 June 2010How many climate scientists are climate skeptics?
@JMurphy #16, David Attenborough told a story in one of his documentaries about how he was impressed by the theory of Continental Drift while a geology student at Cambridge. He mentioned this to his Professor, who put him in his place with an instant riposte "Dear boy, I will accept the theory of Continental Drift when you show me what the continents can float on". Actually, the Professor was totally correct. Without Plate Tectonics (which only came along in the late '50s), the evidence for Continental Drift (I think it was proposed in 1912) was quite slim. Instinctively, we always think the "losers" were wilfully blind or stupid in any intellectual debate, but often the "wrong" side were also the side with the better evidence at the time. This was a point Stephen Jay Gould was fond of making, when defending Cuvier, Catastrophism and other scientific "losers". Evolution was only totally accepted in the Modern Synthesis with genetics, and Lamarckism was kicked to the kerb. The point is that the scientific consensus HAS to be the starting point. Only when you have totally picked over its bones and understood it can you start thinking of alternatives. And the alternatives usually grow from points where the consensus is weakest, not from maverick science that rejects the whole consensus to begin with. -
Berényi Péter at 03:04 AM on 23 June 2010How many climate scientists are climate skeptics?
#17 KR at 01:53 AM on 23 June, 2010 You can only state that the reviewers (over three submissions) and the people in the program thought other proposals were more worth funding for some reason or another Is it normal practice to reject a proposal supported by reviewers based on the Program Director's unspecified priorities? Not even that. An unspecified entity's unspecified priorities. "other proposals [...] were of higher priority" Weird language. -
Sean A at 02:56 AM on 23 June 2010How many climate scientists are climate skeptics?
Victim bullying aside, the supposed "publication bias favoring agreement with conventional wisdom" is something that should be examined. Where does the "conventional wisdom" of science come from? Not out of "consensus building", or some kind of agreement to agree, but from years of evidence from study after study that have held up under scrutiny. So, if you want to publish something that goes against the body of evidence that represents our best understanding of reality, it had better be good! -
LWeisenthal at 02:52 AM on 23 June 2010How many climate scientists are climate skeptics?
With reference to: >>I believe a "consensus" properly indicates a result of multiple lines of independent inquiry, pursued by people often in competition for funding in different locations, institutions, and fields of inquiry, using different methods, yet arriving independently at similar conclusions. Therefore a "consensus" actually is a powerful indicator of validity. >>A 97% consensus of the independent variety is overwhelming testimony to the validity of the argument, and that is what we have in this case.<< There are a whole lot of things in the history of science which show just how poisonous it is to argue something on the basis of popularity among scientists. To cite just a single, very egregious example: The bacterial causation of peptic ulcer disease (PUD). In the mid-80s, 99.9% of the world's experts thought that PUD was primarily caused by excess stomach acid, which was, in turn, caused by things such as stress, smoking, alcohol, spicy foods, whatever. The evidence for this was overwhelming. The most lucrative operation for surgeons was the vagotomy and antrectomy (ulcer operation). The most lucrative drug was Tagamet (which reduced acid secretion). A lone pathologist in Australia, with no "credentials" came up with the idea that ulcers were caused by a bacterium (helicobacter pylori). No one believed him. He couldn't get the work published. He certainly wouldn't have qualified for any funding. It took nearly 20 years for the world to come around to his way of thinking. In 2005 he (Robin Warren) won the Nobel Prize. http://nobelprize.org/nobel_prizes/medicine/laureates/2005/press.html Today, the vagotomy and antrectomy, as well as Tagamet, exist primarily as historical reminders of the folly of scientific certitude. -
Esop at 02:51 AM on 23 June 2010How many climate scientists are climate skeptics?
#4: The ever so slight problem with the "it's natural" camp, like the Polish geologists that you quote is that they went on record to state that global temperatures would continue to drop after 2008. They failed miserably, as we are seeing record high global temperatures during the lowest solar activity in more than a century. The natural drivers like PDO and solar are turned to the cool setting, but the CO2 signal along with a mediocre El Nino is already able to overpower the natural cooling and set records. That is remarkable. -
Ian Forrester at 02:50 AM on 23 June 2010Watts it like at a climate skeptic speakers event?
JohnD, you have not answered my questions. Please reread my post and answer the questions. Large greenhouses are used in one of two situations. Firstly they are used for very high value products or produce. They are also used when some sucker governments get confused by pseudo-science and finance them even though more experienced people tell them that they are nonsense (see the Canadian example; google "Sprung Greenhouse"). If you did a proper review of the scientific literature you would see that increased CO2 accompanied by increased temperature will be a detriment to agricultural production, not a benefit as you suggest. -
tobyjoyce at 02:49 AM on 23 June 2010How many climate scientists are climate skeptics?
@Arkadiusz Semczyszak "...Polish Academy of Sciences, who officially say: that now it is nature that decides, not man-made ... " That is exactly the point! And how do we humans determine the decisions of nature? By science, of course, specifically, the scientific consensus. We all know the consensus may be wrong, but it has been a stable consensus now for twenty years or more ... For months now, (to take one example) A. Watts has been trumpeting how his blog is the most popular science blog on the web, as if that endorsed his position. So what? Tell him that "Nature decides", not the number of hits, Arkadiusz. Every survey that showed a decline in the % of the public accepting the science of global warming has declined was greeted with glee on every denialist website. Tell them that "Nature decides", Arkadiusz, not public popularity. Deniers unashamedly used so-called "Climategate" to undermine public trust, which was the equivalent of the Jonny Cochrane undermining the state's forensic science as tainted with racism in the OJ case. Tell them that "Nature decides", Arkadiusz, this is not a jury trial. When a poster ("marty") was told on a previous thread that "nature was not a democracy", he more or less said that scientists were trying to establish a dictatorship. Tell him that "Nature decides", Arkadiusz, there is not a show of hands at the end of a debate. -
caerbannog at 02:28 AM on 23 June 2010How many climate scientists are climate skeptics?
citizenschallenge (post 23). Note the ';)' at the bottom of my post. Also check out Dr. Andrew Wakefield's credentials. (Wakefield is the Monckton of medicine). My post and your reply demonstrate the power of Poe's Law. ;) ;) ;) -
Sean A at 02:27 AM on 23 June 2010How Jo Nova doesn't get the CO2 lag
Glacial-interglacial atmospheric CO2 change: a possible “standing volume” effect on deep-ocean carbon sequestration -- L. C. Skinner, 2009 "Abstract. So far, the exploration of possible mechanisms for glacial atmospheric CO2 drawdown and marine carbon sequestration has tended to focus on dynamic or kinetic processes (i.e. variable mixing-, equilibration- or export rates). Here an attempt is made to underline instead the possible importance of changes in the standing volumes of intra-oceanic carbon reservoirs (i.e. different water-masses) in influencing the total marine carbon inventory. By way of illustration, a simple mechanism is proposed for enhancing the marine carbon inventory via an increase in the volume of relatively cold and carbon-enriched deep water, analogous to modern Lower Circumpolar Deep Water (LCDW), filling the ocean basins. A set of simple box-model experiments confirm the expectation that a deep sea dominated by an expanded LCDW-like watermass holds more CO2 , without any pre-imposed changes in ocean overturning rate, biological export or ocean-atmosphere exchange. The magnitude of this “standing volume effect” (which operates by boosting the solubility- and biological pumps) might be as large as thecontributions that have previously been attributed to carbonate compensation, terrestrial biosphere reduction or ocean fertilisation for example. By providing a means of not only enhancing but also driving changes in the efficiency of the biological- and solubility pumps, this standing volume mechanism may help to reduce the amount of glacial-interglacial CO2 change that remains to be explained by other mechanisms that are difficult to assess in the geological archive, such as reduced mass transport or mixing rates in particular. This in turn could help narrow the search for forcing conditions capable of pushing the global carbon cycle between glacial and interglacial modes." (emphasis added) I don't think this study says quite what Arkadiusz Semczyszak wants it to say. -
Doug Bostrom at 02:21 AM on 23 June 2010How many climate scientists are climate skeptics?
Speaking of fads, I'm disappointed that Berényi Péter is diverging from his usual diligence and is instead helping Dr. Pielke perform an embarrassing public tantrum over a declined proposal. Pielke's case is quite incomplete because we're lacking necessary information to form a conclusion about Pielke's implied charge of misbehavior of a program officer (Pielke is actually quite prolific at flinging dubious charges; see the matter of his accusing Pachauri of malfeasance, where Pielke was arguably perilously close to slander). I've never worked for NSF but I am very good friends with a two-term program officer at NSF and can testify from very close quarters that the integrity of the process is extremely good. Proposals making it all the way to being treated to detailed review at NSF are nearly uniformly of very high quality. Those finding their way to the desk of a program officer without obvious blemishes are even more tightly grouped in terms of prospects for successful research outcomes but money is scarce, too scarce to fund all proposals found meritorious by reviewers. The program officer's job is to select those proposals considered of most relevance to an individual program's overall objectives and the objectives of NSF as a whole. Given that Pielke's proposal will have been reviewed along with a sizable class of other excellent research projects, making any judgment about the justification of Pielke's annoyance over the failure of his proposal would be easier if we saw the cohort of proposals considered by the program officer. Indeed Pielke himself suggests this but leaps to a conclusion without any supporting data. Pielke himself helps to explain the dilemma of program officers while still being unable to resist injecting political rhetoric into his words: "NSF program managers have considerable ability to slant research that they fund with insufficent transparency of the review process. This has become quite a problem in the climate science area where, as one example, in recent years they have elected to fund climate predictions decades into the future. Well, of course NSF has funded climate projections; the future behavior of global climate is an important research topic with large impact and squarely in the purview of NSF. One could certainly make a reasonable case that global climate behavior is more important than hypothetical effects of land use on climate along the Eastern seaboard of the U.S. To me it appears Pielke is trying to use his clout as a pundit to politically influence an NSF funding decision. To the extent he succeeds he will be a degenerate influence on NSF funding decisions. He'd do better to expend his political capital in urging U.S. taxpayers to encourage more funding of NSF. -
citizenschallenge at 02:19 AM on 23 June 2010How many climate scientists are climate skeptics?
Well, OK I’ve read Roger Pielke Jr. and Sr.’s articles and am not particularly impressed. My first observation is that there has been a concerted media campaign going on for years attacking scientists and the notion of “consensus” - so now the scientific community is reacting and defending itself - and now of course, they are being attacked for defending themselves. Some criticism of the paper seems justified - but that criticism doesn't seem to substantially threaten the conclusion, though, of course, "more study is needed" ~ ~ ~ ~ ~ ~ ~ caerbannog “This is a point that should not be ignored. Scientists who challenge the consensus are often shut out of journals or even worse, forced to retract papers they have managed to get published.” But, but, when those “skeptical” scientists are using deception and pedaling demonstrably false statements, then fall back on economic/political rational to bolster their opinions - then they do not deserve defending. I’m still waiting for a “skeptical scientist” to produce any convincing papers that do more than slightly adjust some details of the larger AGW picture. Where are these reports? -
johnd at 02:19 AM on 23 June 2010Watts it like at a climate skeptic speakers event?
Ian Forrester at 01:15 AM, reality is represented by what has been proved in recent years in glasshouse production of various plants using CO2 enrichment. There is a big market for CO2 generators for such use. Reality is also represented by the FACE trials over the last couple of decades. The fact is that CO2 enrichment works, so there is no point trying to maintain a position of denial. The point that you are missing is that given the technique of CO2 fertilisation is continually proven to work, and if the climate changes as many alarmists are predicting, then these expensive structures and equipment to provide CO2 enrichment won't be needed will they? ROFL Presently they are like monuments being built defying much of what many believers hold dear, no wonder you consider them nonsense. Perhaps you are not so confident about AGW after all if you think everyone has to convert their fields. I would have thought that would be the argument of someone who believed global cooling was coming. Of course if it doesn't change as quickly as being predicted then this type of private investment will still be needed, and perhaps the investors should then consider dipping into the public purse. That currently provides funding for all sorts of AGW related projects, all of which are not feasible without huge subsidies, not so amazing, some now being exposed as little more than scams, more intent on ripping off the taxpayers. -
KR at 02:14 AM on 23 June 2010How many climate scientists are climate skeptics?
D**n it, does that mean I'm unlikely to date Megan Fox? Sigh... CBW's right - not everything gets funded, not all jobs will hire you, not all wishes get granted. That's just life. -
Rob Honeycutt at 02:12 AM on 23 June 2010How many climate scientists are climate skeptics?
Berényi Péter... I would venture to guess that virtually every scientist applying for research money in almost every field has a stack of letters identical to Pielke's. It's like being a writer. If you don't get rejection letters then you aren't trying. -
CBW at 02:08 AM on 23 June 2010How many climate scientists are climate skeptics?
I think a lot of people don't understand how scientific funding works. A scientist doesn't propose to do work that is in favor or against the conventional wisdom, and very few proposals are for broad topics that could confirm or overturn an entire paradigm. Most science is small and targeted at very specific topics which can add a small piece to the overall body of scientific knowledge. Nor do scientists offer a certain set of findings and then propose work to get those findings. A proposal offers to clarify, refine, or explore a topic of some relevance. One usually has a hypothesis of some kind to be supported or disproved, but one of the most exciting experiences in science is when the results are unexpected. Nobody writes a proposal that says "I don't believe in AGW and I want money to prove it." They write a proposal that, say, illustrates what they believe are inconsistencies in the measurements of lower tropospheric heat flux, and propose a means to disambiguate the earlier findings. And no, not all proposals are funded. There are limited resources in science just like there are everywhere else. Many good proposals are turned down for the same reason that not all qualified job applicants are hired, and not all qualified students get accepted to every school to which they apply, and not all nice guys get to date Megan Fox. Do good work, propose interesting, relevant science, and you'll sometimes get funded. But not always. -
KR at 01:57 AM on 23 June 2010How many climate scientists are climate skeptics?
Hmm, try this link for more NSF data - I think I mis-entered the one in my previous post. -
Gordon1368 at 01:54 AM on 23 June 2010How many climate scientists are climate skeptics?
The word "consensus" is used to mean two, opposite things in these discussions, and that is not helpful. Many use it as a pejorative term, representing a lack of independent thought, reflecting a desire to conform to the comfortable majority, out of laziness or a desire for funding. To them, a "consensus" represents a convenient but dishonest fabrication. They view people who do not agree with the "consensus" as being therefore more diligent, more honest, more courageous, and therefore more valid. I believe a "consensus" properly indicates a result of multiple lines of independent inquiry, pursued by people often in competition for funding in different locations, institutions, and fields of inquiry, using different methods, yet arriving independently at similar conclusions. Therefore a "consensus" actually is a powerful indicator of validity. A 97% consensus of the independent variety is overwhelming testimony to the validity of the argument, and that is what we have in this case. -
KR at 01:53 AM on 23 June 2010How many climate scientists are climate skeptics?
Berényi, not all proposals get funded. In fact, for the NSF geosciences proposals, the acceptance rates were 31% in 2008 and 44% in 2009, as shown here. If half to two-thirds of all proposals are rejected, you cannot argue that a rejection (even a reconsideration of a rejection, as shown here) is evidence of a bias against a particular scientist or topic. Lots of proposals get rejected. You can only state that the reviewers (over three submissions) and the people in the program thought other proposals were more worth funding for some reason or another - not guess post-facto in the absence of evidence what that reason might be. -
Doug Bostrom at 01:53 AM on 23 June 2010Astronomical cycles
Ken, it seems that indeed you believe there's been essentially no significant warming of the ocean over the past 16 years. That's a remarkably bold assertion and leaves you in a vanishingly small minority, on the fringe even in the contrarian camp. You ought to make a case for your belief. It might be better to take further discussion of OHC to the thread you cited, but let me just remark that "The jump of about 7E22 Joules in a 2 year period is most likely an instrument offset error" is not a demonstration of an error, not a useful argument, it's a supposition for which you supply no evidence other than being uncomfortable with the eyeball appearance of a graph. You need to supply a cogent argument to support your assumption. At the very least, to form a conclusion about the 16 year period better than what the instrumental record suggests, you'll need to fill in the period you're worried about with some numbers. Note that the meta-analysis of OHC described here elaborates real methods and forms a conclusion derived from those methods. It's superior to your graphically-inspired supposition, more trustworthy until you do better work. -
JMurphy at 01:30 AM on 23 June 2010How many climate scientists are climate skeptics?
Arkadiusz Semczyszak wrote : "... and from my country, I will add dozens of scientists from the Polish Committee of Geological Sciences - Polish Academy of Sciences, who officially say: that now it is nature that decides, not man-made ..." Funny how it's always the Geologists who take the opposing view, as they did over Plate Tectonics until they were forced to amend their conservative thinking by facing up to the facts that even they couldn't reject forever. Hopefully it won't be too long before the same happens with regard to global warming. However, the Polish Academy of Sciences, as a whole, support the conclusions of the IPCC, as shown by this statement in Polish. Perhaps Arkadiusz can confirm or deny the contents ? That statement represents the views of all the Divisions and Institutes, including the Division of Earth and Mining Sciences, of which The Institute of Geological Sciences is a part. Alongside them in that Division, but not denying, are The Institute of Geophysics, and The Institute of Oceanology. The Division of Mathematical, Physical and Chemical Sciences don't appear to be denying either. Why is it always the Geologists who think they know better than anyone else in any other field, even when it's not their area of expertise ? -
Berényi Péter at 01:26 AM on 23 June 2010How many climate scientists are climate skeptics?
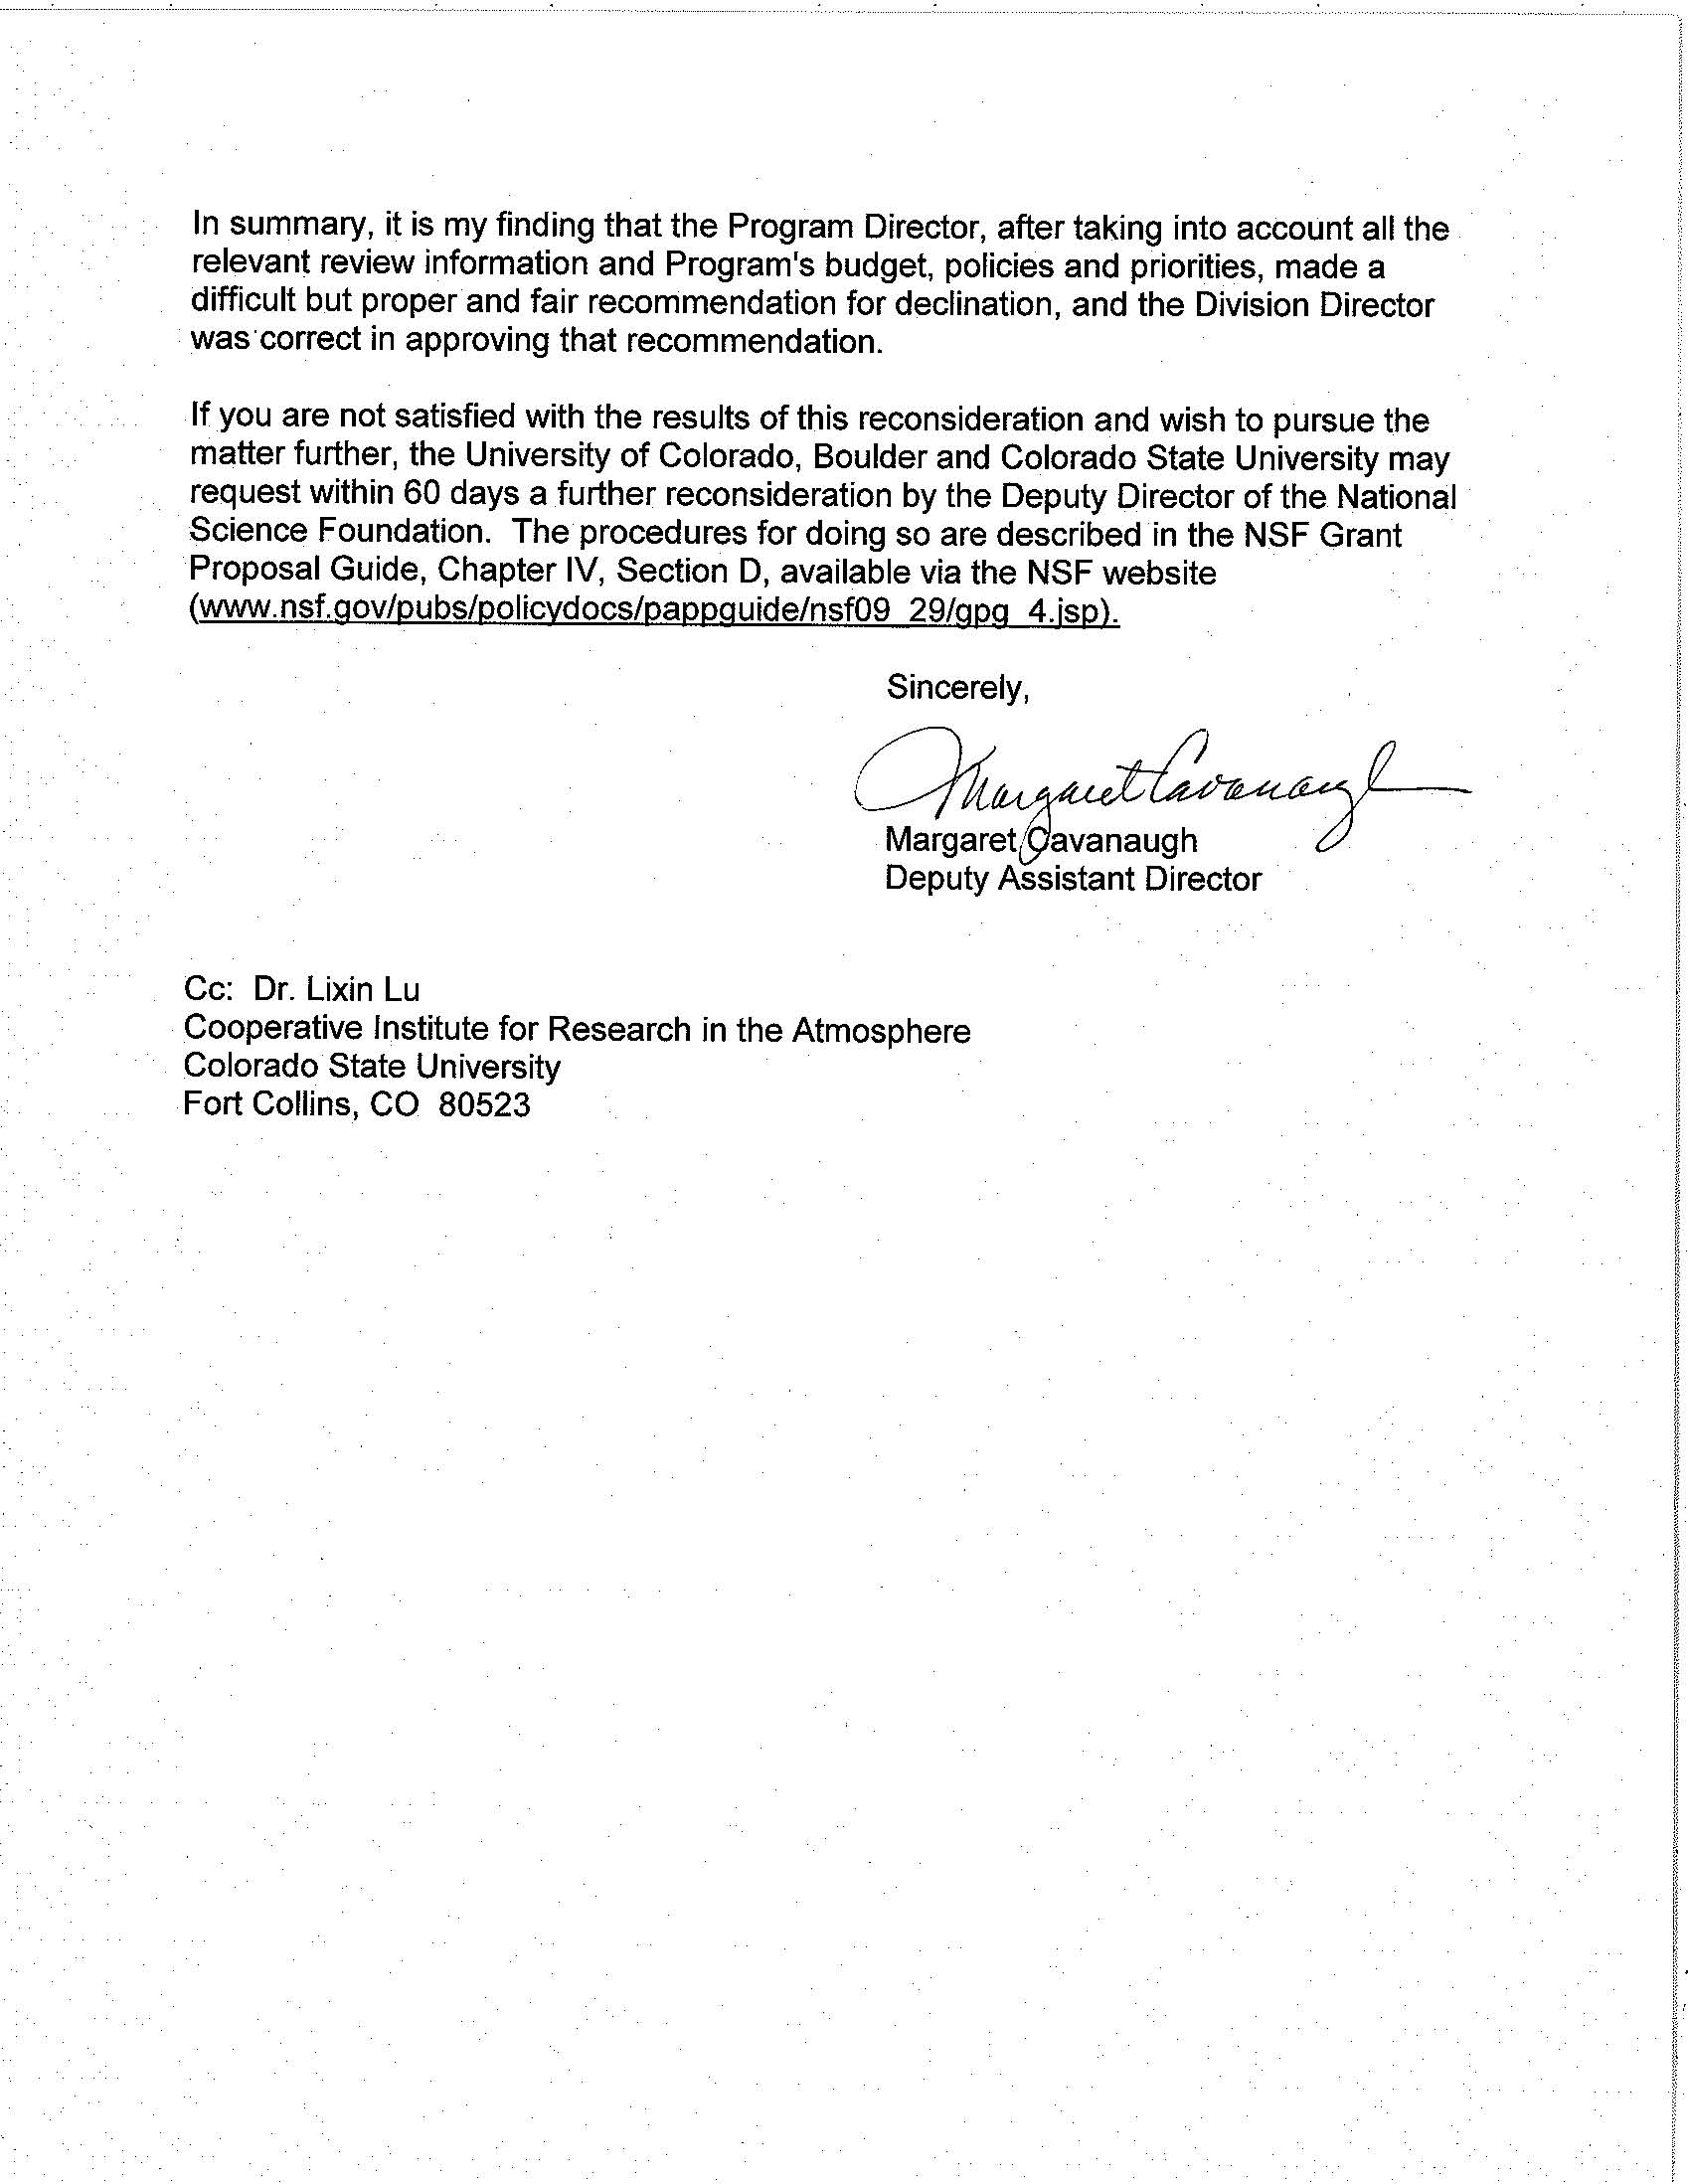
#10 robhon at 00:54 AM on 23 June, 2010 I just don't buy the "funding bias" argument. There are definitely real scientists who are genuinely skeptical of AGW out there who are getting funded. Except when they are not. "It is clear that revisions have been made, and it is clear that reviewers see merit in the project. Nevertheless the proposal was turned down, principally because the Program [Director] has determined that other proposals in this competition were of higher priority."
-
walter crain at 01:22 AM on 23 June 2010How many climate scientists are climate skeptics?
john, thanks for the article. and thanks for keeping track of and offering context/rebuttals for all the skeptics' false arguments. on this topic - the extent of the consensus - i've been bugging gavin over at realclimate to start a "list of jims" (similar to biologists' list of steves) named for james hansen. could you give him a nudge? -
Ian Forrester at 01:15 AM on 23 June 2010Watts it like at a climate skeptic speakers event?
JohnD, at a cost of about $4,000,000 per hectare, how many farmers do you think will be able to convert their fields in such an optimum manner? Any news of any hydroponically grown wheat? Any data on how the price of tomatoes has probably sky rocketed since this technology was started (or how much government subsidy went into it)? A similar piece of nonsense was built in Canada a number of years ago and was a financial disaster once all the government subsidies were removed. You are dreaming in technicolour matey. Time to come down to reality. -
Spencer Weart at 01:00 AM on 23 June 2010How many climate scientists are climate skeptics?
Although I am personally "convinced by the evidence" and am surprised at the number who are not, I have to admit that this paper should not have been published in the present form. I haven't read any other posts on this; the defects are obvious on a quick reading of the paper itself. Here's what I saw: Many scientists might have been "unconvinced by the evidence" and yet chosen not to volunteer to sign a politicized statement that "strongly dissented" from the IPCC's conclusions -- which is the only criterion the authors of the paper had. What if they weakly dissented or are just, like many scientists, shy about taking a public stand? You don't have to invoke groupthink, fear of retribution or all that. The statistics are certainly interesting, but must be interpreted as "2-3% of people who have published 20 climate papers are willing to publicly attack the IPCC's conclusions." That is, to me, a surprisingly high fraction, although I think it can largely be attributed not to the scientific process but to the unfortunate extreme political polarization, which can induce blindness... on both sides. -
sleepership at 00:57 AM on 23 June 2010How many climate scientists are climate skeptics?
Its amazing that the small few-under 5% have so much power. This surely shows the far right agenda still has many believers who listen to those in the 'scientific community' who have limited credibility and still look at the enemy anyone who disagrees with Rush or Beck.
Prev 2352 2353 2354 2355 2356 2357 2358 2359 2360 2361 2362 2363 2364 2365 2366 2367 Next


