


 Arguments


Recent Comments
Prev 2399 2400 2401 2402 2403 2404 2405 2406 2407 2408 2409 2410 2411 2412 2413 2414 Next
Comments 120301 to 120350:
-
Riccardo at 21:06 PM on 19 May 2010Has Arctic sea ice returned to normal?
Eric, you may have noticed the meaning of the last three letters of the acronym PIOMAS: Modeling and Assimilation System. This means that it is not a pure model for projection; instead, measured relevant weather data are used to calculate actual ice volume. Projection ability relies on the quality of the weather data input and eventual failings do not disprove the ability to assess current ice volume. Assuming no trivial errors in the model, the only way to disprove its calculation ability is with independent direct measurements of ice volume. -
Riccardo at 20:57 PM on 19 May 2010Accelerating ice loss from Antarctica and Greenland
The mass loss acceleration from GRACE data appears to be independently confirmed by high precision GPS land uplift measurements in western and southeastern Greenland.Here's the paper (paywalled), here the story reported by ScienceDaily. -
Eric (skeptic) at 20:34 PM on 19 May 2010Has Arctic sea ice returned to normal?
Re 54: the PIOMAS model is already falsified by the failed predictions in GRL "Ensemble 1-Year predictions of Arctic sea ice for the spring and summer of 2008" by Zhang et al. Of course there were uncertainties such as initial conditions, weather patterns changes, weather chaos and water temperatures, but some of those were controllable within the model (some like weather are not). Is there a follow-on paper to this? Don't know, I am still looking. -
thingadonta at 19:33 PM on 19 May 2010The significance of the CO2 lag
"it would be highly useful if you were to beaver through some of the relevant literature and discover whether the factors you mention are indeed actually missing from simulations. " Granted, but the few papers that I have perused do not investigate/discuss possible/modelled cloud cover changes and their effects on T. Cloud cover is also one of Roy Spencer's pet skeptical arguments against strong AGW, I think. There is no discussion in Sheffer 2006 of other various factors in their LIA c02 feedback calculations, a fact they readily acknowledge. They only mention that the various models/simulations are consistent with each other. But they are obviously not incorporating some modern cloud cover trends and their known effects on T. For example, the point on cloud cover and its effect on average T has been used to criticise some claims made about Australia's more recent warming trends. Australia's SE current/recent extended drought means that average annual temperatures are going to be superficially enhanced because cloud cover is obviously reduced during drought periods, and temperatures will therefore average out higher (eg annually), even if there is no 'background' warming. Furthermore, any changes in prevailing wind regimes, at low or high levels, will also change average T, regardless of 'overall' warming. Changes in wind regimes could also enhance night time average temperatures as well, if the wind changes during drought periods are towards a more northerly direction for eg Australia (eg from the Indian ocean-inferred for SW WA extended lower rainfall totals since the 1970s). The same goes for before/after the LIA. Not only can cloud cover changes affect T, but changes in European wind regimes could also affect T. (The recent European winter was bad partly because of the prevailing winds. Changing European wind regimes were even mentioned by some ancient historians about the time the Roman Empire collapsed, I think, but I will have to look that one up). I'm guessing these sort of effects are not 'covered' in any of the paper simulations, whether past Ice Ages, or recent LIA. -
Riccardo at 18:38 PM on 19 May 2010There's no empirical evidence
PaulK, in the comment i responded to you were making a general point on the possibility to have an increasing OLR. What I tryed to show in my comment is that it's actually possible. But we cannot go much further than the overall behaviour with such a crude energy balance model. Even assuming its validity, for example, the position of the minimum in the OLR critically depends on the choice of the parameters involved, not just the actual time response of the system. There's no point in pushing a model beyond its limits. As for the details you're asking for, well, you know, it's a travesty that we cannot track the details of the energy flow through the climate system ;). Stay tuned, hopefully climatologists will come out with a solution or at least with a better aproximation to the short time variability issue. P.S. The easiest "solution methodology" of the energy balance equation I think is to transform the differential equation into an integral equation (see here, for example) which is much easier to solve numerically for any arbitrary forcing. -
fydijkstra at 18:34 PM on 19 May 2010The significance of the CO2 lag
Interesting article! Now we know, that the positive feedback is 15 to 78% on a century scale. But does this mean that we should expect an additional warming in the next century? No, because the positive feedback – if it exists – is already included in the observed warming of the last century. From 1910 to 2009 the global temperature rose 0.71 degrees while the CO2-concentration rose 87.7 ppm (from 299.7 to 387.4 ppm). If the positive feedback is 15-78%, we can calculate that 0.40 to 0.62 degrees of the observed warming were due to direct heat trapping and 0.09 to 0.31 degrees due to the positive feedback. A simple extrapolation to the next century: in 2110 the CO2-concentration could be 560 ppmv. We can expect a total warming of 0.71 x (560-387.4)/87.7 = 1.4 degrees. Of this warming 0.8 to 1.2 degrees will be due to direct heat trapping (supposing that this effect is not yet saturated) and 0.2 to 0.6 degrees to positive feedback. Not much to be worried about, I think. -
sylas at 18:18 PM on 19 May 2010Has the greenhouse effect been falsified?
perseus, on radiation balance, we never speak of radiation balance at the surface itself. We speak there of energy balance. Radiation balance applies at the top of the atmosphere, because this is the only way energy arrives at Earth or is taken off Earth out into space. Radiation balance also applies in the stratosphere (or very close to it) because there is no convection, no weather, no precipitation. In fact, this is a defining quality of the stratosphere for any planet. It is that part of the atmosphere which is in a radiative equilibrium, with negligible vertical energy flows by convection. But note that the title of the diagram I provided is "Global energy flows". At the surface and in the troposphere it is all about energy balance, not radiation balance. -
sylas at 18:11 PM on 19 May 2010Has the greenhouse effect been falsified?
John, the tap analogy is a very good one, and can be used to good effect. It is just an analogy of course, but such things can be excellent stepping stones to understanding of the actual system itself. -
sylas at 18:09 PM on 19 May 2010Has the greenhouse effect been falsified?
perseus, in the paragraph you have quoted, I am speaking of a continuous flow of heat between the surface and the atmosphere. Since the atmosphere is (and remains) cooler than the surface, there is a continuous flow of heat from the surface to the atmosphere. The backradiation is large; but it is not as large as the thermal radiation up from the surface. The actual heat flow, in the proper sense of a flow of energy between two reservoirs at different temperatures, is difference between thermal radiation up and thermal radiation back down. This is 63 W/m2 of radiant heat flow, using the numbers from the energy balance diagram. To this we add 97 W/m2 of sensible heat flows (convection and latent heat). This never comes to equilibrium; or rather, it is a dynamic equilibrium, because the Earth is continually receiving energy from the Sun. This means it maintains its temperature, and there is an unending flow of heat from the Earth to the Atmosphere. You are quite right that the heat sources within the Earth itself are negligible. The temperature of the Earth and the atmosphere are maintained by a continuous flow of energy from the Sun, to Earth, and then back out to space. -
John Russell at 18:03 PM on 19 May 2010Has the greenhouse effect been falsified?
Sorry, I now get it. Thanks for a very clear explanation, sylas. I wrote my comment and then yours appeared before mine after I'd posted. I think what is being said is that the Earth is like a bucket with a tap running into it. The inflowing water from the tap is matched exactly by the water flowing over the rim of the bucket. It's in equilibrium. What's happening within the bucket (the planet and its atmosphere) is irrelevant. Of course, what humans are doing at the moment is raising the sides of the bucket... and increasing the pressure at the bottom -- or is that taking the analogy too far?. Sorry if I'm being simplistic but it's the only way I get my head round things. -
perseus at 17:56 PM on 19 May 2010Has the greenhouse effect been falsified?
17 Upwards atmospheric convection 80 Upwards latent heat of evaporation Yes any radiation imbalance under a steady state scenerio has to be made up from these other heat transfer movements, really this should be made clear. -
perseus at 17:48 PM on 19 May 2010Has the greenhouse effect been falsified?
"The net flow of radiant heat is still upwards from the surface to the atmosphere, because the upwards thermal emission is greater than the downwards atmospheric backradiation. This is a simple consequence of the second law of thermodynamics" I think this extract is at best confusing. If we ignore the heat source in the earth itself and direct anthropogenic heat which are insignificant, surely the net heat flow must balance at any point under steady state conditions, that is in the absence of a greenhouse effect. Radiative differences may occur of course due to convection within the atmosphere. There will be a small net radiative input with a greenhouse effect of course. Neither is it clear what this has got to do with the 2nd law. -
John Russell at 17:47 PM on 19 May 2010Has the greenhouse effect been falsified?
Forgive me interjecting; I puzzled over the same sentence but I'm not a scientist. Should not the sentence therefore read, "The surface of the Earth actually receives in total more longwave radiation from the atmosphere than it does from the Sun." Or have I misunderstood? -
sylas at 17:44 PM on 19 May 2010Has the greenhouse effect been falsified?
Surprisingly, this is correct as given. Here's a rather more detailed account. The energy balance for the Earth is described in: Trenberth, K.E., Fasullo, J.T., and Kiehl, J. (2009) Earth’s Global Energy Budget, in Bulletin of the Amer. Meteor. Soc., Vol 90, pp 311-323. (open access link) The following diagram from that paper summarizes the situation: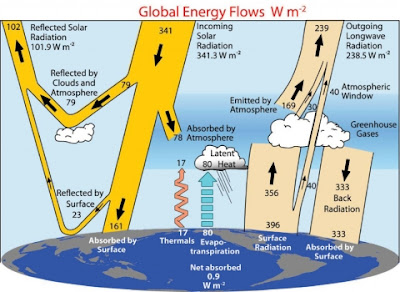 Basically, we are comparing the 184 W/m2 from the Sun which gets to the surface, and the 333 W/m2 which comes to the surface from the atmosphere.
It may also help to do a quick accounting with these numbers:
Total input to the surface (in W/m2):
184 Solar radiation
333 Atmospheric backradiation
---
517 Total
Total out from the surface:
23 Reflected solar radiation at the surface
17 Upwards atmospheric convection
80 Upwards latent heat of evaporation
396 Thermal radiation emitted by the surface
---
516 Total
Imbalance: 1 W/m2.
These numbers are not perfect. In fact, the lead author of the paper has been particularly strident in calling for better measuring systems to nail down the balance much better. There are several good pages here on that matter. See, for instance, Trenberth can't account for the lack of warming, and John's recent blog Tracking the energy from global warming, which explains some of the more direct attempts to measure the imbalance, and obtain values around about 0.6 ± 0.2
But to understand the point you have quoted, a crude estimate will suffice. The Earth's surface is quite warm (fortunately for us) and so it radiates a LOT of heat. On top of that, heat is carried away by sensible heat flows: convection and latent heat.
By conservation of energy, that has to balance what is being received, with any small imbalance being because the planet warming or cooling by absorbing extra energy or shedding it. At present, we have global warming, and the ocean is sucking up some of the available energy as it slowly increases in temperature. But even when there is no warming or cooling, you still have all that energy leaving the surface, which must balance with the energy coming in.
Most of the energy coming to the surface -- about 65% or so -- is atmospheric backradiation. Note that this has the advantage of coming in both night and day. Solar input in the day is larger, but at night it is zero. Without the natural greenhouse effect, nighttime temperature on Earth would plummet as the surface radiated away its energy straight into space.
Basically, we are comparing the 184 W/m2 from the Sun which gets to the surface, and the 333 W/m2 which comes to the surface from the atmosphere.
It may also help to do a quick accounting with these numbers:
Total input to the surface (in W/m2):
184 Solar radiation
333 Atmospheric backradiation
---
517 Total
Total out from the surface:
23 Reflected solar radiation at the surface
17 Upwards atmospheric convection
80 Upwards latent heat of evaporation
396 Thermal radiation emitted by the surface
---
516 Total
Imbalance: 1 W/m2.
These numbers are not perfect. In fact, the lead author of the paper has been particularly strident in calling for better measuring systems to nail down the balance much better. There are several good pages here on that matter. See, for instance, Trenberth can't account for the lack of warming, and John's recent blog Tracking the energy from global warming, which explains some of the more direct attempts to measure the imbalance, and obtain values around about 0.6 ± 0.2
But to understand the point you have quoted, a crude estimate will suffice. The Earth's surface is quite warm (fortunately for us) and so it radiates a LOT of heat. On top of that, heat is carried away by sensible heat flows: convection and latent heat.
By conservation of energy, that has to balance what is being received, with any small imbalance being because the planet warming or cooling by absorbing extra energy or shedding it. At present, we have global warming, and the ocean is sucking up some of the available energy as it slowly increases in temperature. But even when there is no warming or cooling, you still have all that energy leaving the surface, which must balance with the energy coming in.
Most of the energy coming to the surface -- about 65% or so -- is atmospheric backradiation. Note that this has the advantage of coming in both night and day. Solar input in the day is larger, but at night it is zero. Without the natural greenhouse effect, nighttime temperature on Earth would plummet as the surface radiated away its energy straight into space.
-
PaulK at 17:30 PM on 19 May 2010There's no empirical evidence
Riccardo #56 Thanks again. The solution methodology I outlined (superposition) does not have to assume a constant linear forcing with time, but I believe should give an identical analytic answer to Schwartz for this assumption. (I will check this as soon as I have a little time.) Schwartz was roundly criticised as I recall for underestimating tau. The CMIP models have an effective tau in excess of 80 years. If you substitute realistic values in Schwartz's derivative term for a tau of 80 years or greater, you should see a negative gradient over the period 70s to end of century assuming a perturbation from quasi- radiative equilibrium, because over this time period t is much less than tau. This is exactly my point. So why did we see a rising gradient in OLR over this period? Either (a) the CO2 response was overwhelmed by other SW effects over this period (such as decreasing aerosols, decreasing albedo, etc), in which case CO2 was not the primary driver OR (b) there was a planetary oscillatory effect of released energy causing a rise in surface temperature, in which case CO2 was not the primary driver OR (c) that the equilibration period is a lot less than inferred by the IPCC from the AR4 "constant composition" experiments, in which case the climate sensitivty to CO2 has been overestimated OR (d) that there was a historic commitment to a trend of rising OLR following a period of 30 years of decreasing temperatures, in which case the CMIP modeling of quasi radiative equilibrium using aerosol forcing as a matching parameter becomes highly suspect. In any event, it seems to me that one hits a major problem of consistency. -
There is no consensus
Poptech, Yes and I pointed out that you were wrong, the link did not "completely" refute that video. The video points out that practically anyone with a B.S. degree is eligible to sign this petition. This is the key flaw in the Petition Project. The link you provided did not refute this claim. -
MarkR at 17:25 PM on 19 May 2010Has the greenhouse effect been falsified?
RSVP: I think this makes sense, if you divide the Earth's temperature^4 by the blackbody temperature^4 (i.e. temperature minus 33C) then you get a factor of 1.75, i.e. yes, more downwards longwave than solar longwave! Sounds nuts. I did the same calculation for Venus a while back and the factor is obscene; over 90% of the heat flux to Venus' surface can't be solar in origin. -
thefrogstar at 17:04 PM on 19 May 2010The significance of the CO2 lag
We should not abandon our sense of humour either, which is why I post this bit separately. Did anybody else start sniggering at the back when they read: "A review of biospheric feedbacks on temperature suggests that the effect may be small on a time-scale of years (about 3 ppmv CO2 /0C), and moderate at millennium time-scales (about 13 ppmv CO2 /0C), but large at a scale of centuries (about 20 ppmv CO2 /0C)" ? -So it's the middle bit that's the problem (which can be another way of saying that you can get any result you want from a model by selecting the starting and end points of your observations). This suggests two approaches to reducing problems associated with “global warming”: Either a) Wait a few hundred years until the “long term” sets in, and any problem will auto-correct, or b) Start taking measurements later on (or, better still, not at all) because then you will never progress from the short-term to the medium-term, which seems to be where the main problem lies. In either case the solution is to simply ignore the problem or don't try and measure it at all. Now that's what I call kinetics! Discuss. -
RSVP at 16:36 PM on 19 May 2010Has the greenhouse effect been falsified?
"The surface of the Earth actually receives in total more radiation from the atmosphere than it does from the Sun." I think there is a typo needing correction here, but if not, (as in the last article), taken on face value, the implication is another runaway scenario. -
thefrogstar at 16:10 PM on 19 May 2010The significance of the CO2 lag
I'm glad you keep returning to this topic John, and I hope you continue to do. (Not least because I usually seem to arrive late when the insults have already been hurled and everyone seems to be packing up and going home). I also think it's helpful to remind our selves what we may be arguing about, and that we may arrive at rather different conclusions from reading the same paper. Reading the Scheffer paper, I found it to be a worthy and cautious academic paper which presents an alternative (not better) method of modeling, primarily, the effect of temperature on atmospheric CO2 concentrations (this being the more problematic side of the issue). They highlight, and seem well aware of, complexities, and seem quite honest and open about assumptions and possible sources of error. In fact, most of the discussion appeared to be acknowledging these matters. Now, what I did not find is this: I did not find a masterful tour-de-force of non-linear mathematics modeling systems with multiple feedbacks. I expect the authors didn't think so either. That was why I was so pleased to find the "Science of Doom" site that you directed people to earlier this week. It seems a great educational site, and I was fascinated by the "Strange Case of Stratospheric Water Vapour, Non-lineaities and Groceries". Fascinated, but not surprised at learning about one more variable to throw into the pot. I too would urge peole to go and read on this site. Am I expecting too much from the Scheffer paper? I don't think so, because as some one else has already commented elsewhere on this site, if this science is being used to justify proposed changes to our economic and technical way of life (not to mention taxes!), then it's gonna have to be exceptionally good. A model using "the mid-range IPCC estimation of the greenhouse gas effect on temperature [to] suggest that the feedback of global temperature on atmospheric CO2 will promote warming by an extra 15-78% on a century-scale" just doesn't do it for me. Sorry. As far as other details of the Scheffer paper goes, it doesn't really seem to say much about lag phases (not to me, anyway). Enzyme kineticists commonly observe lag-phases with simpler sytems that don't have the feedback mechanism of CO2-based warming. A lag-phase doesn't necessarily rule-in or -out the meat of the argument which is the quantitative aspect. The existence of a lag-phase certainly merits a qualitative explanation of the deviation from a simple rate-equation, and I think it is always important to keep in mind what assumptions underly a model. Assumptions that are forgotten can come back and bite you if a model is applyed to cricumstances where they no longer hold. Thank you to Ned (post#13), interesting abstracts though I doubt I shall find time to read the whole papers. -
Doug Bostrom at 15:13 PM on 19 May 2010Climate Change and the Integrity of Science: a letter to Science
ABM systems still don't work very well, Roy, poor odds for a hit in a distilled environment and certainly rotten when combined with inexpensive countermeasures. That's a matter of limitations of the various radar system wavelengths versus effective antenna gains. Together these leave a serious coverage versus resolution gap. So in that domain, it's possible for people who don't know weapons systems to generalize knowledge about EM limitations and make a successful conclusion. -
RoyLatham at 14:57 PM on 19 May 2010Climate Change and the Integrity of Science: a letter to Science
I looked up a random sample of about 10 names on the list. One of the ten was plausibly connected to climate science, the rest were well-qualified scientists in other fields, like chemistry, cell biology, and conservation. It is a disgrace to the scientific enterprise that scientists pretend to have expertise where they do not. People who are smart about something tend to think they are smart about everything. Wrong/ The idea that it would be difficult to collect 255 signatures of smart people is simply wrong. It was easy to get a load of brilliant scientists, including Nobel Prize winners, to swear that an anti-ballistic missile system could not possibly work. It was an engineering problem, so every scientist was out of field in that case. ABM systems clearly can be made to work; how well is a function of available technology. We had the consensus of learned societies that homosexuality is a form of mental illness. That wasn't reversed until the Seventies. Science is not a consensus enterprise, so calls upon consensus are nonsense in the first place. [edit: please refrain from making baseless accusations of deception] 15 years of no global warming cannot be reconciled with the claim that human-produced CO2 dominates climate. The climate record is out of the 95% bounds of the models. -
WAG at 13:25 PM on 19 May 2010The significance of the CO2 lag
VoxRat (#15): The one exception is Lindzen's conjecture that water vapor will produce negative, not positive feedbacks. I'm not saying Lindzen is right--my understanding is that his "iris effect" has been debunked--but only that it is not illogical. Lindzen agrees with his colleagues that doubling CO2 will lead to about a 1 degree C increase in temperature, leaving water vapor feedback as the key variable. He's at least proposing a scientific mechanism, however dubious, for why doubling CO2 might not lead to the temperatures predicted by other models. I am not a scientist though. To any who are, does this sound roughly correct? -
Doug Bostrom at 13:00 PM on 19 May 2010The significance of the CO2 lag
Thingadonta it would be highly useful if you were to beaver through some of the relevant literature and discover whether the factors you mention are indeed actually missing from simulations. Tying your two posts together, I'm personally more willing to attach weight to modern simulations than works of Dutch masters, though I've always been partial to their work. -
thingadonta at 12:08 PM on 19 May 2010The significance of the CO2 lag
One other point, there is a study somewhere, published in a peer reviewed journal, I believe, of the relative amount of cloud cover in Little Ice Paintings (particularly Dutch) compared to before and after, which appears to indicate that cloud cover was greater in Europe during the Little Ice Age. Does the Scheffer 2006 paper incorporate possible changes in cloud cover during/after the Little Ice Age? I'm guessing it doesn't. Temperatures slowly warm by increase in solar output, clouds gradually dissipate, c02 lag naturally follows the reduction in cloud cover as the oceans also gradually warm and release their c02, which therefore correlates with, but which has little effect on, rising T. ??? Correlation is not causation. I don't think the "Cloud Cover is greater in Little Ice Age Dutch Paintings" is on the skeptic argument list yet. -
thingadonta at 11:39 AM on 19 May 2010The significance of the CO2 lag
"The benefit of this study is it provides an independent, empirical method of calculating the positive feedback from the CO2 lag. These results are consistent with what's been found in simulation studies". Yes, but don't the simulations ignore other possible natural warming factors which are also time-lagged, irrespective of the concomittant increase in C02?. My question is, how does one know that the several hundred year time lag in T after glacials is not caused by other natural factors, such as eg: slow re- distribution of heat from the deep oceans, time lag effects from slow ice break-ups which alter ocean currents, century scale changes in vegetation, century scale changes in high latitude albedo once ice sheets break up, global cloud cover changes once temperatures reach a tipping point, etc etc, and not just from c02 slowly being released from the oceans? -
Ogemaniac at 10:47 AM on 19 May 2010The significance of the CO2 lag
It is always amazing to me how many otherwise intelligent people can't seem to grasp that in a positive feedback loop, order is irrelevant. A causing B causing A, etc is the same as B causing A causing B, etc. Also, few seem to understand that not all positive feedbacks are "runaway". As Chris noted above, any positive feedback loop from A to B and back to A that generates between 0 and 1 new A's for each one at the beginning of the loop will converge to some finite value. Only if one or more A is created during each loop will the the system diverge and "run away". If less than zero A's are "created", it is a negative feedback. CO2 appears to be a convergent amplifier to climate change under the ranges earth typically experiences. -
monckhausen at 08:03 AM on 19 May 2010Heat stress: setting an upper limit on what we can adapt to
correction: 3.45% = 3.45C -
monckhausen at 08:02 AM on 19 May 2010Heat stress: setting an upper limit on what we can adapt to
I do have a question about the effect of CO2 doubling. According to this speaker http://friendsofginandtonic.org/files/0ce6ebe7c0b2f2a2b093195e128c659e-112.html the greenhouse effect is 34.5C. CO2 accounts for 10% of this effect, which is 3.45%. Doubling the amount of CO2, according to the speaker, would cause further warming of 0.345C. This sounds far to simple to be true. According to the speaker, we do not have to worry about the heat stress. What is the presenter's reasoning for such simple maths? -
Species extinctions happening before our eyes
skepticstudent writes " the last few years have seen an incline in the Monarch Butterfly and the larvae only successfully grow to the butterfly stage in cooler temperatures." What is your source for this information? In fact, monarch butterfly populations are at an all-time low. -
chris at 06:50 AM on 19 May 2010Species extinctions happening before our eyes
you're missing the point in each of your posts skepticalstudent: skepticstudent at 04:11 AM on 19 May, 2010 Rather than "making the model do whatever" they "want", the model (which was something like: "based on our analyses of 200 sites in Mexico, here are a set of criteria by which we expect to find local habitats worldwide in which certain lizards will be stressed in relation to surviving Spring warming of such and such a degree"), was found to predict rather well the response of lizards in locations throughout 5 continents of the world In other words it seems to be a very good model for predicting how populations of certain species of lizard will fare in a warming world. skepticstudent at 04:20 AM on 19 May, 2010 Mount St. Helens. Not a good analogy. Mount St. Helens was one volcanic eruption in one place. After the eruption the forces causing environmental destruction ceased. So the environment was bound to recover and no doubt populations outside the affected area are recolonizing. In the case of the lizards, the warming insult is not going to stop. The lizards will not be returning to those habitats. Moreover this is happenining not just at one locale as a result of a single perturbation, but is happening in 5 continents in response to a continuing and increasing global scale warming. -
Doug Bostrom at 05:38 AM on 19 May 2010Species extinctions happening before our eyes
Slightly off-topic, but the unavailability of full-text papers is a sad impediment for amateurs such as most of us here when discussing findings such as this one. Before his remark was deep-sixed because he was unable to resist making some unfounded judgments, skepticalstudent referred to some missing temperature station data. Skepticalstudent, would you mind pointing us to an open copy of this paper's supporting materials, so we can take a look at what you're talking about? Thanks! -
Philippe Chantreau at 05:37 AM on 19 May 2010Species extinctions happening before our eyes
Skepticstudent displays a common misunderstanding of what a model is:"I can make a climate or any kind of model do what I want it to do." No, you can't. A very simple mathematical model would be y=ax+b. This model will do what its maths impose and you can't make it do anyting else. If one designs that model in order to predict where to find y, and the position predicted by the model is not verified in reality, the model is wrong and has to go back to the drawing board. If its prediction is verified, then it is good. The model described in Ned's post seems to be extremely successful, and would in fact be a rather impressive achievement. -
skepticstudent at 04:20 AM on 19 May 2010Species extinctions happening before our eyes
http://seattletimes.nwsource.com/html/localnews/2011876112_volcano16m.html http://seattletimes.nwsource.com/flatpages/video/mediacenterbc3.html?bctid=85750359001 Are two newspaper article videos of species that have made fantastic comeback/adaptation to their surroundings despite massive changes in their surroundings. Now before any of you try to make the assertion that this doesn’t equate to Mexico think for a second. Suddenly a massive volcano blows up wiping out trees for hundreds of square miles. Clogging rivers with ash, trees, choking them with ash, and acid and other poisons. Mt St Helens did to the Tuttle valley what evolutionary scientist said took 10 billion years, in 3 days. There were trout and salmon back in the rivers and lakes in less than 3 years. There were birds, lizards, salamanders. Trees were gone, thus the ground temperatures were far far warmer than they had ever been before. I was up at Mt St Helens a short time after the blast. It was like a Nuclear bomb, no roughly about 380 Nagasaki bombs went off. To try and tell me that lizards are dying because of supposed recent changes in temperatures over a 20 + year period because they can’t “evolve” fast enough is nonsense. Animals adapt to living conditions quickly every day all over the world. I think this is a very very poor representation for the climate warming side. -
monckhausen at 04:19 AM on 19 May 2010The significance of the CO2 lag
Addendum: Human-emitted CO2, in contrast to the ocean-emitted CO2, does not lag, it is emitted instantaneously. Following the logic applied by 'skeptics' like Joanne Nova, something 800 years ago must have triggered our present human CO2 emissions. This, of course, does not make any sense. However, since oceans and humans can emit CO2 simultaneously, CO2 can lag and lead at the same time, depending on its source. monckhausen http://friendsofginandtonic.org/ -
Marcel Bökstedt at 04:16 AM on 19 May 2010The significance of the CO2 lag
It seems to me that the paper by Scheffer does not apply the "lag" argument, instead it uses a very subtle approach, depending on several quite difficult estimates. Stating the upper limit as "78%" sounds a little ridiculous taking the great uncertainties into account. Is it possible to use the lag of CO2 levels after temperature to make an independent estimate on the feedback effect? -
skepticstudent at 04:11 AM on 19 May 2010Species extinctions happening before our eyes
Ned, I can make a climate or any kind of model do what I want it to do. I want to know if they studied the habitat. Did they study the food of the lizards. Did they study if anything has changed other than weather or are they strictly using weather models? Like I mentioned earlier there have been larger than normal monarch butterfly escape into North America. The monarch butterfly only has large escapes during years where winter and spring weather is cooler than normal. So one tends to wonder about their comments about warmer climes wiping out a species locally or otherwise. -
Ned at 03:32 AM on 19 May 2010Species extinctions happening before our eyes
skepticstudent writes: Why would lizards suddenly start dying in Mexico and no where else in the world? They did a study of lizard populations in Mexico, and derived a model that can be used to predict lizard population dynamics in general. Then, they tested this model by comparing its predictions to field studies from all over the world: "The global generality of our model is verified by concordant distributions of current observed and predicted local extinctions of lizard biotas from four other continents (table S7). Our model pinpoints exact locations of two Liolaemid species going extinct in South America (Liolaemus lutzae, Phymaturus tenebrosus: {chi}2 = 32.1, P < 0.0001). In addition, the model predicts recent (2009) extinctions among 24 resurveyed populations of L. lutzae ({chi}2 = 8.8, P = 0.003). In Europe, our resurvey of Lacerta vivipara revealed 14 extinct sites out of 46 (30%), which are predicted quite precisely by the model ({chi}2 = 24.4, P < 0.001). In Australia, the model pinpoints 2009 extinctions of Liopholis slateri ({chi}2 = 17.8, P < 0.00001) and 2009 extinctions of Liopholis kintorei ({chi}2 = 3.93, P = 0.047). In Africa, analysis of Gerrhosauridae and Cordylidae at 165 sites predicts <1% extinctions, and yet the model pinpoints the single extinction reported by 2009 (exact P-value = 0.006). We temper this value with extinction projections of 23% for 2009 at Malagasy Gerrhosauridae sites, which is validated by the observed 21% levels of local extinction across several lizard families in Madagascar nature reserves (23)." Tables S7A, B, C, and D in the Supplementary Online Material provide all the details about these surveys. It looks like a pretty massive effort. -
Ned at 03:17 AM on 19 May 2010Species extinctions happening before our eyes
No problem, Argus. By the way, I had no idea English is not your first language -- you write better than many native speakers. -
monckhausen at 03:09 AM on 19 May 2010The significance of the CO2 lag
Co2 lags and leads. 1. Increased solar activity leads to T increase. 2. Oceans warm up slowly 3. Once oceans have warmed up (the 800 year lag story), they cannot hold the CO2, which is emitted. 4. The emitted CO2 causes a positive feedback. At this point, CO2 leads. That's what the 'skeptics' generously ignore. 5. In the case of the Vostok ice core, deglaciation owing to CO2 followed initial CO2 release from oceans warmed by solar activity. monckhausen http://friendsofginandtonic.org/ -
skepticstudent at 03:04 AM on 19 May 2010Species extinctions happening before our eyes
I can't see the whole article so I don't know so i'm asking. Why would lizards suddenly start dying in Mexico and no where else in the world? Lizards survived 10 million years of heat warmer than what is currently anywhere in the world. Did they do any studies on the habitat itself or on the food sources in the area... Also I find it interesting that despite their claims of temperatures being higher in the areas, the last few years have seen an incline in the Monarch Butterfly and the larvae only successfully grow to the butterfly stage in cooler temperatures. I'm not just sayin... just sayin ya know? -
chris at 03:00 AM on 19 May 2010Species extinctions happening before our eyes
Arkadiusz Semczyszak at 21:17 PM on 18 May, 2010 Well now you're changing the subject. The examples you give are localized climate changes. No one disagrees that local climate changes like these can be large and quite fast, and no doubt these have had devastating effects on local populations, including extinctions. However your earlier post with its lazy snipe at Mann, that I responded to was about global/hemispheric (???; we don't know since you won't respond to a simple question about where your "data" is from) temperature variation during the last millenium and its comparison with modern global temperature change. It is the very rapid global scale temperature rise combined with additional human "insults" on the natural environment (especially habitat destruction/fragmentation) that is the concern. So going back to the paper at hand (Sinervo et al, 2010), the authors describe concurrent local extinctions of lizard populations across the 5 continents of the world, very likely in this case, due to global warming. -
CoalGeologist at 02:45 AM on 19 May 2010The significance of the CO2 lag
Although the present discussion rehashes concepts that have been explained many times before, scientists must never tire of the need to repeat them as often as necessary. Kudos to SkepticalScience.com for having taken up the gauntlet once again. The argument that the rise in temperature preceding the rise in CO2 (in the Pleistocene ice record) disproves AGW remains one of the most beloved and commonly-encountered arguments in AGW Denialism. The enduring appeal of this argument is partly related to its simplicity. After all, the correlation is so obvious, even a 'caveman' could see it: First temperature increases, then CO2. The other major appeal (to some) is that it (superficially) appears to 'debunk' AGW (so long as one doesn't look too carefully). Yet, in one of the many "ironies" that characterizes AGW Denialism, many wannabe skeptics cannot resist the temptation of piggybacking onto this another favorite Denialist argument: that "correlation does not imply causation". This scientific axiom is often conveyed with a sanctimonious withering (virtual) sneer, as if real scientists failed to grasp this concept, or as if the entire theory of AGW rested on this correlation. Check it out yourself: A Google search on: "correlation does not imply causation" + temperature increase leads CO2 yields ~4,500 'hits', most of them being denialist (i.e. pseudo-skeptical) in nature. Wouldn't it be nice if Denialists understood their own advice enough to actually adhere to it? After all, if a simple correlation between temperature and CO2, documented throughout the geologic record, does not in and of itself prove causation, then why should the ~800 year lag in the Pleistocene ice record necessarily disprove it? The 'bottom line' is that a valid understanding of the interrelationship between temperature and CO2 requires a more complex understanding of the processes affecting the system, although once these processes are understood, a primary forcing on temperature by CO2 emerges. Our current understanding of what happens to atmospheric CO2 remains incomplete even in regards to contemporary proesses, and we have a great deal more to learn regarding the geochemical cyclicity of CO2 in the atmosphere, hydrosphere, and lithosphere on a geologic time scale, but while we're still studying and learning, it is important to interpret the presently available data without bias or agenda. If AGW is wrong, it's not because of the ~800 year "lag". So, true skeptics: Keep looking for legitimate weaknesses in AGW. It's your right and duty; And denialists, could we please move on? This argument is getting a bit threadbare. -
Argus at 02:35 AM on 19 May 2010Species extinctions happening before our eyes
#64 Ned, My apologies! I should have phrased my remark differently (or withheld it). My native language is not English, so maybe that made it come out even worse. But looking through the 100+ different topics or posts, I have a hard time finding one that is not based on the effects of an increasing percentage of CO2 in the atmosphere. But as you point out, that is the subject of this website (for which I am grateful). -
Phila at 01:54 AM on 19 May 2010Species extinctions happening before our eyes
#58 "Some of the science is over my head, but I appreciate and enjoy reading it never the less." When science is over my head, as it often is, I refrain from assuming that it's the scientists who are getting things wrong. I assume there's a failure of understanding on my part, not theirs. "Oh well LOL" isn't a coherent counterargument. "the author stated that he didn't consider Australia a continent, but an island." Australia is normally considered to be a continent, in both geological and geographical terms. The author you cite seems to calling it an island in order to discard inconvenient data. That should raise some red flags, I think. -
Steve L at 01:53 AM on 19 May 2010The significance of the CO2 lag
The data in 1b do not look linearly related to me. -
Spencer Weart at 00:48 AM on 19 May 2010The significance of the CO2 lag
Full citation is Scheffer et al., Geophys. Res. Lett.,33,L10702,doi:10.1029/2005GL025044,2006 online here -
VoxRat at 00:41 AM on 19 May 2010The significance of the CO2 lag
WAG: What's the one exception? -
WAG at 00:25 AM on 19 May 2010The significance of the CO2 lag
The real problem with this argument is that it is simply illogical. Just because CO2 lags temperature does not prima fascia rule out the possibility that CO2 can also cause temperature to increase. That's the beauty of global warming skeptics - of all the skeptic arguments, all of them except for one are not just scientifically wrong: they are simply logical fallacies. -
Ned at 00:18 AM on 19 May 2010Species extinctions happening before our eyes
Argus writes: [...] whereas this site blames everything on CO2 [...] Please let's be careful in our use of language. Yes, the article at the top of this thread focuses on climate change and doesn't discuss land use, invasive species, or other non-climate stresses on species. But I don't think anyone here is ignorant of or dismissive of the effects of those stresses. We mostly talk about climate change here because that's the subject of the website. Certainly, invasive species and land use change will exacerbate the problems of climate change for many species.
Prev 2399 2400 2401 2402 2403 2404 2405 2406 2407 2408 2409 2410 2411 2412 2413 2414 Next


