


 Arguments


Recent Comments
Prev 235 236 237 238 239 240 241 242 243 244 245 246 247 248 249 250 Next
Comments 12101 to 12150:
-
TomJanson at 23:39 PM on 7 June 2019Tree-rings diverge from temperature after 1960
The relationship between temperature and tree rings seems quite complex. It doesn’t sound like anyone can properly explain the divergence problem. So how come climate scientists are so confident that past tree ring data is reliable?
-
nigelj at 18:35 PM on 7 June 2019Climate Change vs Cosmological Catastrophe
I have a similar reaction that the end of world scenario in the video is a bit irrelevant to the climate issue and beyond our control, however here is something of general interest that I just find personally intriguing: 20 ways the world could end.
-
nigelj at 12:43 PM on 7 June 2019State of the climate: Heat across Earth’s surface and oceans mark early 2019
OPOF, that CO2 chart is very illuminating, and yes yearly atmospheric C02 growth rates typically increased after 2011. If you look at trends of emissions they underwent an obvious increase in the rate after 2000 due to an increase in use of oil and coal here, (in Asia I think) so presumably the increase in the yearly rate of atmospheric growth rates from 2011 is a delayed response to this?
Although yearly rate of atmospheric growth rates changed after 2011, If you take the years 2012 - 2018, and adjust 2015 and 2016 down to say 2.4 to reflect the fact they were in the middle of a big el nino (just a guesstimate on my part), then the trend across the whole period is about 2.2 on average, and fairly flat looking. So this might be a good sign that rates of use of fossil fuels are at least not accelerating since 2012, so far anyway.
-
One Planet Only Forever at 12:27 PM on 7 June 2019Climate Change vs Cosmological Catastrophe
Nobody should concern themselves with something that cannot be influenced by collective human actions.
It is more terrifying that correction resistant Leaders are still incorrectly Winning support more than 30 years into the improving well established Climate Change understanding.
Leaders are undeniably aware that the incremental impact of everyone who uses fossil fuel accumulates into long-lasting massive future harm and that fossil fuel use creates no lasting benefits (in many cases no benefits beyond the moment of their use).
What is most terrifying is that developed popularity and profitability also develops powerful resistance to correction.
Without changing the systems humans have developed into systems atht actually govern and limit human activity to minimize harmful actions and maximize helpful actions, humanity will fail to develop a better future.
People can be easily impressed by new technological toys, that are also likely to be harmfully unsustainable activities, into believing that things are getting better when the opposite is more likely the reality.
The real terrifying thing is how harmful the thinking of people in supposedly more advanced nations can actually be.
Everybody should be terrified by how correction resistant many supposed winners/leaders are, and the unjust popularity and profitability they can get through misleading marketing.
-
AristotleM at 10:51 AM on 7 June 2019If growth of CO2 concentration causes only logarithmic temperature increase - why worry?
Download the excel data and view the chart...that's not a linear relationship. The graph looks to me like a snapshot of a logarithmic curve.
I'm also confused about the Cumulative emissions: how do we know how much CO2 man's activities added to the total, and how much was due to natural sources, like volcanic activity, respiration, or organic decomposition? Why is it being expressed as a cumulative figure, when we know CO2 is absorbed by some things (like plants) and can be separated into its constituent components by natural energy releases at ambient temperatures...like a lightning storm on a warm evening.Also, the emissions are expressed in GtC...Gigatonnes of Carbon. Don't we weight things using an independent standard...like Newtons, Grams...or Pounds? The GtC scale implies that we're only interested in the carbon...which is only part of the CO2 molecule and only 1 of 2 components (one of C & one of O2) and it’s not the heaviest of them. Oxygen is 25% heavier than Carbon...and there are two oxygen atoms per CO2 molecule. Of any amount of CO2, the portion of carbon would be 27.2% of the total...more than a quarter, less than a third. Is the graph saying that the temperature rise between freezing and 5 C (41 F) is the result of accumulating 9191 Gigatonnes of CO2? Has there ever been that much CO2 in the atmosphere at once? Ever?
Moderator Response:[TD] For the airtight evidence that humans are responsible for 100% of the recent rise of the CO2 level in the atmosphere, see the post How Do Human CO2 Emissions Compare to Natural Emissions? There are multiple lines of evidence, but all you really need is the one that relies only on algebra.
-
scaddenp at 10:07 AM on 7 June 2019Increasing CO2 has little to no effect
ebelba - doubling CO2 by itself gives an extra 4W/m2 (your equation) to surface of the earth and that corresponds to ~1.1C increase in global temperature. All of the rest of temperature increase is due to feedbacks as you outlined which is why climate models are so complex and why the range of climate sensitivity estimates is so large.
The IPCC WG1 report, starting with the technical summary, is quite definitely the best place to start getting an education because you can go from technical summary to full report and from there down into the referenced papers.
The 1984 "Climate Sensitivity: Analysis of feedback mechanisms" is now dated but not a bad starting point as well. Check out the more recent Proistosescu and Huybers though.
-
One Planet Only Forever at 09:16 AM on 7 June 2019State of the climate: Heat across Earth’s surface and oceans mark early 2019
A related important data set is the atmospheric CO2 concentration values.
The presentations of information for CO2 compiled by NOAA include the following about the "Annual Mean Global Carbon Dioxide Growth Rates".
What is glaringly obvious, and cause for concern, is that the growth rates since 2011 have exceeded 2.0 ppm. In the set of earlier years there were some years over 2.0 ppm growth. But they were interspersed with rates well below 2.0 ppm growth.
So far in 2019 the average of CO2 monthly increases also exceeds 2.0 ppm.
I wonder of the 'Business as Usual' case that is often talked about needs to be updated to reflect the reality that 'Increase of Harmful Business has been Becoming More Usual'. That update would result in even higher temperature increases in the nearer and distant future due to more rapidly increased CO2 levels than the apparently outdated 'Business as Usual' case.
-
ebelba at 07:28 AM on 7 June 2019Increasing CO2 has little to no effect
PS I noticed you folks are typing quite lengthy responses and spending a lot of time answering a lot of (some quite silly) people with much more patience than I would have with such people. A simple link to read a paper or two would be fine. Math and statistics is not a problem, these are my fields of education, but I have not read much climate science and would like to. Just need a good place to start and I can follow bibiliographies from there. Thanks again.
-
ebelba at 07:04 AM on 7 June 2019Increasing CO2 has little to no effect
I think I understand the spectrum graphs and the role of CO2 in the outer layers and the sensitivity to the CO2 concentration relative to the base level in the simple model. My question is: as the global mean temp rises, and water vapor rises, and polar ice cap coverage decreases, a number of things change. Surface reflection changes, ice reflects whereas open ocean absorbs; water vapor convection and absorption change. Is there an equation equivalent to the 5.35 ln (C/C_0) equation with additional terms for these effects? Or is that equation already based on a models which already have these additional feedback effects? Thanks.
-
scaddenp at 07:02 AM on 7 June 2019It's magnetic poles
The Kerton argument is obviously codswallop but I have also heard (only once), the suggestion that the weakening of the magnetic field was producing via <unknown physics>, a effort on climate that all of man's ingenuity at measuring physical parameters had somehow missed. However, the lack of evidence for any change in glacial extent associated with the last polar reversal (when magnetic field strength became very weak) is a strong counter-argument.
-
MA Rodger at 02:06 AM on 7 June 2019It's magnetic poles
The full text of the article cited at the top of the [absent] OP is available on-line - Kerton AK (2009) 'Climate Change And The Earth’s Magnetic Poles, A Possible Connection'. The bold assertion is that the alleged correlation between global temperature & both change in longitude & latitude of the magnetic North Pole cannot be conicidence. Yet I feel the numbers presented for this change in longitude/latitude is today evidently arrant codwallop. The source cited is from Kyoto University which is showing latitudinal movement in the Magnetic North Pole peaked in 2005 and is now stopped and about to begin to decrease. And the increase in longitude peaked a couple of years bac, but that is purely due to the Magnetic Pole passing close to the rotational North Pole where longitude is rather dense. The link provides this graphic:-

And this is just the northern Magnetic Pole. The northern Geomagnetic Pole is much less cooperative and the sothern equivalents of both would need some serious explaining-away by anybody advocating a link between the northern pole-monement and global or hemispherical temperature.
Sadly, there are other attempts to be found that are trying to breathe life into this dead parrot.
-
Daniel Bailey at 01:00 AM on 7 June 2019It's magnetic poles
Besides the obvious, that air is not ferrous, here's what I have:
Scientists understand that the human impacts on the Earth, it's temperature and its climate are the dominant impacts because scientists have thoroughly studied all of the factors capable of forcing the observed changes since preindustrial times.
While the Earth's magnetic axis is shifting somewhat, Earth's rotational axis shifts only a little bit, mostly in response to the mass redistribution of water around the Earth from land-based ice sheet losses. This is a normal response.

The net change in the position of the Earth's rotational axis is about 37 feet. The largest annual change is about 7 inches.
If you move over 37 feet, the climate doesn't change. It changes even less per year if you only move 7 inches.
https://www.jpl.nasa.gov/news/news.php?feature=6332
The research paper itself is here:
https://advances.sciencemag.org/content/2/4/e1501693
While the Earth's magnetic field is weakening a bit and its magnetic axis is shifting somewhat, magnetic field polarity changes have no effects on climate on the timescale of human lifetimes because air isn’t ferrous. The effects on hand-held compasses are insignificant. For purposes of electronic navigation, changes in the position of the magnetic poles are constantly updated in navigational databases.
https://www.ncei.noaa.gov/news/tracking-changes-earth-magnetic-poles
https://www.ncei.noaa.gov/news/world-magnetic-model-out-cycle-release
https://www.ngdc.noaa.gov/geomag/GeomagneticPoles.shtml
https://www.ngdc.noaa.gov/geomag/faqgeom.shtml
https://www.maritime-executive.com/article/position-of-magnetic-north-pole-officially-changed"The last time that Earth's poles flipped in a major reversal was about 780,000 years ago, in what scientists call the Brunhes-Matuyama reversal. The fossil record shows no drastic changes in plant or animal life. Deep ocean sediment cores from this period also indicate no changes in glacial activity, based on the amount of oxygen isotopes in the cores. This is also proof that a polarity reversal would not affect the rotation axis of Earth, as the planet's rotation axis tilt has a significant effect on climate and glaciation and any change would be evident in the glacial record."
And
"The science shows that magnetic pole reversal is – in terms of geologic time scales – a common occurrence that happens gradually over millennia. While the conditions that cause polarity reversals are not entirely predictable – the north pole's movement could subtly change direction, for instance – there is nothing in the millions of years of geologic record to suggest that any of the 2012 doomsday scenarios connected to a pole reversal should be taken seriously."
https://www.nasa.gov/topics/earth/features/2012-poleReversal.html
https://science.nasa.gov/science-news/news-articles/earths-magnetosphere"What would happen if the magnetic field of the Earth suddenly changed?
Magnetic field wandering would let the aurora borealis occur at any latitude, but other than that there would be no noticeable effects other than changes in the amount of cosmic rays that penetrate to the ground. Even this effect is minimal because we can visit the Arctic and Antarctic and only receive a slight increase in cosmic rays. So long as the strength of the field remains high during this field wandering event, the effects should be pretty benign."
https://image.gsfc.nasa.gov/poetry/ask/q279.html
https://www.livescience.com/18426-earth-magnetic-poles-flip.html
"one total bonus of having a weaker magnetic field is that auroras will be visible from much lower latitudes, so the nighttime skies will be even more epic"
https://news.nationalgeographic.com/2018/01/earth-magnetic-field-flip-north-south-poles-science/
(-technical, non-climate discussion on geodynamics here-)
Apart from the potential light shows, no credible effects on climate on the timescale of human lifetimes. Scientists have this one covered.
Climate Forcings:
Changes in the sun's output falling on the Earth are about 0.05 Watts/meter squared.
By comparison, human activities warm the Earth by about 2.83 Watts/meter squared (AR5, WG1, Chapter 8, section 8.3.2, p. 676).
What this means is that the warming driven by the GHGs coming from the human burning of fossil fuels since 1750 is over 50 times greater than the slight extra warming coming from the Sun itself over that same time interval.

https://science2017.globalchange.gov/chapter/2/#fig-2-3
It's not magnetic field changes or the sun or natural cycles.
It's human activities, primarily driven by the human burning of fossil fuels.
Period.
-
GrahamC at 21:06 PM on 6 June 2019It's magnetic poles
I could really use some help in arguing against this myth at the moment. Are there any plans for the page to be completed?
-
Doug_C at 02:27 AM on 6 June 2019Effects of Global Warming
ianw01 @15
It's not good here.
Although we've had a carbon tax for over a decade in BC, it is next meaningless when the government gives exemptions to some of the largest CO2 emitters.
John Horgan offers tax break incentives to $40B Kitimat LNG project
How exactly are we addressing fossil fuel driven climate change when official policy at the highest level is effectively paving the way for decades more fossil fuel extraction and burning at a massive level.
In BC it gets ever worse than that, the Site C dam has been controversial for decades yet with no real approval process taken a massive hydro-electric project that will cost the people of BC over $10 billion will be built in the middle of the Montney gas formation that will be used to power gas gracking for decades.
This will produce trillions of cubic meters of gas and leak large amounts of methane into the atmosphere. Fracking itself endangers ground water and destabilizes the bedrock over large areas producing greatly increased sesmic activity.
Then is no rationality at all in energy policy in BC or anywhere in Canada. The entire nation has become captured by the fossil fuel sector. Instead of debating how to get off all fossil fuels as quickly as possible we're fighting over where to ram new oil and gas pipelines through and even "Green" leaders are claiming Canada must utilize our fossilf fuel reserves for decades more.
Which was the same argument decades ago when climate change was first recognized as an existential threat. The claim here is that because Canada is only responsible for about 2% of the world's CO2 emission we can keep doing what we want and no one will notice.
But Canada makes up about 1% of the global population so on an individual level Canadians are some of the largest emitters of carbon dioxide.
We have a lot of room to change and little political will to actually do so despite all the virtue-signalling of Justin Trudeau who said this at the Paris climate change summit in 2015.
'Canada is back, my friends. Canada is back, and here to help,' prime minister tells delegates
He then went to an oil and gas symposium in Houston Texas and said this to oil execs.
No country would find 173 billion barrels of oil in the ground and just leave them there,
I'm ashamed to say that Canada as a nation is not going to be part of a solution to this existential crisis we have forced ourselves into by blind greed.
-
ianw01 at 01:46 AM on 6 June 2019Effects of Global Warming
Doug_C @ 8: Speaking of cognitive dissonance, let's not omit BC's continued enthusiasm for coal mining and export: https://nationalpost.com/news/politics/yes-anti-pipeline-vancouver-really-is-north-americas-largest-exporter-of-coal
-
MA Rodger at 18:28 PM on 5 June 2019Effects of Global Warming
William @9,
Picking up on your "what are we going to call the 2.75 million year period" question, I'm not sure what prompted it. Your preceeding sentences sound perhaps a bit accusative and if so, perhaps you mis-read the OP that actually mentioned "cold periods (so called Ice Ages)" over the past 800,000 years.
The period prior to the Holocene and back +2½million years does have a name, the Pleistocene and it is a period of 'ices ages' and 'interglacials'. The characteristic that makes it different to the periods before was the preceeding formation of the Panama Ismuth and the subsequent arrival of (or perhaps the more extensive arrival which Knies et al 2014[PDF] appears to show) permanent polar ice in the Northern Hemesphere, particularly the Arctic Sea Ice. In light of the permanence of NH ice through the Pleistocene (it apparently didn't disappear in the Eemian, for instance see Stein et al 2017) I think the arrival of ice-free Arctic summers for the first time in millions of years is a strong scientific message that has yet to be wielded properly.
-
scaddenp at 12:43 PM on 5 June 2019CO2 is just a trace gas
Not sure that "emitting particle" is right, but radiation spectrum is absolutely dependent on temperature. And, yes, you can use the theory to predict spectrum of radiation at TOA or at surface of earth, or by how much the spectrum should change if you increase say CO2 from 400 to 440ppm. These have all been done (eg here) and predictions match observations with exquisite accuracy (a fair bit of advanced tech depend on these equations being correct).
-
Rovinpiper at 12:33 PM on 5 June 2019CO2 is just a trace gas
I see.
So, tell me. Doesn't the spectrum of emitted radiation depend on the temperature of the emitting particle?If that is the case, then doesn't it provide a pretty convenient test of this theory?
-
Doug_C at 11:49 AM on 5 June 2019Effects of Global Warming
I also think it is far past the time to keep letting free market forces determine the energy model we use. From all the evidence if energy policy isn't controlled and guided at a global level then we face catastrophic conditions on Earth that make free market economics or any thing else human related moot. Because we keep doing what we're doing much longer then there will be no people left.
I think there need to be hard targets imposed on the energy market that have a 50% reduction in fossil fuels use by 2030 and a 100% by 2050.
This would require somthing like much safer and hihgly efficient Gen IV nuclear power to be implemented on a large scale in conjunction with renewable energy.
-
TVC15 at 10:54 AM on 5 June 2019Climate's changed before
Thanks again MA Rodger @ 724
The deniers worship the US climate denier blog sites such as WUWT. It's ridiculous what that site puts out. The US also has the Heartland Institute whose mission is to instill doubt in American minds about the science of climate change than the Heartland Institute.
This is a tyical US denier rant:
"Hot places get hotter in the summer. Weather is not climate, but climate changes naturally due to the Sun, and other factors. If you want to live like a Stone Age Stooge, plus pay exorbitant prices for energy and ALL products and services, be my guest, but don't force others to follow your cult like religion to make yourself feel relevant in the Universe."
-
TVC15 at 10:44 AM on 5 June 2019Climate's changed before
Thanks MA Rodger @ 724
The climage deneir was the one who made this statment: And as you know, nature's impact on climate can and has been EXTREME prior to man, and man's industrialization. How do you account for that?
In my orgional post I had it indented so others would know this was not my statment.
-
TVC15 at 10:41 AM on 5 June 2019It's the sun
Thanks [PS]!
-
Doug_C at 10:41 AM on 5 June 2019Effects of Global Warming
Ger @11
That's probably for the current light water reactors, I'd be really interested to see what the numbers are with MSFRs when they finally get one up and running. With only a fraction of the concrete needed for secondary containment with a light water reactor they should sharply cut the initial carbon output and with the much higher fuel efficiency and greatly reduced waste stream the operational and end of life costs and footprint are probably going to be much smaller.
Instead of large batches of degrading fuel rods being removed every few years as with light water reactors they would be pulling fission products constantly out of solution from an MSFR and either storing them onsite or selling some of the fission products such as medical radioisotopes or xenon to the aerospace sector where it is used as ion rocket fuel. And with very little TRUs the long term waste costs and footprint is also going to be a fraction of current costs with LWRs.
One thing that will be an issue is the meter thick steel neutron reflectors that after several decades of operation are going to be a radiological hazard for decades as cobalt-60 has a half life of 5.6 years.
-
Ger at 08:35 AM on 5 June 2019Effects of Global Warming
@Nigelj, @Dougc:
Comparison of the GHG footprint of several generation techniques can be found en.wikipedia.org/wiki/Carbon_footprint. Nuclear at 60~65 gCO2-eq/kWh, wind power at 21 and PV solar at 106. I've seen other studies setting Nuclear at 24~85 (mining exclude/included) Windpower 8~30 (recycled-new) and PV 20~80 (production techniques, mining) and also biomass IEA report with carbon negative outcome of -9 g CO2-eq/kWh, presumably from sustainable forest with more growth than extraction. As a note: LCA includes demolition costs of the installation after it's lifetime. Now I have seen that for PV, Wind power and biomass powerplants all on lifetime expectancies of 20~30 years including derating. For coal fired plants that period is taken to be 50 years. There is no derating for coal fired as that is maintained to be at top capacity. I wonder if that is realistic. For NPP the minimum I've found is 60 years and very wide margin for the costs: not enough experience. I would say take the costs of a Fukushima till now and you will not make a big mistake: even in case a NPP is shutdown, it will take a 35 years before one can think of taking it down. And all used fuel in place will be active for another 100 years.
-
Doug_C at 07:02 AM on 5 June 2019Effects of Global Warming
william @9
Correlation does not equal causation. Just because humans were present in the Americas when the megafauna went extinct is not evidence that they were the cause of this extinction.
What Killed the Great Beasts of North America?
"The idea that humans wiped out North America’s giant mammals, or megafauna, is known as the “overkill hypothesis.” First proposed by geoscientist Paul Martin more than 40 years ago, it was inspired in part by advances in radiocarbon dating, which seemed to indicate an overlap between the arrival of the first humans in North America and the demise of the great mammals. But over the years, a number of archaeologists have challenged the idea on several grounds. For example, some researchers have argued that out of 36 animals that went extinct, only two—the mammoth and the mastodon—show clear signs of having been hunted, such as cuts on their bones made by stone tools. Others have pointed to correlations between the timing of the extinctions and dramatic fluctuations in temperatures as the last ice age came to a halting close."
If early human arrivals in the Americas killed off some of the megafauna why did they then stop and allow massive numbers of other quite large species to remain like the Bison, Grizzly Bear, Musk Ox and others.
The rapid fluctuations in climate at the end of the last glaciation period and the extinction of species that lost their associated habitats is likely evidence of how dangerous climate change can be to life.
-
william5331 at 05:54 AM on 5 June 2019Effects of Global Warming
If we are going to call the recent icy period an Ice Age, which extended between the Eemian interglacial some 125 thousand years ago and the present Holocene interglacial then what are we going to call the 2.75 million year period in which there have been more or less 40 cycles between ice and not much ice. I don't care what we use as long as we use it consistently. It is not just semantics. Some folks, even a program on National Geographic, suggested that the fauna of North America died out because of the climate change at the beginning of the present Holocene interglacial. Nonsense. These animals had survived multiple cycles in fine fettle. The only difference was the advent of man into the Americas. Terminology, especially in science, is important.
-
Doug_C at 05:01 AM on 5 June 2019Effects of Global Warming
We are suffering from institutional cognitive dissonance here in Canada.
The newly elected Alberta government where oil and gas production is considered sacrosanct has declared an intention to create a $30 million "war room" to attack anyone threatening the fossil fuel sector in Canada.
Environmental groups shrug off Jason Kenney's 'war room' threat
While significant regions of Alberta are currently under emergency measures due to climate change driven wildfires. They are sending firefighters from across Canada to deal with a climate change driven emergency in Alberta that will only get worse as industry and government there do almost anything to protect the oil and gas sector.
B.C. sending more firefighters to help battle Alberta wildfires
This is highly irrational as the Alberta government has been threatening BC economic interests for several years over the resistance to the Trans Mountain pipeline expansion plan.
UCP poised for battle with B.C. over Trans Mountain pipeline expansion
So while BC is treated as the enemy when we don't bow to pressure to not just maintain current levels of fossil fuel use but expand them, when climate change emergencies that have been predicted for decades are in fact now happening we are also expected to respond to the provinces that are driving this sector over all reason.
Federally the Green Party leader of Canada has declared she also supports fossil fuel use for decades as long as we don't import any of it.
Elizabeth May wants to only use Canadian oil — a plan Quebec's Green Party leader can't support
It's not like there isn't awareness at the highest levels of the crucial need to phase out fossil fuels, the Canadian government signed the 1997 Kyoto Protocol to phase out fossil fuels and then again in Paris in 2016.
But when it comes time to actually enact policy to do this, government after government balks and the private sector pretends there is no crisis.
While investment in alternative energy has been very low in Canada for years, investment in fossil fuels is still massive here.
Canada’s major banks have financed $464 billion worth of fossil fuel projects since 2016.
What do we as citizens do when the private sector that obviously wants oil and gas use no matter the catastrophic impacts uses part of the proceeds of their business to effectively control policy.
Life is dying on Earth while conditions for people are becoming very dangerous as well as with some of the deadly wildfires in California, Australia and other places. We are lucky we have not lost people here in BC with how critical our wildfire situation has become. In a month or so we probably won't have the firefighting resources to share with other regions when our fires start catching.
Anyone who is still claiming this make sense in any context is totally delusional, we get off all these highly polluting fossil fuels as fast as possible or we in fact do face the horrific prospect of an unlivable world in what is in geological time the blink of an eye.
-
Doug_C at 02:02 AM on 5 June 2019Effects of Global Warming
nigelj @5
That is what is needed. A comprehensive breakdown comparing the relative resources that go into making and running a 1,000 MW MSFR nuclear power plant as opposed to how many wind turbines, PV solar panels, tidal generators, etc... are needed to provide the same energy production and what overall ecological impact they both have.
As for weapons proliferation which is a serious concern, the thorium fuel cycle in molten salt reactors effectively addresses this concern. Once the reactor is in operation it needs new fissile material added to it as the initial charge of either U-235 or U-233 is used up by fission. The reactor core would have a blanket loop surrounding it of molten salt with the thorium in solution. The neutron flux from the core fission reaction provides just enough neutrons to keep the core fission reaction going and breed new fuel from transmuted thorium in the blanket, it's a little over a 1-to-1 ratio.
If you start taking out the new U-233 from the Th-232 that has just been transmuted then there is no new fuel to keep the molten salt reactor in operation. Th-232 is also seven neutron captures away from weapons grade Pu-239 while U-238 is only one neutron capture away making uranium the preferred fuel cycle for weapons creation.
A MSFR would be producing about 0.159 kgs of Pu-239 a year while a light water reactor would produce about 110 kgs in that same time period.
Why the molten salt fast reactor (MSFR) is the “best” Gen IV reactor
-
John Hartz at 00:09 AM on 5 June 2019Climate's changed before
I accidently deleted the following comment. My bad.
TVC15 at 19:59 PM on 4 June 2019
Is there an easy answser for this question being asked by a climate denier?
And as you know, nature's impact on climate can and has been EXTREME prior to man, and man's industrialization. How do you account for that?
So far from what I've learned from you guys is Earth's orbit, solar output, the sun being cooler, greater volcanic activity, rock weathering, surface ice albedo, massive amounts of Dinosaur gas? (sorry guys I had to toss that in for grins)
Are there other factors I missed?
Thanks!
-
MA Rodger at 23:56 PM on 4 June 2019Climate's changed before
TVC15 @724,
There were of course "EXTREME" climate processes prior to mankind arriving on the scene. These can perhaps be classified into two different groups.
The first can include really big changes but they occur very slowly, although sudden on a geological time-scale. So the end of the last ice age saw a rise of perhaps 6ºC in global temperature over 8,000 years or 55 million years ago the PETM which saw similar temperature rises over 40,000 years (long enough for, for instance, horses to adapt to the temperature increases by slowly evolving from pony-size into the size of large dogs).
The second group are far more sudden, the suddenness often obvious. A big volcanic eruption (Mt Toba 74,000 years ago), a meteor strike, or a sudden influx of fresh water that destabilises ocean currents (as per Dansgaard–Oeschger events). This second group can still have very very big local effects but obvious causes that soon dissipate (althugh D-O events can take 2,000 years to return to the prior climate).
But in all this, I'm not sure what a denialist is trying to argue. If we wait long enough there will eventually be a mega-volcano blow its top, or a big meteor will eventually strike the Earth. (There isn't enough ice about for a D-O event to occur without an ice-age.) So is the denialist suggesting we set about creating our own climatic disaster to allow us to practise for how to respond to the real thing? Or does he want an explanation for every wobbly bit of paleoclimate before he will accept the blindingly obvious fact that it is humanity driving todays warming climate and it will not end well if we don't do something about it?
-
peter7723 at 22:53 PM on 4 June 2019Effects of Global Warming
This is an excellent summary of the symptoms of the illness.
However, for remedial action to be taken, the question to be answered is "What should we do?". Answers include "Reduce CO2 in the atmosphere", "Eliminate emissions of CO2", "Eliminate emissions of methane". But, these are too general to lead to action.
The questions in turn give rise to "How?" For example, "How can CO2 in the atmosphere be reduced?" with answers such as "Carbon sink", Carbon capture and storage", "Filter CO2 and water from the air and convert to oil" (https://www.nature.com/articles/s41467-019-09685-x), "Remove carbon from hydrocarbons before burning" (https://www.newscientist.com/article/mg23230940-200-crack-methane-for-fossil-fuels-without-tears/). Each of these have advantages and disadvantages and give rise to lower level questions.
We must carry such analyses through to actions that people can see make sense. "Climate Emergency" by itself is so abstract and frightening. -
TVC15 at 19:41 PM on 4 June 2019It's the sun
Hi Daniel @ 1262
Would you mind explaining how scientists differentiate between human generated and nature generated CO2?I've found that there are two different isotopes for the human imprint vs. natural CO2.
Are there other methods besides the identifying the different isotopes and what methodologies are used to test these different contributors?
Thank you!
Moderator Response:[PS] that would be offtopic here. Please see this rebuttal for two other methods used to constrain CO2 origins.
-
nigelj at 19:03 PM on 4 June 2019Effects of Global Warming
Doug @4, I know what you are saying: A single reactor building producing 1000 mwatt intuitively seems to use less materials than a big solar or wind farm of equivalent output. However it would be useful to see a hard data comparison, because appearances can sometimes be deceiving. And the sciency types on this website would rightly insist on it. I do think it would be a good argument in favour of nuclear power if you are correct, so its interesting.
Molten salt reactors are still somewhat experimental. I agree they have many advantages, although one sticking point is the ability to produde high grade nuclear weapons materials. Its this sort of thing that is slowing development down. In the meantime we obviously have to build what is feasible like solar and wind power. We are lucky we have geothermal power.
-
Doug_C at 18:15 PM on 4 June 2019Effects of Global Warming
nigelj @3
The scale of it just doesn't seem right for low density renewables. If as the data says nuclear power has several billion times the energy density of energy sources such as solar and wind power and it would take about 15,000 1,000 MW nuclear power plants to totally replace fossil fuels, wouldn't that require several trillion comparable renewable energy sources.
We're talking about a huge amount of energy needed to replace all fossil fuels and finite resources, space and time to do it.
As for nuclear power, my point about the actual biological response to ionizing radiation in most dose rates anyone will be exposed to is that the requirements placed on nuclear power for nearly zero levels of emissions are part of what makes it so costly.
And we couldn't go with "conventional" light water reactors now anyway as a replacement to fossil fuels because the industrial base to build the thousands of massive stainless steel primary containment vessels simply doesn't exist.
What is being proposed by some is the molten salt fast reactor concept that does away with the need for massively strong primary pressure reactor vessels and the need for equally massive secondary containment in the chance there could be a catastrophic loss of radioactive collant.
Why the molten salt fast reactor (MSFR) is the “best” Gen IV reactor
With a molten salt reactor your primary containment is chenical as the fissile material is held in solution in the molten salt. The reactor is not under pressure and there is no chance of a melt down. The core is already molten.
We know the concept works as ORNL ran one for several years in the 1960s and worked out much of the chemistry and materials issues.
Molten-Salt Reactor Experiment
A fast molten salt reactor simplifies the concept as it does away with the need for a core graphite moderator that needs to be changed every four years and simplifies fuel reprocessing.
They can also be built in modular design so you can have 300 MW moduls that can be conbimed to produce larger plants giving flexibility to implementation.
Waste is also greatly decreased with MSFRs as they produce a fraction of transuranics(TRUs) that are such an issue with light water reactors that use solid fuel rods that break down from exposure to heat and neutron bombardment in the core and become less stable due to the buildup of fission products over time.
You get an almost complete burnup with a molten salt reactor so almost all your waste is short lived fission products that can be safely stored onsite as has been done for decades with the current light water reactors.
Molten salt reactors also use a gas parging system that makes it possible to pull fission products out of the core salt unde4r operation that might interfer with the stable running of the reactor and some are highly valuable for things like nuclear medicine like Moly-99 used in imaging, Iodine-131 and bismuth-213 used in cancer treatment.
MSFRs also produce small amounts of Pu-238 used as a power source for deep space mission and ample xenon with is fuel for ion rockets in the space sector. They also produce noble metals like gold, silver and platinum.
There's so many advantages to MSFRs and once the infrastructure is created to begin large scale production the cost would be a fraction of what nuclear power now costs.
I think it's the way to go for many reasons.
Another is running thorium in molten salt reactors also produces little fissile materials that can be used in weapons manufacture. It is nearly a 1-to-1 ration of fissile material undergoing reaction in the core to thorium in the blanket being converted to U-233 by the neutral flux being produced by the reactor. Take out the new U-233 and the reactor stops running for lack of replacement fissile material.
As I said it's a question of scale. And if thousands of reactors in the 1,000 MW range are required to phase out all fossil fuels and nuclear power has billions of times greater energy density than renewables then a comparable renewables energy model will require trillions of comparable facilities dispersed over large areas of the Earth.
It's still possible to implement solar, wind, geothermal, tidal, etc... energy under a nuclear power replacement regime, it just make it so the scale of that part of the model can be greatly reduced.
As for economics, we will be creating an entirely new economic model to reflect the new energy model. At its basis any economic model must include a viable biosphere to take place in. And then build out from there.
And the best way to acheive that is to use the most efficient sources of energy that use the least amount of finite resources and take up the minimum amount of space that otherwise could be part of a viable ecosystem with sufficient biodiversity indefinitely.
Nuclear power in the form described above would seem to fit that bill far better than low density renewables on the face of it.
Be interested to see that take others have on this.
-
climate_watcher at 17:58 PM on 4 June 2019Roy Spencer on Climate Sensitivity - Again
Another Roy Spencer blog post on this topic, posted in our group for climate change news.
http://www.drroyspencer.com/2018/04/new-lewis-curry-study-concludes-climate-sensitivity-is-low/?fbclid=IwAR2EU3mgUfELyXzhXEiznTlXGTeMwVK7rV9ZS7jkt-L3kTPo0u9_XWR1bJw -
TVC15 at 17:55 PM on 4 June 2019Climate's changed before
@ RedBaron 721
Those are two truly encouraging links you posted about China and India dominating greening the earth!
Thanks for sharing this!
-
TVC15 at 17:44 PM on 4 June 2019Climate's changed before
Hi RedBaron @ 721,
Trust me I am a scientist and I know science is based in evidence not faith.
In thinking about your first response to me with respect to the quibbling over which sector should take the heavier load...do you really think either one is going to simply agree to taking the heavier load? I don't. These two sectors have tons of money to buy any lobbyist or politician they want in order to fight against taking any load. And I'm certain there will be resistance from both sides. Thus this leads me back to it's too late to turn back now.
Just look at the current heat wave hitting India with those crazy high temps! Even with this news you still see the deniers in the US and around the globe.
I am not a doom and gloom type gal, just a realist.
-
nigelj at 16:55 PM on 4 June 2019Effects of Global Warming
Doug_C @2, I agree with your first two paragraphs. The main issue with nuclear power is the economics. This is because our civilsation works on what is the most economic option to generate a desired outcome, and right now wind power is lower cost than nuclear power, and solar power is about the same (according to Lazard's analysis), so generators tend to prefer renewable energy, especially given the large scale of nuclear projects and complicated approval procedures.
The space taken up by renewable energy is just not significant, because solar power panels tends to be on building's roofs and can be deployed in waste land and in deserts, and wind tower pylons sit on farming land not taking up significant space.
Of course safety is a big concern as well as economics, and I recall reading something that suggested that radiation below a certain level is harmless and that the relationship is not linear. But nuclear accidents are a nightmare and very costly to clean up.
Resources are an issue to consider, but the world is not about to run out of important minerals not for many centuries yet, and even if we were things won't slow down because capitalism is like a voracious machine. Imho our main hope is smaller global population.
Given nuclear power is not exactly low cost it must use plenty of materials and (fossil fuel) energy in construction and mining those materials, so I'm not convinced its particularly low carbon in terms of manufacturing. Of course I do realise some of the costs are in scarce metals. But do you have some hard data comparisons on carbon content in manufacturing between nuclear power and the other options?
If thorium reactors become economic, and can be shown to have low carbon in the manufacturing process, great, I have no objection. Until then we have to work with what is plausible in the real world.
-
RedBaron at 16:13 PM on 4 June 2019Climate's changed before
Don't digress because one is just a symptom of the other, and fixing one fixes both. And more importantly to your lack of faith, please remember. Science is about evidence not faith.
Soil Carbon Sequestration Potential for “Grain for Green” Project in Loess Plateau, China
Sure that paper just discusses potential. But in fact the project did go forward and has indeed suceeded in already restoring ecosystem function to vast acreage and is even now sequestering approximately 25% of China's emissions. The effect is so profound and widespread it can be seen from space.
Human Activity in China and India Dominates the Greening of Earth, NASA Study Shows
So you see? Where the highest human population density on the planet is also the most improvement in ecosystem restoration, which is actually already making significant strides in restoring ecosystem function over vast areas...
Now is not the time to give up with dispare. Now is the time to tighten your belts and get to work! We have a lot of work to do and pouting around with gloom and doom is not helping one bit.
We can do it. Get er done!
-
scaddenp at 13:37 PM on 4 June 2019New rebuttal to the myth 'Holistic Management can reverse Climate Change'
Thanks for that. Quite a lot to digest when I get a little more time.
-
Doug_C at 13:29 PM on 4 June 2019Effects of Global Warming
Climate change is already becoming catastrophic and everywhere researchers are looking life is being threatened far more than was thought even a few years ago.
Many insect populations are in critical decline, the same goes for avian populations and many others. It's not just climate change that is doing this, but global industrial society overall where there is no long range planning as short term profit making drives almost all economic activity.
I also seriously question that relying on low energy density "green" energy technology is going to prevent a catastrophic collapse of the biosphere in the near future.
They would need to be implemented on a vast scale to replace all fossil fuels and that would require equally vast resource extraction, transportation, manufacturing and construction.
There's only one shot to avoid a systemic collapse now is my take on this.
Nuclear power and one specific type, the molten salt fast reactor running the thorium fuel cycle.
If green renewable energy production can take up to 1,000 times the space - with all the attendant resouces to build it - of fossil fuels;
Renewable energy sources can take up to 1000 times more space than fossil fuels
And in turn nuclear power can have millions of times the energy denisty of fossil fuels.
Then that gives us an energy density of nuclear power several billions times that of green renewables. And where a lump of thorium that can fit in your hand will provide all the energy you need in a lifetime, the mass needed to provide energy from low density renewables - including the space dedicated to it - would be many tons that would crush you.
My question is, do we really have the resources and time to be so idealistic about energy production when the situation is now so critical. And when there are serious question about the actual physical response to ionizing radaition which is the main hazard with nuclear power.
If for instance if ionizing radiation may actually have a beneficial effect on people exposed to slightly higher levels of background radiation as the Nuclear Shipyard Workers study indicated.
Nuclear shipyard worker study (1980–1988): a large cohort exposed to low-dose-rate gamma radiation
And new research seems to indicate that within certain thresholds ionizing radiation isn't just harmless to people but it may in fact be essential to the normal functioning of our cells.
Is Radiation Necessary For Life?
I think it's entirely possible we have been avoiding the solution to many of our problems for decades for fear of something that has never been the risk it has been presented as since the mid 1950s that some researchers consider a scientific fraud for political purposes.
Just my thoughts, we can keep running in fear from something that always has been and always will be an intrinsic part of our being;
Or embrace what is likely our last shot at salvation at a species level. As I said, given the scale needed to implement low density energy production with the misconception it is clean when a vast amount of resources must go into manufacturing it and an equally vast amount of space must be taken up by it, I think going completely "green" is just as dangerous as fossil fuels energy production.
-
nigelj at 13:01 PM on 4 June 2019Effects of Global Warming
This is a nice concise summary of all the important points. It might almost be an idea to put it under "IPCC facts " or something similar so there is a permanent link to it.
Another reason young people are becoming vociferous is perhaps because they see the double standards of adults who say there is a problem yet do nothing. It may also be because young people get some of the science at school, and are also not deluged with denialists rhetoric as much as adults are.
However one quibble. I'm not sure that climate change has become more political and partisan because the results of climate change are becoming more obvious. If it is I think you need to explain how, maybe I'm missing the point. If anything increasingly obvious bad weather may make it less political and partisan as it becomes harder to deny.
Climate change is more likely becoming more political as a result of America's culture wars that have complicated causes and have gained a life of their own getting worse and worse for no logical reason. An analogy might be the way WW1 developed and spiralled out of control, in an unstoppable sort of way.
It's unfortunate that the IPCC reports have not at least mentioned the possibility of multi metre sea level rise by 2100. If they have it's certainly buried away in the fine print.
-
TVC15 at 10:39 AM on 4 June 2019Climate's changed before
Thank you RedBaron @ 719
To be honesty I have no faith in the human species. Overpopulation leading to humans crowding out and forcing other animal and plant species into extinction on top of the GHG emissions and all the other human activities that's destroying life on this earth is why I have bleak outlook on the human species.
I sometimes wish I did not know of all the mass destruction humans are causing. Climate change is just one in many things humans are contributing to.
I digress.
-
RedBaron at 08:41 AM on 4 June 2019Climate's changed before
@TVC15,
Don't be so sure about that. While humans have huge destructive capacity, we also have tremendous creative capacity too.
You are right about just dropping emissions to zero won't be enough. That's been in the IPCC models all along. But the carbon cycle is just that...a cycle. There are two sides to balance. While reducing emissions can't work alone, the other side of the carbon cycle is sequestration. And it only takes about a 10% improvement on the natural carbon cycle sequestration side worldwide to offset emissions.
So while it is controversial still, we actually do have the capacity to improve the long term sequestration side of the carbon cycle at the same time as we reduce emissions. That means we actually can get to a drawdown scenario and it is not yet too late.
I wrote this up to show how:
Can we reverse global warming?
That gets us back to the IPCC scenario that stabilizes the climate! So no. It is not too late.
And there are more details regarding the emissions side of a drawdown scenario here:
And more information on how to properly set up a carbon market to facilitate both emissions and sequestration here:
Emissions is straight forward in a fee and dividend system. You put a fee on fossil fuel sources. That makes people search for low carbom alternatives, which are abundantly available already. The fee just makes them relatively cheaper. But then we take the dividend and use it to pay for measured verified carbon sink increases (rising SOC), and the two together can get us to a net negative.
There are still a few people quibbling over nonsense like which sector should take the heavier load. Should energy take 50% and agriculture the other 50% on the path to a drawdown scenario? Or should it be 80%/20%? Or maybe even 20%/80%? It really doesn't matter as long as in the end we get to a net negative atmospheric carbon flux.
-
scaddenp at 08:37 AM on 4 June 2019Humans and volcanoes caused nearly all of global heating in past 140 years
Just one other further point. The milankovitch forcing for ice ages is very slow. At 65N (where the changes in solar insolation make the difference between summer melt or not), the change is of order of 0.01W/century. By contrast, injecting GHG into the atmosphere at the current rate is producing a forcing of order 4W/century over the entire globe.
I am always suspicious of statement like "The climate system is a very compelex system that nobody fully understands. " You will be hard pressed to find a scientist that would claim to "fully understand" any physical system. We do however understand a great deal about physical systems including climate. For instance, we can say with enormous confidence that if you change the incoming energy reaching the surface than the climate will change in response and furthermore, the amount of change will be positively (not necessarily linearly) related to the amount of change in that incoming energy. Scientists are a skeptical bunch butthey are extremely wedded to concept of conservation of energy.
-
TVC15 at 06:02 AM on 4 June 2019Climate's changed before
MA Rodgers @ 717
Thank you once again for educating me so I can educate others!
With respect to the state of this planet and human activity I now see that's it too late to undo what human activity is doing to our climate.
I apologize if I come across as a "Debbie downer" but from all that I've learned thus far...it appears that this earth cannot overcome human caused destruction until we destroy ourselves.
I am not saying we should simply stop trying but when I look around the globe it's pretty evident that what we've unleashed on this earth is not stoppable even if fossil fuel use ceased 100% today.
-
MA Rodger at 18:54 PM on 3 June 2019Climate's changed before
TVC15 @715,
The claim that "in every Inter-Glacial Period going back 800,000 years the sea level rose 3 meters to as much as 14 meters" is garbled nonsense, as is the comment about MIS-7 & MIS-9. The 'rise' presumably refers to SLR exceeding today's levels and the "3 meters" is probably referring to MIS-5 (although it is usually given as a little higher) which was the last interglacial 100,000 years ago while the "14 meters" is probably referring to MIS-11 400,000 years ago. (MIS-7 & MIS-9 were the interglacials inbetween these two.)
Reconstructing a SLR record over recent ice-ages is not as simple as the equivalent CO2 & polar temperature record. So it is not impossible that wildy contrardictory evidence exists and I'm not aware that a definitive source for ice-age SLR actually exists yet. Our good friend Google provides the graphic below although it requires signing-up to get a proper sight of the data it is based upon.
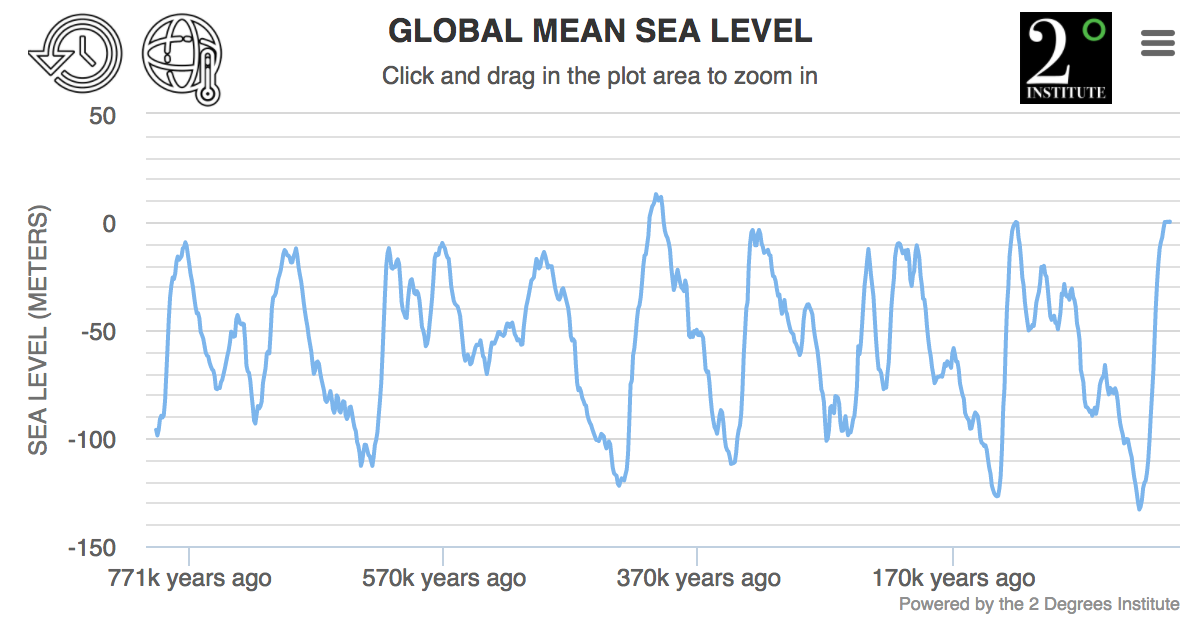
As for CO2 being below 300ppm during those previous interglacials, it was the planet's orbital configuration that allowed that extra ice-melt back then, the whole amplified by reduced albedo due to lower ice cover. Today those orbital configurations do not exist so without mankind's GHGs the planet would now be slipping into an ice-age and sea level would have been dropping. Our extra GHGs is more than preventing that and CO2 levels of 470ppm (not sure why that particular value is stated) will melt out Greenland (as happened in MIS-5) and a fair bit of Antarctica as well. So 14m SLR would be on the cards, although the melting is expected to take some millennia if you managed to stop at 470ppm.
-
Ari Jokimäki at 15:08 PM on 3 June 2019New research, May 13-19, 2019
Thank you all! :-)
-
TVC15 at 06:25 AM on 3 June 2019Climate's changed before
I meant to state that I think he's cherry picking and misrepresenting.
-
TVC15 at 06:24 AM on 3 June 2019Climate's changed before
I've come across another climate change denier who stated these things.
If you read the peer-reviewed scientific articles, you will see that in every Inter-Glacial Period going back 800,000 years the sea level rose 3 meters to as much as 14 meters.
Sea levels during MIS-7 and MIS-9 were 10 meters to 14 meters higher than present.
What did you just say?
You said CO2 levels haven't exceed 300 ppm CO2 in 1 Million years.
So, what exactly is the point?
Who was burning fossil fuels in any of the previous Inter-Glacial Periods?
No one, yet sea levels still rose 3 meters to 14 meters.
In fact, CO2 levels ranged from 260 ppm to 280 ppm CO2.
So, the reality is that it doesn't matter if your CO2 level is 270 ppm or 470 ppm, because your sea level is going to increase 3 meters to 14 meters and neither you, nor anyone living, dead or who will ever live can stop it.
Once you accept that scientific reality, the best thing to do is let the Free Market handle it, instead of ramming useless laws down people's throats that will do nothing except screw people over.
I this he's cherry picking and misrepresenting.My questions are:
- Is it an accurate claim that in every Inter-Glacial Period going back 800,000 years the sea level rose 3 meters to as much as 14 meters?
- Is it accurate to state that it doesn't matter if your CO2 level is 270 ppm or 470 ppm, because your sea level is going to increase 3 meters to 14 meters and neither you, nor anyone living, dead or who will ever live can stop it?
Prev 235 236 237 238 239 240 241 242 243 244 245 246 247 248 249 250 Next


