


 Arguments


Recent Comments
Prev 2447 2448 2449 2450 2451 2452 2453 2454 2455 2456 2457 2458 2459 2460 2461 2462 Next
Comments 122701 to 122750:
-
Tom Dayton at 03:35 AM on 1 April 2010CO2 has a short residence time
Excellent post, Doug! If you can find the time, will you please comment on whether the iconic list and graphic that is touted so widely on the web, contains only studies about individual molecules' lifetimes? Many skeptics throw that on the table to counter explanations such as the one you've given. -
Pete Dunkelberg at 03:25 AM on 1 April 2010A database of peer-reviewed papers on climate change
Google ""E&E is not a science journal" -
Doug Bostrom at 03:25 AM on 1 April 2010Greenland's ice mass loss has spread to the northwest
Geo Guy, perhaps I'm misunderstanding you, or maybe you need to add just a jot of qualification to your writing. When you say "...my point is the ice loss identified by GRACE is not due to melting. There are other factors at work there - similarly to what is going on in the arctic. " I take it you do not discount the loss of ice mass, but you are pointing out that no single process is accountable for all of the loss of mass, the movement of water in space and state? I'm sure you're right about that. Of course, nobody here or elsewhere (well, the sane, anyway) has said that every last gram of ice seen to vanish in the past few decades is down to a single factor, so you won't find anybody worthwhile to argue that point with you. What we can say (and I imagine you could model this if you cared to take the time) is that sublimation alone cannot account for the entire loss of mass on the Greenland ice sheet. As to your speculation about the available amount of extra energy required to produce a phase change of a given mass of water from solid to liquid (melt ice), as an exercise take a look at the summer Arctic sea ice anomaly for any of the past few years and then compute for yourself the additional energy being absorbed by the ocean due to the loss of albedo. In case you don't want to do that work, I'll cut to the denouement, plot spoil and say that where energy arrives counts for a lot; using global temperature change to predict the behavior of ice in a given region is a futile approach. -
Jeff Freymueller at 02:55 AM on 1 April 2010Greenland's ice mass loss has spread to the northwest
#40 Geo Guy, the mechanism for much of or most of the ice loss is glaciers flowing and dumping ice into the ocean. John said this in the original post. The ice does not have to melt in place. If the lower part of a glacier accelerates due to, for example, its interactions with warmer water at its terminus, or increased lubrication due to melting on its lower part, accelerated ice flow will propagate up glacier and into the ice fields/ice sheet that feed the glacier. The ice thickness changes as a result of this flow, and these changes have been observed directly in addition to the indirect observation of Khan et al. (the earth is responding like a scale to the ice, and the GPS is measuring the upward displacement of the scale as the weight on it is removed). This is not my idea -- it is based on direct observations (visual, time-lapse photos), glacier velocity observations, basic glacier physics, and even seismic recordings. And nobody here is saying that the ice loss is all due to melting in place, except perhaps those who suggest they don't believe any of this because the ice can't be melting in place. -
Jesús Rosino at 02:20 AM on 1 April 2010A database of peer-reviewed papers on climate change
These are the ones I've seen: 'It hasn't warmed since 1998' Limits on CO2 Climate Forcing from Recent Temperature Data of Earth 'Oceans are cooling' Cooling of the global ocean since 2003 'Hockey stick is broken' A 2000-year global temperature reconstruction based on non-treering proxies 'Climate's changed before' A 2000-year global temperature reconstruction based on non-treering proxies -
Geo Guy at 02:04 AM on 1 April 2010Greenland's ice mass loss has spread to the northwest
# 37 - Jeff Its not the observations that are wrong, its the interpretation to those observations that are off base. With regards to sublimation, if that is not the driving force for ice loss in sub zero weather, perhaps you can tell us what is. Please don't say a 1 degree increase in atmospheric temperatures brought on by man made CO2 - that just does not make any sense. Even if the temperatures went from minus 20 to minus 10, that still will not result in melting of polar glaciers etc. With regards to GFW - your view assumes a constant level of water vapor in the atmosphere but in face the water content has increased on average at a rate of 1% per year since 1980 - hence the water resulting from the sublimation of ice fields does not all end up in the ocean. Everyone seems to assume when glaciers reduce in size it is because they are melting. What I am trying to point out is that in the polar regions and higher elevations, a small increase in average global temperatures will not and cannot melt those glaciers by itself. Something else is at work and we need to look at the other driving forces that affect glaciers to determine just that. Also the disappearance of glaciers at their margins is a normal observation - they disappear in the areas of ablation. Also glaciers move as a result of the build-up of ice in their centers which pushes the underlying ice outwards. When glaciers are retreating, you don't see that movement. Simply posting maps here showing larger areas of ice loss over a given period of time is meaningless. It certainly is no way near being "Quad Erata Demonstratum". As for Doug, # 34, my point is the ice loss identified by GRACE is not due to melting. There are other factors at work there - similarly to what is going on in the arctic. Those observations reported do NOT support the theory that man-made CO2 is causing warmer temperatures that are resulting in the disappearance of the Greenland ice. Also the glaciers in South America and in Africa that have disappeared are not closed systems and their disappearance has been attributed to sublimation and not warmer temperatures. As I mentioned in a previous post, the thermodynamics required to melt that ice simply from a rise in temperature just are not there. For instance, the energy needed to melt a volume of ice is the same temperature needed to raise the temperature of the resulting water to a 140 F level. With a global temp average increase of under 1 degree over 100 years, you do not need a science degree to figure out that polar ice is not disappearing from that marginal increase in temperature. One last word on the subject, the IPCC identified in one of its reports that glacial melting has been noticeable since 1970. In fact, geological literature identified glacier melting in the 1930's - well before the recorded increase in CO2 levels as measured in Mauna Loa. In addition, the rising temperatures in the arctic oceans were identified in the 1930's so what were are seeing today started well before 1970. Just as I find it difficult to accept that climate is being affected by only one factor - the rise in atmospheric CO2, (simply because there are multiple factors at play when it comes to climate), I also find it difficult to accept that the polar ice cap and glaciers are reducing simply due to one factor when there are so many others at play. Sometimes in science we have to step back and ask ourselves "Does it make sense?" In this case it doesn't make sense to me. -
mspelto at 23:25 PM on 31 March 2010Greenland's ice mass loss has spread to the northwest
2009 melt anomaly in Greenland was not that large. For the Bulletin American Meteorological Society 2009 State of the Climate (in press), I write the Glacier and Ice Sheets section. Here is the line on the melt anomaly..."On the Greenland ice sheet SSM/I brightness temperature daily variations (Tedesco, 2008) identifies melt extent and number of melting days compared to the 1979-2008 average. Negative anomalies occurred in 2009 along Southern and West Greenland, positive anomalies along Northern and East Greenland. The melt extent was 670, 000 km2, slightly lower than in 2008. Surveys of Greenland marine terminating outlet glaciers from MODIS imagery (J.Box, Ohio State U. Byrd Polar Research Center) indicate that the 34 widest glaciers collectively lost 106.4 km2 of ice between late summer 2008 and late summer 2009. " So melt anomalies were above normal in the northern section of the ice sheet, but not a record. -
Jesús Rosino at 23:24 PM on 31 March 2010A database of peer-reviewed papers on climate change
John, inline comment in #6: "[E&E] no, it's not a peer-reviewed journal" Then, shouldn't they be removed from the peer reviewed papers list? I also agree that E&E shouldn't be considered peer-reviewed, because it is not a scientific journal, but a social science journal. It is not carried in the ISI listing of peer-reviewed journals. Its peer reviewed process has been widely critizised for allowing the publication of substandard papers. The editor has said “I’m following my political agenda — a bit, anyway. But isn’t that the right of the editor?”. See also this article published in Environmental Science and Tecnology (a journal of the American Chemical Society), and has recently made it clear that she is interested in the conclusions of the papers rahter than the methodology.Response: Fair call, it's probable that E&E papers are currently categorised as peer-review in my database. Feel free if you find any such papers to let me know which skeptic argument they're listed under and I'll recategorise them. -
Ned at 23:17 PM on 31 March 2010The 5 characteristics of scientific denialism
And yet another entry in the do-it-yourself surface temperature programs! New ones seem to be popping up about one per week. Once again, the results closely match those from GISS, CRU, NCDC, and the other "amateur" analyses linked above. Here's a comparison of eight different versions: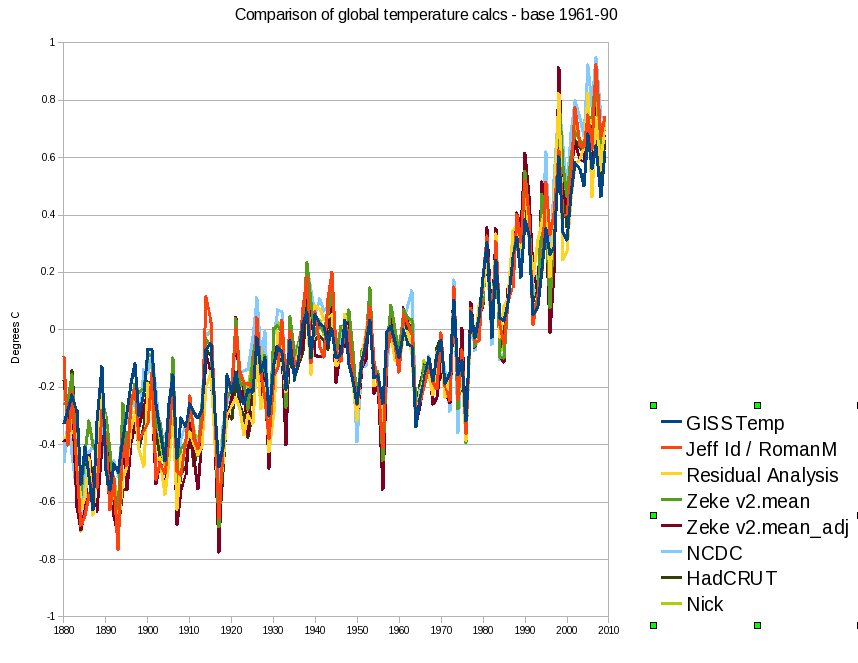 Not shown in that graph are results from Tamino (who's temporarily offline while moving) and Clear Climate Code (whose results are identical to GISSTEMP).
What does this comparison show?
(1) The increasing global mean surface temperature trend is not caused by "manipulation" of the data by NASA or UEA-CRU.
(2) The increasing global mean surface temperature trend is not an artifact of particular algorithms or methods (multiple studies using the same input data but different methods get the same results).
(3) Several of these people have now done comparisons of stations that were dropped in the 1990s vs those that were not dropped, and have found no significant difference in the trends. (I.e., Watts and D'Aleo are clearly wrong.)
(4) "Amateurs" (no insult intended; these people are highly skilled ... but climate science is an avocation rather than vocation for them) can make a very substantial contribution to the field. IMHO this is pretty neat.
Not shown in that graph are results from Tamino (who's temporarily offline while moving) and Clear Climate Code (whose results are identical to GISSTEMP).
What does this comparison show?
(1) The increasing global mean surface temperature trend is not caused by "manipulation" of the data by NASA or UEA-CRU.
(2) The increasing global mean surface temperature trend is not an artifact of particular algorithms or methods (multiple studies using the same input data but different methods get the same results).
(3) Several of these people have now done comparisons of stations that were dropped in the 1990s vs those that were not dropped, and have found no significant difference in the trends. (I.e., Watts and D'Aleo are clearly wrong.)
(4) "Amateurs" (no insult intended; these people are highly skilled ... but climate science is an avocation rather than vocation for them) can make a very substantial contribution to the field. IMHO this is pretty neat.
-
Dennis at 23:16 PM on 31 March 2010A database of peer-reviewed papers on climate change
Re: Energy & Environment -- Given the competing claims that Energy & Environment is/is not peer reviewed, this is a good time for any climate scientists (or, for that matter, any other scientists) who have peer reviewed papers published in Energy & Environment to step forward and identify yourselves. You don't have to identify the paper, only that you have peer reviewed for E&E. -
Berényi Péter at 22:35 PM on 31 March 2010Greenland's ice mass loss has spread to the northwest
For a historical perspective: Was there a 1930s Meltdown of Greenland Glaciers? by Adam Herrington True, it is an undergraduate rersearch paper at the Ohio State University, still, it says something. It also provides plenty of literature on the subject. -
Ari Jokimäki at 21:51 PM on 31 March 2010A database of peer-reviewed papers on climate change
Energy & Environment is not generally considered as peer reviewed even though they claim to be one. They seem to be only publishing papers that go against the mainstream climate science, and the papers also seem to be of questionable quality. -
Mikko at 21:25 PM on 31 March 2010A database of peer-reviewed papers on climate change
http://en.wikipedia.org/wiki/Energy_&_Environment Many of the "sceptical papers" have been published in the Energy & Environment. Is it Peer-Reviewed, Academic Journal as EBSCO lists it? Or is it a trade journal as Scopus lists it? Which is more reliable EBSCO or Scopus list?Response: My understanding is all articles published in Energy and Environment were reviewed by the editor Sonja Boehmer-Christiansen. In other words, no, it's not a peer-reviewed journal. -
Ari Jokimäki at 20:44 PM on 31 March 2010A database of peer-reviewed papers on climate change
Thanks for the traffic, John! :) -
Jesús Rosino at 19:16 PM on 31 March 2010A database of peer-reviewed papers on climate change
Ari's AGW Observer has a useful index page listing all the paperlists: http://agwobserver.wordpress.com/index/ -
Mikko at 19:14 PM on 31 March 2010A database of peer-reviewed papers on climate change
http://www.populartechnology.net/2009/10/peer-reviewed-papers-supporting.html Hi experts. Pleas comment this link. I have feeling that it is another hoax of the denialits. -
RSVP at 18:32 PM on 31 March 2010The human fingerprint in global warming
In tracking global atmospheric composition, the implications of change goes beyond effects on Earth's temperature. In fact, climate may be the least significant issue. For instance, life (as we know it) cannot be sustained without oxygen. Mathematical projections on global ice melting, temperatures, sea level rise, etc., are commonplace on this site, yet general questions on bio-sustainability are typically avoided. And while these issue may hold a higher priority for limiting fossil fuel burning, the focus here attemps to limit itself to safeguarding the climate theory behind AGW (i.e., the relationship between CO2 levels and global warming). And with all the data and resources currently dedicated to this issue, it would seem proper to apply it to a higher purpose. Not only would there be more interest and motivation, there is a higher chance of actually acheiving goals relative to the reduction of GHG emissions. -
Jeff Freymueller at 16:32 PM on 31 March 2010Greenland's ice mass loss has spread to the northwest
#33 Geo Guy, yes, but 300 gigatons per year by sublimation due to changes in winds? Please. Not credible. You are going to have to do better than a blanket claim that all of the observations being made about Greenland have no scientific basis. On what basis do you make that sweeping claim? -
GFW at 16:26 PM on 31 March 2010Greenland's ice mass loss has spread to the northwest
And even beyond that, let's consider an imaginary ice sheet somewhere undergoing significant annual mass loss via sublimation. Um, where does the ice go? Into the air as water vapor. And then? It rains out ... and winds up in the ocean. Simple fact - any loss from any ice sheet winds up in the ocean. Yes, humans have created some extra lakes with dams, and a warming atmosphere will almost certainly retain more water vapor, but the former is a relatively small (though measured!) effect while the latter is obviously something that an AGW denier isn't going to want to talk about. -
Doug Bostrom at 16:07 PM on 31 March 2010Greenland's ice mass loss has spread to the northwest
By the way, here is the paper Geo Guy cites, and here is a full text article fully disclosing the context of the situation Geo Guy believes overturns ice mass loss in a completely different situation. -
Doug Bostrom at 16:00 PM on 31 March 2010Greenland's ice mass loss has spread to the northwest
Geo Guy, just to be clear are you in doubt about the GRACE results indicating loss of ice mass on Greenland, observed acceleration of ice loss at the margins of Greenland? Also, you probably did not notice that the paper you cite refers to closed drainages and has no particular relevance to Greenland or other locations where glaciers or ice sheets are connected to outflows. Sublimation or melting is the only available means of attaining mass balance for glaciers in closed drainages. The Greenland ice sheet and associated glaciers are of course not confined to closed drainages. -
Geo Guy at 14:43 PM on 31 March 2010Greenland's ice mass loss has spread to the northwest
In response to Ned 23 and Jeff 26 (and others who find it difficult to believe that sublimation does not play a role in the disappearance of glaciers), when air temperatures fail to move above melting (even in the summer) plus when you factor in the thermodynamics of the amount of heat needed to melt ice, and given the polar regions are sub zero for half the year, the melting of glaciers at the rates indicated in the loss of mass just are not possible from an increase in atmospheric temperatures. For anyone who has worked in the far north in the winter, the sublimation of snow cover is quite observable as is the reduction in ice on the lakes. Geologists Andrew Fountain, Karen Lweis and Peter Doran authored an article in Global Planetary hange (Vol 22 Issues 1-4) from which I took the following quote: "In polar regions, where melting is typically absent, sublimation is the only significant process by which glaciers lose mass and its rate largely depends on wind speed rather than temperature." The reduction in glaciers located in high elevations in Chile and Mount Kilimanjaro etc are attributed to sublimation and not melting. Observations being made about Greenland and interpretations as to the cause of the change in Mass blaance that are posted here simply have no scientific basis attached to them. -
muoncounter at 13:41 PM on 31 March 2010Greenland's ice mass loss has spread to the northwest
GeoGuy #20: "temperature plots from 1930 onwards from stations located on Greenland show consistent temperatures and no rising temperatures - especially the the heights needed to melt glacial ice." Perhaps we should listen to the local population: "A Greenlandic supermarket is stocking locally grown cauliflower, broccoli and cabbage this year for the first time. Eight sheep farmers are growing potatoes commercially. Five more are experimenting with vegetables. And Kenneth Hoeg, the region’s chief agriculture adviser, says he does not see why southern Greenland cannot eventually be full of vegetable farms and viable forests."" ... Cod, which prefer warmer waters, have started appearing off the coast again. Ewes are having fatter lambs, and more of them every season. The growing season, such as it is, now lasts roughly from mid-May through mid-September, about three weeks longer than a decade ago." -- http://www.nytimes.com/2007/10/28/world/europe/28greenland.html Again, evidence of warming that isn't dependent on temperature data. Wonder if there's any beachfront property available in Narsarsuaq.
-
yocta at 13:34 PM on 31 March 2010A database of peer-reviewed papers on climate change
John, you should convert this hobby into a PhD given the amount of literature reviewing you do!Response: If any universities are interested, I'm happy to discuss thesis ideas :-) -
Berényi Péter at 13:30 PM on 31 March 2010Is the science settled?
#92 Ned at 14:40 PM on 27 March, 2010 "To illustrate the point about positive feedbacks, here are graphs of two cases, one where f > 1 (resulting in a runaway increase) and one, like the real-world positive water vapor feedback, where 0 < f < 1, so that the temperature increase is bounded (2C in this case)" I see. Your model should go something like this: 1 Average SST (Sea Surface Temperature) s is a monotonic function H of average IR optical depth y of atmosphere: s = H(y) where H(y1) > H(y2) for all y1 > y2. 2 For a given optical depth y0 there is an equilibrium temperature s0 so that s0 = H(y0). 3 This equilibrium is stable against small transient perturbations. 3.1 If H is considered to be a functional acting on optical depth histories y0 + y(t) such that y(t) is bounded (y0 >> |y(t)|) and zero outside t1 > t > 0 for some t1, then H(y0 + y(t)) tends to s0 in the long run. 4 H is smooth around y0, that is if the integral of y(t) squared is sufficiently small, there is some linear transform H such that H(y0 + y(t)) = H(y0) + Hy 5 H is time shift invariant. That is if h(t) = H(y(t)), then h(t+t1) = H(y(t+t1)) for all t1. In this case the linear transform H defined above is a filter and is fully specified by its impulse response function or the Fourier transform of it, the transfer function. 6 Let H be a first order lowpass filter. It's easier to visualize its response to a step function y(t) which is y1 for t > 0 and zero otherwise. If this forced increase in optical depth (relative to the equilibrium value of y0) induces a long term increase of s1 in SST, the response function defined by H is h(t) = s1/y1(1-e-t/t0) where t0 is relaxation time. Now. Average water contents of the atmosphere is somewhere around 4000 ppmv, highly variable. It is more than ten times the current CO2 level. Also, H2O has much more absorption lines in thermal infrared, so even tiny changes in humidity imply changes in overall IR optical depth. Also, as the story goes, vapor pressure of H2O over open water surfaces increases with temperature, so overall optical depth is also expected to increase. As average annual precipitation on Earth is close to 1000 mm and atmospheric moisture is low (only 0.24% by weight), turnover time has to be short (approx. 9 days). Therefore atmospheric IR optical depth change should be an almost instantaneous response to a change in SST. We have already postulated a rise of s1 in SST in response to an increase in optical depth of y1. Now it is done the other way around. If SST is increased by s1, it causes an immediate increase of optical depth by f*y1 (with some coefficient f). This is the water vapor feedback. From now on attention is restricted to the supposed linear regime around the equilibrium state defined above, so only anomalies are dealt with. Let x be the IR optical depth anomaly due to GHGs other than H2O. We have two equations: s = Hy (1) y = f*y1/s1*s + x (2) From these we have s = (H-1-f*y1/s1)-1x = Gx (3) Let's switch to the frequency domain. The Fourier transform of H is H and w is angular frequency. In this case Hw = s1/y1/(1+j*t0*w) (4) If it is put back to (3) Gw = 1/(1-f)*s1/y1/(1+j*t1*w) (5) where t1 = t0/(1-f) is obtained. From this (by inverse Fourier transform) the response to a step function of magnitude x1 in GHG induced increase of IR optical depth is g(t) = 1/(1-f)*s1/x1*(1-e-t/t1) (6) Indeed, an amplification factor of 1/(1-f) is seen which is larger than one if 1 > f > 0. There is no runaway warming in this case. However, we also have this relaxation time thingy. Could anyone give an order-of-magnitude guess about how large it is supposed to be? Also, the assumptions going into the WV amplification theory are made explicit, so they can be scrutinized. -
shdwsnlite at 13:09 PM on 31 March 2010A database of peer-reviewed papers on climate change
Sure one more thing to do in your all your spare time. Thank you for all the work you do on this site. -
shdwsnlite at 13:05 PM on 31 March 2010Climategate CRU emails suggest conspiracy
nice to see what the supporters have been saying confirmed, but many will say the judgment was rigged. Inquiry backs scientists in global warming row -
Jonathan E Markham at 12:36 PM on 31 March 2010A database of peer-reviewed papers on climate change
But mere cataloging isn't particularly helpful. One can just go to ISI and search for 'climate change' if you want a catalog of peer reviewed papers. Much more useful is a catalog of important peer reviewed papers, for which there are many possible judging criteria, times citied (self-citation excluded) is a good one, reflecting how well the paper was received and its influence.Response: It's helpful in grouping them to particular skeptic arguments. So if someone says to you "Greenland isn't losing ice" and you want to look up peer-reviewed research on this exact question, you can go to our links to papers on Greenland ice mass loss. Re additional info on citations to establish the credibility of a paper, I may just add that info to the database at a later stage - why not?! -
Yngtor at 12:31 PM on 31 March 2010A database of peer-reviewed papers on climate change
Excellent! This is just the stuff we need out here to argue coherently. Thanks. -
From Peru at 11:04 AM on 31 March 2010Greenland's ice mass loss has spread to the northwest
When will arrive the MELTING ANOMALY MAP FOR 2009? GRACE show it will probably be a record-breaking one! -
Philippe Chantreau at 09:21 AM on 31 March 2010Is the science settled?
My hypothesis is not the only one to be speculative and there is some work to back it up. Trenberth' model showing decreasing cloud cover leading to more insolation and the majority of warming happening from insolation is an example. That was linked multiple times in earlier threads. -
Lou Grinzo at 09:16 AM on 31 March 2010Greenland's ice mass loss has spread to the northwest
Thanks for the pointer to that article, Albatross. The exact quote from New Scientist: ---------------------------- The model suggests that within 100 years, PIG's grounding line could have retreated over 200 kilometres. "Before the retreating grounding line comes to a rest at some unknown point on the inner slope, PIG will have lost 50 per cent of its ice, contributing 24 centimetres to global sea levels," says Richard Hindmarsh of the British Antarctic Survey, who did not participate in the study. ---------------------------- Source: http://www.newscientist.com/article/dn18383-major-antarctic-glacier-is-past-its-tipping-point.html I wish people would push Lovelock (and everyone else) harder to back up such pronouncements. -
Albatross at 08:18 AM on 31 March 2010Greenland's ice mass loss has spread to the northwest
Thanks John, sorry to make work for you. You must feel like you are a school teacher at times, making sure everyone is behaving and also having to help out :) NewScientist (13 January 2010) has an article on the potential impact on global SL if the PIG were to slide into the ocean-- they reckon that would increase global SL by about 24 cm. And yes, scientists think PIG exceeded its tipping point in 1996..... -
shawnhet at 08:17 AM on 31 March 2010Is the science settled?
Phillippe, I fail to see where I have engaged in wild speculation. I have merely raised the simple hypothesis that more WV in the air will lead to both more clouds and more precipitation. Warmer air will hold more WV cooler air everything else being equal and, thus, cooling it by the same amount will cause more precipitation for a warm climate than a cool one. How Much More Rain Will Global Warming Bring? Frank J. Wentz,* Lucrezia Ricciardulli, Kyle Hilburn, Carl Mears Climate models and satellite observations both indicate that the total amount of water in the atmosphere will increase at a rate of 7% per kelvin of surface warming. However, the climate models predict that global precipitation will increase at a much slower rate of 1 to 3% per kelvin. A recent analysis of satellite observations does not support this prediction of a muted response of precipitation to global warming. Rather, the observations suggest that precipitation and total atmospheric water have increased at about the same rate over the past two decades. While the energy from condensation doesn't disappear, it does disappear from the surface resulting in cooling of the surface. In the Kiehl and Trenberth model, the surface temperature is the solar heating of the surface + backradiation minus evapotranspiration(and the energy absorbed by the Earth). Your idea that cloud lifetimes will be lessened is of course possible, but does seem a little speculative to me. Cheers, :) -
NewYorkJ at 07:23 AM on 31 March 2010The human fingerprint in global warming
To add to the upper vs lower stratosphere distinction, here's a source on this, although much of the data is somewhat out-of-date. http://www.atmosphere.mpg.de/enid/20c.html -
tobyjoyce at 06:06 AM on 31 March 2010Greenland's ice mass loss has spread to the northwest
Geo Guy, John L. Daly died in 2004 & the charts you reference have not been updated since 2003, most of them end in 1999 or 2000. Daly's site has been maintained by a colleague, but even that is quite outdated: http://www.john-daly.com/ -
Philippe Chantreau at 05:57 AM on 31 March 2010A peer-reviewed response to McLean's El Nino paper
Ok, apology for that, I missed it. -
Philippe Chantreau at 05:51 AM on 31 March 2010Greenland's ice mass loss has spread to the northwest
Looking at Albatross' last link, I found this to be quite interesting: "Based on the differences he saw between his map and his new observations, he concluded that the surrounding ice had retreated at least 10 kilometers (6 miles) in the previous five years." An average of 2 km/year. Some should instruct these glaciers to stop being so alarmist, it's starting to look bad. -
Jeff Freymueller at 04:56 AM on 31 March 2010Greenland's ice mass loss has spread to the northwest
#20 GeoGuy, like Ned #24 I have to assume your suggestion of sublimation was not serious. Please re-read John's post. The mass loss is not all caused by melt and runoff -- much of it comes from glaciers dumping large amounts of ice into the ocean, where it then melts. We know this from direct observation, time-lapse photography, repeat satellite imaging, estimation of glacier velocities from radar interferometry and direct measurement, etc. The isostatic uplift doesn't have to be inferred from relative sea level, it has been measured directly. See Sella et al. (2007) in GRL, or free ftp access (according to Google) at the author's ftp site. As far as accounting for the effect of isostasy in sea level rise, you need to acquaint yourself with the work of Jerry Mitrovica and colleagues, who have done that (and more). -
Albatross at 04:29 AM on 31 March 2010Greenland's ice mass loss has spread to the northwest
This article might answer people's questions as to the mechanisms responsible for the acceleration of ice loss (i.e., acceleration of outlet glaciers) from Greenland: http://www.sciencedaily.com/releases/2009/12/091215173144.htm -
Albatross at 04:19 AM on 31 March 2010Greenland's ice mass loss has spread to the northwest
Ok, I give up, here is the link for the melt season anomaly in 2005: http://earthobservatory.nasa.gov/IOTD/view.php?id=8010 Melt season anomaly in 2006 http://earthobservatory.nasa.gov/IOTD/view.php?id=7563 And the melt anomaly in 2007: http://earthobservatory.nasa.gov/IOTD/view.php?id=8264 And in 2008: http://earthobservatory.nasa.gov/IOTD/view.php?id=37215 This is also quite striking, melting ice reveals new island off coast of Greenland: http://earthobservatory.nasa.gov/IOTD/view.php?id=7738 -
Ned at 04:19 AM on 31 March 2010Climategate CRU emails suggest conspiracy
It's particularly silly to complain about "loss of data from UEA" since there are now a whole bunch of replications of the same results using 100% publicly available data from GHCN. If you don't like the UEA temperature reconstruction, use the one from GISS or NCDC or any of the various open-source efforts that people have developed in the past few months. They all show the same thing. Link 1 Link 2 -
Ned at 04:12 AM on 31 March 2010Greenland's ice mass loss has spread to the northwest
Geo Guy, you've got that backwards. There are multiple independent lines of evidence showing that Greenland is losing mass both by melting and by discharge from accelerating marine-terminating outlet glaciers. These independent lines of evidence include: (1) gravity data from GRACE, which yields the total mass balance of the ice sheet; (2) laser and radar altimetry measurements of ice sheet elevations; (3) interferometric radar measurements of increases in the velocity of outlet glaciers; and (4) high-precision geodetic GPS measurements of bedrock and ice elevations. I'm going to ignore the suggestion that Greenland is losing 300 GT/year of mass (and accelerating) due to "sublimation," since I assume that wasn't serious. Re: temperature, John Daly is not a reliable source, his graphs don't show data for most of the past decade, and Jan Mayen is not in Greenland. -
Doug Bostrom at 04:11 AM on 31 March 2010Climategate CRU emails suggest conspiracy
kblood, you're claiming that failure of a small research unit to efficiently maintain backups of copies of data obtained from a primary source still able to supply the data in question invalidates all of the research findings presented here at Skeptical Science? Can you demonstrate how the loss of copies of a a few years' temperature data invalidates the work of thousands of persons working in a plethora of fields pursuing numerous lines of inquiry? No, obviously you can't. You make a ridiculous charge, harmful to your own credibility. Take a few moments to read what others write here, rejectionists and skeptics included. Get calibrated, please. -
Albatross at 04:09 AM on 31 March 2010Greenland's ice mass loss has spread to the northwest
This is of interest: http://earthobservatory.nasa.gov/Newsroom/view.php?id=43080 The ice below the melt line does melt in the boreal summer: http://earthobservatory.nasa.gov/NaturalHazards/view.php?id=20178 http://earthobservatory.nasa.gov/IOTD/view.php?id=7569 The area experience summer melt is also increasing: Response: Fixed your broken image and yes, a preview feature is coming.
 -
angliss at 04:05 AM on 31 March 2010Greenland's ice mass loss has spread to the northwest
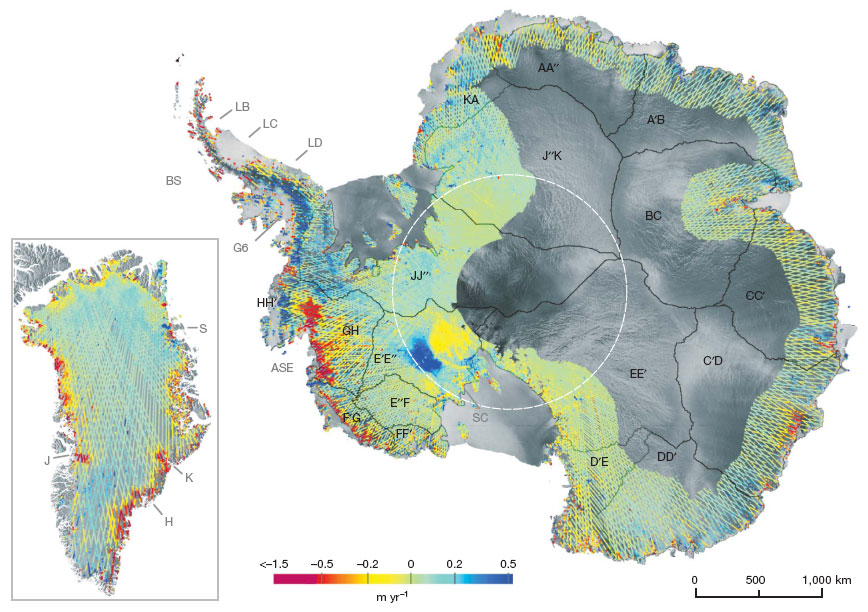
There's also Pritchard et al 2009 that finds significant thinning of glaciers on Greenland. Thinner glaciers means less mass, although how much less mass is more difficult to quantify. Here's an image from the paper (click for a larger version)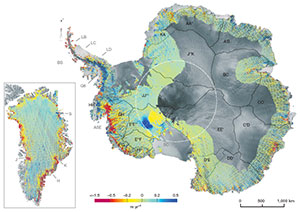 Notice how the thinning matches up with the GRACE and GPS data from Kahn paper. So that's three independent datasets (four, if you include prior radar altimetry data).
Thanks for pointing this one out, John. Now to get a copy of that paper for my own post at S&R.
Notice how the thinning matches up with the GRACE and GPS data from Kahn paper. So that's three independent datasets (four, if you include prior radar altimetry data).
Thanks for pointing this one out, John. Now to get a copy of that paper for my own post at S&R.
-
Albatross at 03:51 AM on 31 March 2010The human fingerprint in global warming
Sorry folks. The PW water link @ 68 is broken. It should be: http://www.pnas.org/content/104/39/15248.full The link for the NERSC summary is also broken: http://www.nersc.gov/news/annual_reports/annrep03/advances/5.1.fingerprints.html -
Geo Guy at 03:48 AM on 31 March 2010Greenland's ice mass loss has spread to the northwest
I think this post characterizes what Alarmists tend to say. The ice is disappearing hence increased CO2 is to blame. Nothing could be further from what is truly happening. For starters, ice can disappear by evaporation and sublimation resulting from wind blowing over its surface. Of course the predictions of massive sea level rises don't factor in this. John Daly, who has written a number of books arguing against the alarmist view, has posted temperature data that he obtained from GISS and CRU. He subdivided the data into regions, including the Arctic, and has data from a number of stations located in Greenland. http://www.john-daly.com/stations/stations.htm What is interesting is the temperature plots from 1930 onwards from stations located on Greenland show consistent temperatures and no rising temperatures - especially the the heights needed to melt glacial ice. Here are a few examples: http://www.john-daly.com/stations/dmkshavn.gif http://www.john-daly.com/stations/egdesmnd.gif http://www.john-daly.com/stations/ilulissa.gif http://www.john-daly.com/stations/janmayen.gif On another note regarding isostatic recovery, it should be noted that the norther part of North America is still rising. Canadian scientists have noted that while sea levels elsewhere in the world have risen marginally, they have found no signs of similar rising in the Canadian artic. They have concluded that this phenomenon is the result of isostatic recovery. What climate scientists need to take into account is the amount of water being displaced by this isostatic recovery - said water of course flowing into the other oceans and contributing to their rise. In other words, not all of the rise in ocean levels can be attributed to glacial melting. Finally you have to understand that when glaciers move, they are not melting but are growing. Glacial ice disappears from melting AND evaporation and sublimation. Since historical Greenland temperatures appear to be somewhat static since the 1930's, and keeping in mid that even if they are warmer than in the past, temperatures still remain sub-zero for most of the year, it is unlikely that any melting of Greenland ice is attributed to higher temperatures brought on by increased levels of atmospheric CO2. Scientists should look elsewhere for the cause if they are serious in trying to determine what is happening there. -
Albatross at 03:45 AM on 31 March 2010The human fingerprint in global warming
I'm a little surprised that there has not been much (if any) discussion yet on the seminal fingerprinting techniques used by Santer and others. Perhaps it is because their technique relies on a combination of observations, modelling and reanalyses (model runs constrained by observations). Regardless, Santer et al. have a few papers in which they make a very convincing case that the response of the biosphere has a marked human influence via higher concentrations of GHGs-- that is, the recent changes cannot be explained solely by internal climate variability or other natural drivers of climate. Here are some links: The human fingerprint on increase in precipitable water over the oceans The human fingerprint on changes in the height of the tropopause And another paper in Science There is also a summary here and here -
pohjois at 02:29 AM on 31 March 2010How you can support Skeptical Science
Congratulations for your fantastic effort. I rate your site as the best climate-related in known Internet. There are some problems with some arguments in Polish - the short explanation is fine, but then the link leads into some non-existent page. It would look much better if the dummy page with "Not translated yet" or something similar would be present instead. Thank you for this site.Response: Thanks for pointing this out, the error has been fixed. Those pages had been translated, it was just a glitch with the URL addressing.
Prev 2447 2448 2449 2450 2451 2452 2453 2454 2455 2456 2457 2458 2459 2460 2461 2462 Next


