


 Arguments


Recent Comments
Prev 239 240 241 242 243 244 245 246 247 248 249 250 251 252 253 254 Next
Comments 12301 to 12350:
-
Ken in Oz at 10:26 AM on 28 December 2018Global warming ‘hiatus’ is the climate change myth that refuses to die
Anticorncob6 - I also like to use the axial tilt theory of seasons as an analogy - on average each day of Spring will be warmer than the day before but we don't expect a few days or weeks of colder than average weather in Spring to mean there won't ever be Summer any more or that it "proves" the axial tilt theory must be wrong.
I admit I was surprised at how much traction "the Pause" got; to me it always looked exactly like the variability overlaying a continuing warming trend that closer studies confirm. Too little "expert" effort distinguishing between shorter term variability and underlying warming and expert efforts at learning what processes are involved in that shorter term variability?
Foster and Rahmstorf's work that estimated and "removed" ENSO, Volcanic Aerosol and Solar Intensity changes confirmed what I thought - that known sources of variability alone were enough to make "the Pause" indistinguishable within a longer term warming trend.
Averages of many model runs, where each run has ups, downs, pauses, accelerations may make for a smooth, each year warmer than the last type graph; it is not and should never be seen as a year by year prediction. Should perhaps have taken a leaf out of Exxon's book; their projections were of a (smooth) band of tempertures rising, not a single line average. But people making policy or having fiduciary duties of care - or journalists reporting about it - should be expected to know better.
-
Sunspot at 09:59 AM on 28 December 2018Global warming ‘hiatus’ is the climate change myth that refuses to die
Whether or not there was a "pause" in the rise of surface temps is actually irrelevant, and the fact that so much time is being wasted debating the issue is just another example of how we have let the deniers hijack the conversation. It's like debating the ridiculous notion that climate researchers are getting rich by forming a worldwide conspiracy to lie about the scientific data to justify their "enormous" research grants, which they spend sipping wine on the Riviera instead of freezing their butts off on the Greenland ice sheet. We are wasting time with these fools. We need to find a way to stop this.
-
bsettlem at 08:55 AM on 28 December 2018Breathing contributes to CO2 buildup
MA RODGER
Thanks for the Chart.
Humans account for about 36 percent of the biomass of all mammals. Domesticated livestock, mostly cows and pigs, account for 60 percent,
It wasn’t always this way. Humans are responsible for this.
A similar situation exists for birds. Poultry biomass is about three times that of wild birds.
It wasn’t always this way. Humans are responsible for this too.
Where did all this carbon come from you ask. Best guess, from a cloud of hot gases and other mass that resulted from the explosion of a very large star about five billion years ago.
It is speculated that this early ball of mass was surrounded with an atmosphere mainly composed of nitrogen, CO2 and water vapor.
I comment on one part of your message, Plants breathe day and night. During the day they do their photosynthesis thing, and produce oxygen. During the night it’s air in and air out. A very few plants are especially talented and do produce oxygen during the night.regards
-
nigelj at 07:54 AM on 28 December 2018Greta Thunberg's TEDx talk
This is possibly the single best video I have seen on this website. A scarily intelligent young woman. Even if the words are not all her own, she clearly understands them.
However unfortunately its well known that humans are built in a way where we respond best and most urgently to short term threats, and not things that unfold more slowly in the future, even if they are huge. We have to recognise this, and find a way of overcoming it.
-
nigelj at 04:59 AM on 28 December 20182018 SkS Weekly Climate Change & Global Warming Digest #51
MAR @19,
Can you clarify something briefly. I gather you have looked at the last 20 years of atmospheric emissions trends (which are accelerating) and found a slowing in the acceleration of these over about the last 5 years by pulling out el nino and la nina years? Looks convincing approach to me, my maths is too rusty for the details. But they are rather short time frames arent they?. Give it a couple more years of data you should publicise your views more widely. You may be onto something novel because I havent seen anyone else articulate this.
You also said that you found no compelling evidence for an increase recently in non anthropogenic emissions. But haven't we seen some evidence of more release of methane from the tundra and tropics?
-
nigelj at 04:39 AM on 28 December 2018Global warming ‘hiatus’ is the climate change myth that refuses to die
M Sweet @8 ah I see what you mean. Deny was a bad use of words on my part. I should have said scientists have found there was 'no pause'. Apologies if it was confusing.
However I stand by the rest of what I said. Lots of people see any slight flattening in temperatures as global warming stopping, unfortuntately we have to tediously explain otherwise. Unfortunately people don't see the obvious that you assume.
-
Philippe Chantreau at 04:18 AM on 28 December 2018Climate's changed before
Let me guess James, you spent haf a day on Google too?
-
Philippe Chantreau at 04:16 AM on 28 December 2018Breathing contributes to CO2 buildup
Bsettlem, you're not making any more sense than previously, sorry. It seems you may even somewhat contradict yourself. In any case, I don't have that kind of time. It's not that difficult to be clear and concise. Try.
-
jameschaucer at 02:08 AM on 28 December 2018Climate's changed before
Very nice site. However, as I've also been reading from various Noble prize winning scientists who insist on exactly the things this site purports to 'debunk' I think I consider you debunked instead.... unless you have a Noble prize in scientific fields germane to the subjects.
Moderator Response:[TD] Fittingly, you misspelled "Nobel." The only Nobel prize winning scientist that I'm aware of denying human-caused climate change is Ivar Giaever. He has no training, background, or scientific publications on that topic. He readily admitted:
"I am not really terribly interested in global warming. Like most physicists I don't think much about it. But in 2008 I was in a panel here about global warming and I had to learn something about it. And I spent a day or so - half a day maybe on Google, and I was horrified by what I learned. And I'm going to try to explain to you why that was the case."
A fuller explanation of breadth and depth of his incorrect opinions is in an article here on Skeptical Science.
-
Joel_Huberman at 01:01 AM on 28 December 2018Global warming ‘hiatus’ is the climate change myth that refuses to die
This is an excellent, clearly written article, but I do have two minor quibbles. First, the title is misleading, because this is not the climate change myth that refused to die, it's a climate change myth that refused to die. There are many others--for example, the myth that our current warming is caused by the sun.
Second, the singular of "phenomena" is "phenomenon."
I congratulate the authors on my finding only two things to quibble about. I'm hypercritical--in most essays I find many more problems.
Moderator Response:[TD] On the left side of every page of this site is a list of the most used climate myths. At the bottom of that list is a link to let you view all the myths ("arguments"). Alternatively, hover over the "Arguments" (myths) link in the menu bar at the top of the page. Each myth (argument) is listed with a factual rebuttal.
-
Evan at 23:29 PM on 27 December 20182018 SkS Weekly Climate Change & Global Warming Digest #51
MA Rodger@21 I understand these curves, and my point remains the same. Even if carbon intensity falls, if total CO2 continues to rise as the Keeling curve shows that it is, none of these other metrics will ever matter. The only value of these other metrics is that they give hope that we might solve the problem. In the meantime, atmospheric CO2 concentrations continue to accelerate upwards. If we focus on the graph that you show, we give people hope that we are getting on top of this problem and that we can relax. In other words, I see talk after talk that show graphs bending downwards, giving hope that we are winning, when all the while the Keeping curve is accelerating upwards. In the end analysis, it is the atmospheric CO2 concentration that will matter.
Can you explain why CO2 concentrations are increasing at such a rapid rate when carbon intensity is decreasing? If we were to continue to burn fossil fuels at the same rate we are now, but simply get the growing energy we need from renewables, we could continue to grow GDP without increasing carbon emissions. But even though carbon intensity would drop (i.e., GDP going up due to use of renewables and carbon emissions held constant), if renewables don't displace fossil fuels but merely add on top of them, then although carbon intensity will drop, CO2 will continue to rise. Or am I missing something?
-
michael sweet at 21:28 PM on 27 December 2018Global warming ‘hiatus’ is the climate change myth that refuses to die
Nigelj,
You said " I think the problem is some scientists have denied there was a pause" which is completely false. It cannot be twisted into a correct statement. there was never a pause in the increase of global surface temperature.
I think it is better to explain the escalator (available in the sidebar):

In person describe the escalator. I thnk most people over the age of five recognize that there is variation in temperature from day to day. From today until August 15 in the USA everyone expects it to get hotter (in New Zealand it will get colder). There will be periods of cold during the warming. This week happens to be warm at my house. The warm period does not prove winter has ended.
There was never a period of "slowdown, haitus or pause" in atmospheric warming. Your verbal gymnastics confuse the situation. Deniers deliberately lie about the existance of the "pause". Scientists should be vigorous in confronting those lies.
-
MA Rodger at 19:22 PM on 27 December 20182018 SkS Weekly Climate Change & Global Warming Digest #51
Evan @20,
Perhaps then some further food on the subject.
I don't think "cool summers" (or warm winters) will have much impact on the Keeling Curve. They are quite local phenomena and the proportion of our emissions resulting from space heating (& cooling) is small - some 16% in UK.
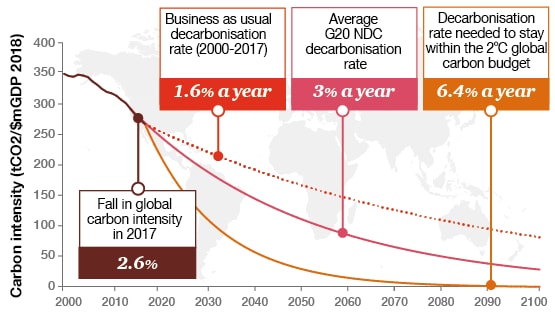
Population as a factor in AGW is a poor measure. A better factor is the size of the world economy but this has a varrying 'carbon intensity', the graphic below from here. The steepness of the downward trajectory is a useful measure of how well we are doing, although with a growing world economy 'carbon intensity' must drop quicker than economic growth rises. So the big big question is whether we have truly decoupled carbon emissions from economic growth, and in how many sectors and how many countries, and are doing it in time to prevent too much damage from AGW.
-
MA Rodger at 18:36 PM on 27 December 2018Breathing contributes to CO2 buildup
bsettlem @119,
The prospect is "horrible" indeed. Golly!! Lucky you spotted that!!!
So then, from where do humans get their 270g carbon fuel to allow continued breathing out of a kg of CO2 per day? As a human yourself, you should have some idea. Do you chew on a lump of coal for breakfast? Or perhaps you have a bedtime pint of crude oil?

Of course the problem is not just humans. We are a minor part of the animal kingdom. And bacteria & fungi - they breathe. And even plants breathe when the sun doesn't shine. With all that breathing out of CO2 (the graphic shows biomass, Fig 1 from here), where does all this carbon come from?
-
anticorncob6 at 13:28 PM on 27 December 2018Global warming ‘hiatus’ is the climate change myth that refuses to die
I like to use the analogy of seasonal climates. From February to July in the northern hemisphere, the temperature gradually warms. But that doesn't mean every day will be hotter than the last. That should help people understand why "no warming since 2016" is not a valid argument.
From the think tank:
“we just had […] the biggest drop in global temperatures that we have had since the 1980s, the biggest in the last 100 years.”
The 1980s wasn't 100 years ago; I don't get why he used two numbers there.
fireofenergy @5
That photo helps visualize exactly how many fossil fuels we burn, and is a great resource to deal with the "humans are too insignificant to change the planet" argument, but it shouldn't be used as an argument in of itself that burning fossil fuels does indeed warm the planet by unsafe amounts.
-
nigelj at 12:05 PM on 27 December 2018Global warming ‘hiatus’ is the climate change myth that refuses to die
Michael Sweet @4 yes point understood, and I clearly said there is no pause in underlying warming, but you have to see this from the publics perspective: They see a pause as just a flat period of temperatures on a graph, understandably, and the scientific explanation is a bit arcane for them. I've seen this confusion.
Perhaps the answer is simply to say temperatures were flat for a few years and explain why it happened and is of no consequence in the scheme of things etc, and there was no pause in underlying build up of energy.
-
fireofenergy at 11:11 AM on 27 December 2018Global warming ‘hiatus’ is the climate change myth that refuses to die
Just wanted to say thanks for the good work!
What I'm concerned about is not the little bit of cherry picked data that could be construed to say "the physics of GHGs have now changed to suit skeptic claims". No, what I'm concerned about is how we will come up with enough (clean) energy and willpower to remove the excess CO2. Realize that the growing world will need at least 25 TW of clean energy generation to meet the demands of almost 10 billion at high enough standards, to build very large space programs and to remove the excess CO2 by means of more infrastructure.
This is how I like to deal with skeptics. I show them the picture and say "we've burnt upwards of a hundred of these cubic miles of oil. Do you really think there will be no consequences?". We now burn the equalivalent of about 3 of them in all forms of FFs every year.
Will we ever come up with enough renewables/molten salt nuclear to match our fossil fuels use?
Moderator Response:[DB] Reduced image width.
-
michael sweet at 09:36 AM on 27 December 2018Global warming ‘hiatus’ is the climate change myth that refuses to die
Nigelj and Evan,
As the OP clearly states, rigourous statistical analysis has shown without any doubt that there was no "slowdown", "hiatus" or "pause" at any time in global warming between 1990 and the present. Chopping into smaller lengths only increases the uncertainty. Your 2002-2007 time period is so short that no useful analysis can be done on it.
Noisy data always has periods where the data increases faster and periods when it increases slower. That is caused by chance. All periods that appear by eye to have a slower slope are due to this random variations. They cannot be ascribed to any pause or slowdown. They are just expected , random variation around the upward trend.
Most of the claims of "haitus" use the technique of broken trends which is unphysical. Unphysical claims by defination cannot be considered as real under any reasonable standard.
Experienced scientists know that eyeballing the data often yields incorrect results. Re-read the OP if you have questions. It has been definatively shown that there was no "pause".
-
Riduna at 08:07 AM on 27 December 2018Australia - Moving to Renewable Energy
N.B.
This essay was written in November, 2018. I have now updated it by replacing Fig 2 and the first two paragraphs under the heading ‘New Investment’ so that they show Pipeline status at the end of December, 2018.
-
Riduna at 08:05 AM on 27 December 2018Australia - Moving to Renewable Energy
Michael Sweet
In 20-25 years time photovoltaic technology is likely to have advanced to the point where to-days massive panel arrays are replaced be cheaper, transparent and more efficient film applied to built and other structures. Such development would probably make to-days panels, salvage value only, probably involving a lot of waste
-
bsettlem at 07:15 AM on 27 December 2018Breathing contributes to CO2 buildup
MA Rodger
Good numbers math but horrible science
Humans are similar to engines, fuel them and they burn the fuel. Are you assuming that humans can continue to function without eating until they burn up all their carbon content?Moderator Response:[DB] Please limit the usage of bold font.
-
bsettlem at 07:11 AM on 27 December 2018Breathing contributes to CO2 buildup
Philippe Chantreau, Thank you for your response.
I humbly respond to your reply. I have sectioned your message and responded in italics****************
Bsettlem, your post makes no sense at all. You're acknowledgeing that total contribution from human respiration with a population of 9 billions would be only 0.5% of just gasoline burning emissions, therefore an even smaller fraction of all fossil fuel CO2.
**********
Yes, I essentially said the above. But the fact that my post makes no sense at all to you IMO tells me you need to read it more closely and reason it without self inflicting more information than I have written
**********
And somehow that makes it a bigger problem than fossil fuel?
**********
I never said this!**************
Indeed CO2's radiative properties are independent of its origins, and of anyone's opinion as well.
**********
Yes, I essentially said this but not in these words. CO2 does have an effect on the radiative relationship between the sun and Earth.
**********
As you stated yourself, human respiration generated CO2 is a tiny fraction of that coming from other sources,
************
Yes I said this!
*************
so these other sources, over which we have control, are what matters.
************
This is not something I said in my writing. What I conclude is that all CO2 counts even that discharged by humans exhalations, and I add now, that this quantity is approximately 4X that produced by humans when I was born. But there are other somewhat small sourceses which we do not have control over.
*************
You being absolutely sure of anything does not make it real.
*************
There is some evidence that Antarctica was once a paradise of life and during this time the Earths average atmospheric temperature was much warmer than it is now. And during the “ice ages” the atmospheric temperatures were much lower. It is absolutely real that the sun warms the earth and it is absolutely real that some atmospheric conditions create an imbalance to the amount of the suns energy that the earth accepts and rejects. The state of balance is the radiative equilibrium. And I am absolutely sure that human behavior is negatively affecting the probability that humans will survive until the earth will no longer be able to sustain life
***********
Some people are absolutely sure that the Earth is flat.
************
And I am sure that your opinions interfered with what you thought I was writing.Can you tell me what is wrong with this statement? By breathing out, we are simply returning to the air the same CO2 that was there to begin with.
Moderator Response:[DB] Note that in this venue, an overusage of bold font is considered shouting. Please keep its usage to a minimum.
Also note that the usual custom when quoting someone is to put their text between quote marks and in italic text. For additional clarity, you can indent the passage. Like this:
"I have sectioned your message and responded"
-
Evan at 07:02 AM on 27 December 20182018 SkS Weekly Climate Change & Global Warming Digest #51
MA Rodger@19 Please see the curve and analysis in Evan@18.
I like to think of a thick branch that has a bend in it. How easy is it to bend the branch opposite its natural bend? The reverse bend occurs slowly. If there are temporary reductions due to a cool summer that reduces the air conditioning load in a country and leads to a reduction of CO2 emissions from coal plants, such temporary cool summers are bound to not be often repeated.
I have not done the detailed analysis that you are doing, but rather have chosen to base my analysis on the 60-year data trend indicated by the Keeling curve, combined with the fact that with global population is continuing to rise, and no international agreements are yet enacted for serious reductions in emissions. I see any temporary blip in the data as inconsequential to the overall trend. In other words, in the same way that we correct climate deniers for focusing on "pauses" and not looking at the long-term data, I also tend to focus on the long-term Keeling curve and not get excited by short-terrm blips.
But I appreciate all the points you make and you've given me a lot more food for thought. Thanks.
-
MA Rodger at 06:50 AM on 27 December 20182018 SkS Weekly Climate Change & Global Warming Digest #51
Evan @15,
Indeed you are correct in putting the MLO measurements of atmospheric CO2 levels as the prime data and to say that it shows there has undoubtedly been an acceleration in the CO2 rise since 1960. Back then, the rise was averaging some 0,7ppm/yr and it is now averaging some 2.4ppm/yr, suggesting an acceleration of roughly 2% per year over the period. And over that same period, the CO2 emissions from all anthropogenic sources have also risen at a rate of roughly 2% per year. This does suggest that the Keeling Curve is driven by anthropogenic emissions, and nothing else.
So if in recent years (since 2014), if anthropogenic sources have shown no rise, would this suggest that the acceleration may have been halted (at least for the years 2014-17 as we still await the 2018 figure for total emissions)?
Now, the MLO data does show a lot of wobble, much of it based on the ENSO cycle. If the ENSO cycle is accounted using MEI (shifted by 8 months which gives he best fit to the CO2 wobble) and correlated against the CO2 Airborne Fraction (as per the Global Carbon Project numbers), the MLO data does appear to show an end to the acceleration (abet still noisy), or at least no reason to suggest that there is any significant non-anthropogenic source of CO2 emissions impacting the atmospheric levels.
With no increase in anthropogenic emissions, I would suggest that any notion of continued acceleration through recent years requires a non-anthropogenic source. (This of course does not mean a return to accelerating anthrpogenic emissions can be guaranteed.) I have not ever found evidence to support the existence of any significant non-anthropogenic emissions as the source of acceleration. (This of course does not mean there has not been such accelerating emissions, either now or future.)
So is there some reason to consider such analysis invalid?
-
Evan at 06:20 AM on 27 December 20182018 SkS Weekly Climate Change & Global Warming Digest #51
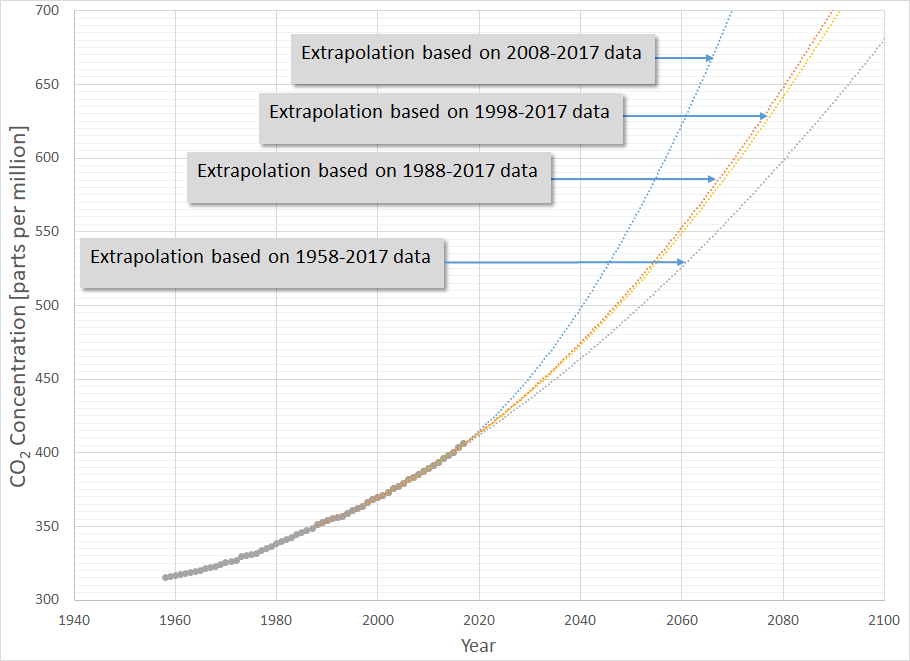
nigelj @16&17, great question. Here is a look at the Keeling curve that uses the following data fits.
1958-2017
1988-2017
1998-2017
2008-2017
What is interesting is that fitting the data for 1988-2017 and 1998-2017 give almost the same trends. But, during the 90's three things happened. The USSR was collapsing and reducing their energy usage, Britain was converting from coal to gas, and France was finishing their conversion to nuclear. After the 90's things started to increase.
There are two scary things in the following plot. Using all of the data from 1958-2017 shows that CO2 concentration is accelerating upwards, But looking at how the curves get steeper and steeper as you use only the most recent data suggests that the acceleration is accelerating.
However, I am not ready to publish that in a blog article, because whereas 60 years of data gives a long-term solid trend, something like 10-20 years of data may not stand statistical rigor. But still, the point is that CO2 concentrations are accelerating upwards.
If you divide the increases by the population in each year, you can attribute have of the increase to increasing population and half the increase to the rise of affluence.
-
nigelj at 06:04 AM on 27 December 20182018 SkS Weekly Climate Change & Global Warming Digest #51
So there is actually a recent acceleration in the acceleration. so much for my eyeballing.
-
nigelj at 05:55 AM on 27 December 20182018 SkS Weekly Climate Change & Global Warming Digest #51
I'm trying to figue out what you guys mean. I look at a graph of the Mauna loa data here, and I see by eye a gentle curve over the period 1960 - 2018 so a mild acceleration over the full period. Is that what you mean Evan?
But eye balling the last ten years I dont see an obvious acceleration in this acceleration.
I think the decrease in emissions over the last few years is real, but the exact numbers would be approximate. But would a couple of years slowdown in actual emissions even show up in the mauna loa trend? I think you would need something more substantial wouldn't you?
-
Evan at 05:55 AM on 27 December 20182018 SkS Weekly Climate Change & Global Warming Digest #51
MA Rodger@14, please see figure 2 in Evan@3. This is the Keeling Curve (gray dots) with a quadratic function fitted. The quadratic function fits with R2 = 0.99 for the period 1960 to present. If you use just the last 20 years the curve is steeper! The fact that the second derivative of the Keeling curve is positive means that CO2 concentrations are accelerating upwards.
For whatever it's worth, Ralph Keeling (son of Charles David Keeling) says the same thing (that CO2 concentrations are accelerating upwards) in the Nova program "Decoding the Weather Machine."
I would love for somebody to shoot a hole in my argument, but the CO2 measurements represent one of the most solid data sets we have, and include the balance of all sources and sinks, but natural and human.
-
Evan at 05:45 AM on 27 December 20182018 was the hottest La Niña year ever recorded
nigelj@7 people who live in earthquake zones know that when there is a pause in earthquake activity that the big one might be coming. The energy keeps building up year after year, whether or not it is periodically released.
-
Evan at 05:37 AM on 27 December 2018Global warming ‘hiatus’ is the climate change myth that refuses to die
nigelj@2 yes, we agree on the need to acknowledge a slowdown in atmospheric warming. When we acknowledge a pause in atmospheric warming, we need to remind people that during that period the oceans are still warming. In other words, we don't want to let people think that by natural variation we mean the warming has stopped for a few years and may stop for a couple of decades. Natural variation means that the way that oceans move energy around has natural variations, but that as long as there is an energy inbalance, the energy is always increasing. If you live in an earthquake zone, you become more concerned during a lull in earthquakes, not less, because you know that the energy is still building, and that the next one might be the big one.
-
nigelj at 05:29 AM on 27 December 2018Global warming ‘hiatus’ is the climate change myth that refuses to die
Excellent, and well explained, however I think the problem is some scientists have denied there was a pause which is technically correct in energy accumulation terms etc, but the public see a clear slowdown or "pause" in surface temperatures from about 2002 - 2007 in the smoothing line in the nasa giss graphs, so the public get confused. You have to ackowledge there was a pause in surface temperatures, or it looks deceitful.
I remind people that the intermittent slow periods of warming of a few years are just the influence of natural variation, and that the early IPCC reports predicted there would be slow warming periods of up to 10 years, due to the impact of natural variation. We have seen a couple so its exactly what was predicted! So the so called pause never bothered me.
-
nigelj at 05:25 AM on 27 December 20182018 was the hottest La Niña year ever recorded
Excellent, and well explained, however I think the problem is some scientists have denied there was a pause which is technically correct in energy accumulation terms etc, but the public see a clear slowdown or "pause" in surface temperatures from about 2002 - 2007 in the smoothing line in the nasa giss graphs, so the public get confused. You have to ackowledge there was a pause in surface temperatures, or it looks deceitful.
I remind people that the intermmitent slow periods of warming of a few years are just the influence of natural variation, and that the early IPCC reports predicted there would be slow warming periods of up to 10 years, due to the impact of natural variation. We have seen a couple so its exactly what was predicted! So the so called pause never bothered me.
-
MA Rodger at 03:54 AM on 27 December 20182018 SkS Weekly Climate Change & Global Warming Digest #51
Evan @13,
It is good that we have clarified your meaning. And to be entirely accurate, with this talk of "acceleration," you are evidently not talking "emissions" but man-made "emissions."
Sadly it does beg the question as to what is causing this "acceleration" in atmospheric CO2 given you say "atmospheric CO2 concentrations continue to accelerate upwards." Or indeed whether there is any evidence of "atmospheric CO2 concentrations continu(ing) to accelerate upwards." Myself, I do not see it. And it is not as though I have not looked. (I am happy to share what this 'looking' has shown me.)
-
Evan at 03:07 AM on 27 December 2018Global warming ‘hiatus’ is the climate change myth that refuses to die
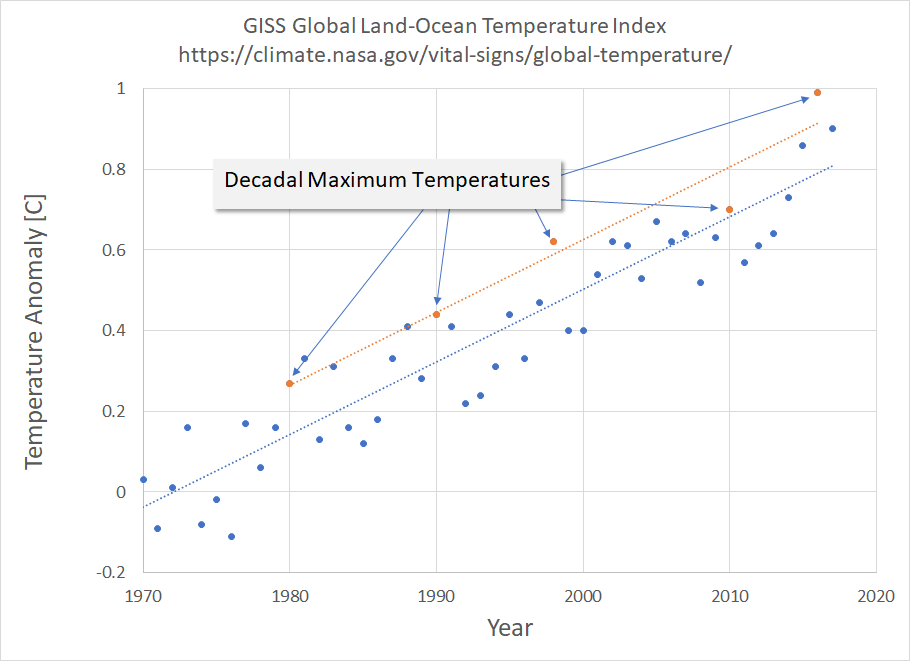
I have a favorite plot I like to use to show the lack of a pause, and I just updated it with the GISS Global Land-Ocean Temperature Index. I find it interesting that a linear fit of the temperature record since 1970 parallels a linear fit of the decadal maximum temperatures. The point being that if the cherry-pickers were honest, they would see that their cherries are increasing at the same rate as the rest of the data. I don't expect to convince them, but hope others might find this interesting.
-
Evan at 23:52 PM on 26 December 20182018 SkS Weekly Climate Change & Global Warming Digest #51
MA Rodger@12 When I say upward acceleration, I am not referring to emissions. I am referring to CO2 accumulating in the atmosphere. I'm sure you agree that it really does not matter if we stabilize emissions if atmospheric CO2 concentrations continue to accelerate upwards, and they are. Atmospheric CO2 concentrations are what we should be focusing on to evaluate how well we're doing, because that gives us the net effect of everything, including changing re-absorption rates by the biosphere and positive feedbacks. Isn't it concerning if emission rates have stabilized but atmospheric CO2 concentrations continue to accelerate upwards? Or am I missing something? I realize the only thing we can write policies for are emissions, but unfortunately the climate only cares about atmospheric CO2 concentrations. I am not trying to be argumentative, just trying to understand the relationship between emissions and accumulating CO2, and where we should be placing our focus. Thanks for your detailed responses.
-
Evan at 22:20 PM on 26 December 20182018 was the hottest La Niña year ever recorded
nigelj@5 I think the point that climate scientists like James Hansen have been making is that the energy continues to be pumped into the climate year after year, but because of the complex ocean circulation and El Nino/La Nino cycles, we just don't see it in the atmospheric temperature record as a smooth increase. I know you know that, but we have to keep reminding ourselves of this when focusing down on short-term trends.
-
MA Rodger at 19:26 PM on 26 December 20182018 SkS Weekly Climate Change & Global Warming Digest #51
Evan @8,
You say:-
"However, the idea that the world will respond in a manner to cause CO2 to naturally start decreasing I see as wishful thinking (no offense meant)."
I do note you continue by describing "reversing an upward acceleration, ... move to a constant increase, ... Then we must decrease from there," so in some manner we do speak at cross-purposes.
Just to be clear, my talk of this natural process reducing CO2 levels: this year draws to a close and we will have emitted some 11.4Gt(C) of CO2 into the atmosphere over the year. Yet the atmospheric CO2 levels do not increase by 11.4/2.13=5.4ppm over the year. The levels of annual rise in CO2 are wobbly but there is on average 55% of our emissions disappeared, into the oceans & biosphere. This 11.4*0.55=6.27Gt(C) of drawdown is a response not only to this year's emissions but to previous years. The drawdown continues when "you stop emissions" eventually resulting in 80% of our emissions being disappeared over a millenia. (See Archer et al (2009) 'Atmospheric Lifetime of Fossil Fuel Carbon Dioxide') This is the process I describe @5, "once you stop emissions, the falling CO2 forcing would balance with the warming from the remaining un-balanced forcing leaving a roughly constant global temperature, even a cooling."
I could continue by pointing out that the global CO2 emissions calculated for recent years show little or zero increase, perhaps a sign that "upward acceleration" has ended, but some find this difficult to accept so I won't press the point.
-
nigelj at 17:11 PM on 26 December 20182018 was the hottest La Niña year ever recorded
Evan @2, yeah you are right. Looking at NASA GISS and the smoothed line, any slowdown was about 5 years at most around 2002 - 2007 and not dissimilar from previous slowdowns since 1970. Its obviously not significant. The long term smoothed line does form a step like pattern though, but nothing really radically different recently.
-
anticorncob6 at 16:33 PM on 26 December 20182018 was the hottest La Niña year ever recorded
The fact that the La Niña of 2018 was warmer than the El Niño of 2010 and all El Niños from before is really telling.
2014 surprassed 2010 as the hottest year on record and it was a neutral year, and it looks like we probably won't get another year cooler than 2014 in our lifetimes, unless we get a really strong La Niña pretty soon.
-
barry1487 at 14:47 PM on 26 December 20182018 was the hottest La Niña year ever recorded
The choice of Nina metrics seems a little arbitrary. Make different choices and 2017 is the warmest la Nina year.
http://origin.cpc.ncep.noaa.gov/products/analysis_monitoring/ensostuff/ONI_v5.php
Substantively, the point hardly alters, but the messaging is a little less compelling...
-
scaddenp at 12:34 PM on 26 December 2018Freedom of Information (FOI) requests were ignored
And for contrast, deniers favourite temperature series is UAH. They are not reknowned for providing quick access to their code - does anyone know if code for latest version is available yet?
Do note that scientists in all fields tend to hold tight to raw data till they have had a chance to publish it properly. I think this may have been source of accusations over paleo proxies some time in the distant past.
-
AFT17170 at 10:49 AM on 26 December 2018Freedom of Information (FOI) requests were ignored
Er, wow. Thanks Daniel, especially for giving such a reply on Christmas Day.
-
Daniel Bailey at 09:53 AM on 26 December 2018Freedom of Information (FOI) requests were ignored
Note that the Muir Russell Commission was able to do a full global reconstruction from the raw data linked to from the above page, without any code, in a mere 2 days (when asked, they replied "any competent researcher" could have done the same).
The Auditors over at McIntyre's Climate Audit have been struggling with their "audit" reconstruction for many years now.
The "any competent researcher" bit comes from here:
"key data was freely available and could be used by any "competent" researcher"...They used data from public databanks and wrote their own computer code, which they say could be repeated by any "competent researcher". The results were similar to those of the CRU."
And
The "2 days" bit comes from here:
The report itself is here.
-
Daniel Bailey at 09:45 AM on 26 December 2018Freedom of Information (FOI) requests were ignored
Actually, pretty much all of the data (raw or otherwise) and model code is openly available.
The raw data:
ftp://ftp.ncdc.noaa.gov/pub/data/ghcn/v2
ftp://ftp.ncdc.noaa.gov/pub/data/ushcn/
ftp://ftp.ncdc.noaa.gov/pub/data/ushcn/v2/monthly/
http://dss.ucar.edu/datasets/ds570.0/
http://www.antarctica.ac.uk/met/READER
http://eca.knmi.nl/
http://www.zamg.ac.at/histalp/content/view/35/1
http://amsu.cira.colostate.edu/
Link to SORCE
http://daac.gsfc.nasa.gov/atdd
http://oceancolor.gsfc.nasa.gov/
http://www.psmsl.org/
http://wgms.ch/
http://www.argo.net/
http://icoads.noaa.gov/
http://aeronet.gsfc.nasa.gov/
http://aoncadis.ucar.edu/home.htm
http://climexp.knmi.nl/start.cgi?someone@somewhere
http://dapper.pmel.noaa.gov/dchart/
http://ingrid.ldgo.columbia.edu/
http://daac.gsfc.nasa.gov/giovanni/
http://www.pacificclimate.org/tools/select
http://gcmd.nasa.gov/
http://www.clivar.org/data/global.php
http://www.ncdc.noaa.gov/oa/ncdc.html
http://www.ipcc-data.org/maps/
http://climatedataguide.ucar.edu/
http://cdiac.ornl.gov/
http://www.cru.uea.ac.uk/cru/data/
http://www.hadobs.org/Next, the processed data:
http://data.giss.nasa.gov/gistemp
http://clearclimatecode.org/
http://hadobs.metoffice.com/hadcrut4/index.html
http://www.ncdc.noaa.gov/cmb-faq/anomalies.php#anomalies
http://ds.data.jma.go.jp/tcc/tcc/products/gwp/temp/ann_wld.html
http://www.berkeleyearth.org/
http://vortex.nsstc.uah.edu/data/msu/
http://www.ssmi.com/msu/msu_data_description.html
http://www.star.nesdis.noaa.gov/smcd/emb/mscat/mscatmain.htm
ftp://eclipse.ncdc.noaa.gov/pub/OI-daily-v2/
http://www.cpc.noaa.gov/products/stratosphere/temperature/
http://arctic.atmos.uiuc.edu/cryosphere/
http://nsidc.org/data/seaice_index/
http://www.ijis.iarc.uaf.edu/en/home/seaice_extent.htm
https://seaice.uni-bremen.de/sea-ice-concentration/
http://arctic-roos.org/
http://ocean.dmi.dk/arctic/icecover.uk.php
http://www.univie.ac.at/theoret-met/research/raobcore/
http://hadobs.metoffice.com/hadat/
http://weather.uwyo.edu/upperair/sounding.html
http://www.ncdc.noaa.gov/oa/climate/ratpac/
http://www.ccrc.unsw.edu.au/staff/profiles/sherwood/radproj/index.html
http://cdiac.ornl.gov/trends/temp/sterin/sterin.html
http://cdiac.ornl.gov/trends/temp/angell/angell.html
http://isccp.giss.nasa.gov/products/onlineData.html
http://eosweb.larc.nasa.gov/project/ceres/table_ceres.html
http://sealevel.colorado.edu/
http://ibis.grdl.noaa.gov/SAT/SeaLevelRise/index.php
http://dataipsl.ipsl.jussieu.fr/AEROCOM/
http://gacp.giss.nasa.gov/
http://www.esrl.noaa.gov/gmd/aggi/
http://www.esrl.noaa.gov/gmd/ccgg/trends/
http://gaw.kishou.go.jp/wdcgg/
http://airs.jpl.nasa.gov/AIRS_CO2_Data/
http://www.usap-data.org/entry/NSF-ANT04-40414/2009-09-12_11-10-10/
http://climate.rutgers.edu/snowcover/index.php
http://glims.colorado.edu/glacierdata/
http://www.nodc.noaa.gov/OC5/3M_HEAT_CONTENT/
http://oceans.pmel.noaa.gov/
http://cdiac.ornl.gov/oceans/
http://gosic.org/ios/MATRICES/ECV/ecv-matrix.htm
http://www.ncdc.noaa.gov/bams-state-of-the-climate/2009-time-series/Now, the model code:
http://www.giss.nasa.gov/tools/modelE/
ftp://ftp.giss.nasa.gov/pub/modelE/
http://simplex.giss.nasa.gov/snapshots/
http://www.cesm.ucar.edu/models/
http://www.ccsm.ucar.edu/
http://www.ccsm.ucar.edu/models/ccsm3.0/
http://www.cgd.ucar.edu/cms/ccm3/source.shtml
http://edgcm.columbia.edu/
http://www.mi.uni-hamburg.de/Projekte.209.0.html?&L=3
http://www.mi.uni-hamburg.de/SAM.6074.0.html?&L=3
http://www.mi.uni-hamburg.de/PUMA.215.0.html?&L=3
http://www.mi.uni-hamburg.de/Planet-Simul.216.0.html?&L=3
http://www.nemo-ocean.eu/
http://www.gfdl.noaa.gov/fms
http://mitgcm.org/
https://github.com/E3SM-Project
http://rtweb.aer.com/rrtm_frame.html
http://www.sciencemag.org/cgi/content/full/317/5846/1866d/DC1
http://www.pnas.org/content/suppl/2009/12/07/0907765106.DCSupplemental
http://geoflop.uchicago.edu/forecast/docs/Projects/modtran.html
http://geoflop.uchicago.edu/forecast/docs/models.html
http://www.fnu.zmaw.de/FUND.5679.0.html
http://www.pbl.nl/en/themasites/fair/index.html
http://nordhaus.econ.yale.edu/DICE2007.htm
http://nordhaus.econ.yale.edu/RICEModelDiscussionasofSeptember30.htm
https://github.com/rodrigo-caballero/CliMT
http://climdyn.misu.su.se/climt/
http://starship.python.net/crew/jsaenz/pyclimate/
http://www-pcmdi.llnl.gov/software-portal/cdat
http://www.gps.caltech.edu/~tapio/imputation
http://holocene.meteo.psu.edu/Mann/tools/MTM-SVD/
http://www.atmos.ucla.edu/tcd/ssa/
http://holocene.meteo.psu.edu/Mann/tools/MTM-RED/
http://www.cgd.ucar.edu/cas/wigley/magicc/Source code for GISTEMP is here:
https://data.giss.nasa.gov/gistemp/sources_v3/
https://data.giss.nasa.gov/gistemp/news/
https://data.giss.nasa.gov/gistemp/faq/
https://data.giss.nasa.gov/gistemp/
https://simplex.giss.nasa.gov/snapshots/Related links:
https://data.giss.nasa.gov/gistemp/faq/
https://data.giss.nasa.gov/gistemp/faq/#q209
https://podaac.jpl.nasa.gov/
https://daac.gsfc.nasa.gov/
https://earthdata.nasa.gov/about/daacs
http://www.wmo.int/pages/prog/wcp/wcdmp/index_en.php
http://berkeleyearth.org/summary-of-findings/
http://berkeleyearth.org/faq/
https://www.climate.gov/news-features/understanding-climate/climate-change-global-temperature
https://www.climate.gov/maps-data/primer/climate-data-primer
https://www.ncdc.noaa.gov/monitoring-references/faq/anomalies.php
https://www.ncdc.noaa.gov/ghcnm/v3.php?section=quality_assurance
https://www.ncdc.noaa.gov/ghcnm/v3.php?section=homogeneity_adjustment
https://www.ncdc.noaa.gov/crn/
https://www.ncdc.noaa.gov/crn/measurements.html
https://agupubs.onlinelibrary.wiley.com/doi/full/10.1029/2009JD013094
https://agupubs.onlinelibrary.wiley.com/doi/full/10.1029/2011JD016761
https://agupubs.onlinelibrary.wiley.com/doi/full/10.1002/2015GL067640
https://www.clim-past.net/8/89/2012/
https://www.carbonbrief.org/explainer-how-data-adjustments-affect-global-temperature-recordsGlobal surface temperature records use station temperature data for long-term climate studies. For station data to be useful for these studies, it is essential that measurements are consistent in where, how and when they were taken. Jumps unrelated to temperature, introduced by station moves or equipment updates, need to be eliminated. The current procedure also applies an automated system that uses systematic comparisons with neighboring stations to deal with artificial changes, which ensures that the Urban Heat Island effect is not influencing the temperature trends. In the same fashion that a chef turns raw ingredients into a fine meal, scientists turn raw data into a highly accurate and reliable long-term temperature record.
Although adjustments to land temperature data do have larger consequences in certain regions, such as in the United States and Africa, these tend to average out in the global land surface record.
-
Evan at 09:38 AM on 26 December 20182018 was the hottest La Niña year ever recorded
Using 1970 as the year when the temperature anomaly emerged from the background noise as the starting point, plot the maximum atmospheric temperature for each decade (which is often the temperature of El Nino years), fit a line to it, and it parallels the line derived from fitting all of the atmospheric temperature data. Has there ever really been a slowdown if we look at the data over a long enough time period? The following plots merely shows that during large El Nino years that the temperature is about 0.2C higher than the long-term trend.
 Moderator Response:
[DB] Reduced image width
-
Philippe Chantreau at 08:27 AM on 26 December 2018Climate scientists are in it for the money
AFT, these claims are popular among people sharing a certain ideology. They amount to slightly more than conspiracy theory but not much, and they do not hold up to scrutiny. Virtually nobody arguing that way ever spends the time and effort necessary to determine how much reality underlies these claims.
1) A large amount of research comes from NASA, and it continues to point in the same direction. Another body of research is from the military, i.e. Navy and Air Force. It shows the same as the rest of the evidence, some of it was very early on. Repeated attempts at silencing scientists or suppressing their work have been reported during the Bush administration, it has reached rdiculous proportions under Trump, so the problem is actually the other way around: anti AGW (whatever that may mean) actors actively try to silence researchers and do not fund research because they know that it will show the opposite of what they want to see. The BEST project was a shining example, look it up. Exxon did fund research and it showed the same thing as the research from other sources (see appropriate thread); it is not very surprising that they stopped funding it now, is it? Why would these actors continue to fund research that they know will show exactly the opposite of what their financial interests demand? How much have they actually funded, then suppressed, because it did not serve their interests?
2) The only way to get funding should be to propose quality research that advances knowledge. That is the case for the vast majority of it. Denial motivated research in virtually all the publicized cases ends up of such poor quality that it generates questions on the review process that allowed it through. Multiple cases have been shown to be the results of intentional, organized peer-review hijacking, or the publicity was owed to gross misrepresentation of results, or press releases advertised conclusions that were not supported by the paper. A while ago, it was the infamous Soon-Baliunas, Legates, and a few others are there for your examination. The stream has dried up somewhat lately. Prominent denial voices (Spencer) still can not come up with research that truly supports their publicly voiced opinions.
3) Exactly why would that be? Reviewers are often anonymous, what interest do they have to allow poor quality papers? Scientists tend to try to undermine each other's work far more than people realize. There is seldom better satisfaction than proving a competitor wrong.
These arguments are neve accompanied by specifics. They simply don't hold up. Those who want to be convinced by them simply assume that they are true because it make sense to them, flatters their already held beliefs, and they never bother digging or just exploring the logic of it, as for the first argument. The real problem is this: nobody has a real financial incentive in climate science being correct, including scientists themselves. The effort that societies will have to produce to deal with it, whether they try to mitigate, remediate, or any combination will be enormous. Ask any any climate scientist if they wish climate science was wrong and see what their answer are.
-
nigelj at 07:47 AM on 26 December 20182018 SkS Weekly Climate Change & Global Warming Digest #51
Evan @10, agreed. I also think people look at impacts of climate change such as general warming, and impacts on crops and think it will be slow and we will adapt and genetic engineering will 'solve it' for example. Firstly they underestimate the costs of even slow adaptation, and the slowness lulls people into a false sense of security, because some elements of climate change wont be slow, and it only takes one rapid element of change to be a huge problem. As you say it's important to focus on the possibility we could see short periods of rapid sea level rise of a foot or more a decade interspersed with more sluggish periods.
Its speed of transitions like this that would be very difficult to adapt to. Buildings are designed to last about 100 years, so its possible to design for a world with a known quantity of sea level rise over multi centuries, by hopping inland in an orderly way. Costly, but manageable. But theres a possibility of erratic spurts of sea level rise of several metres per century or less and it's impossible to plan for this, and infrastructure will have to be abandoned before its use by date, over and over again.
I think the IPCC do a good job of discussing the risks, possibly they are on the conservative side a bit but overall its good. What I think might have gone wrong is how the mainstream media interpret and communicate the issues. The focus seems to swing from the usual risks of more storms, reduced agricultual issues, multi century sea level rise, and general warming on the one hand, and more scaremongering claims that are stated in such general ways as to be useless and easily refuted. They miss the key problems and more specific quantifiable problems of a world of 5 - 10 degrees having inolerable heatwaves, the possibility of short periods of rapid sea level rise,and so on. Some media have covered this, but not enough.
-
nigelj at 05:32 AM on 26 December 20182018 was the hottest La Niña year ever recorded
We had the slowdown in warming (such as it was, not very much) from about 1998 - 2014, then temperatures jumped from 2015 - 2016, and remain quite high even during a la nina. It looks like temperatures may be resetting at a permanently higher level. Speculation of course, but perhaps this is a sign of things to come, a very "step like" progression of warming, perhaps due to something to do with how ocean processes work.
-
AFT17170 at 03:15 AM on 26 December 2018It's the sun
Oops, I withdraw my last question.
-
AFT17170 at 03:14 AM on 26 December 2018It's the sun
Hello. I notice that the last post on this topic was ~6.5 years ago. Figure 1 in the overview is very helpful to a lay person newbie like me. Are there any updates from the last few years? Thanks in advance.
Prev 239 240 241 242 243 244 245 246 247 248 249 250 251 252 253 254 Next


