


 Arguments


Recent Comments
Prev 2546 2547 2548 2549 2550 2551 2552 2553 2554 2555 2556 2557 2558 2559 2560 2561 Next
Comments 127651 to 127700:
-
HumanityRules at 01:48 AM on 28 November 2009East Antarctica is now losing ice
#13 Pedantic is fine. I'm about to get pedantic on you! Not sure what you meant by "digitised the 3 graphs". The BOM website provides the actual numbers for each data point. Go http://www.bom.gov.au/climate/data/weather-data.shtml then fill in the appropriate fields you can get the station numbers from my linked graphs. I put those numbers in excel and added a trend line and got Mawson 0.0077/yr Davis 0.007/yr Casey 0.015/yr I agree with your last sentance. The Mawson Davis and casey data is all in the PDF below. #12 I showed 3 points because that is all the raw data the Australian website carries, I didn't choose them thats all there is. There are plenty of records for Oz as well, I thought given the site owners nationality there might be some interest for this site. I love the fact that you ask me for linear regressions and null hypothesis and then show me for comparison a map with different shades of pink!! Check the references for your article they make interesting reading. Here's one PDF http://www.scar.org/researchgroups/physicalscience/reader_turneretal.pdf . This shows a mixed picture over the continent. It appears something significant is occuring on the penninsula. But then what does that mean for the rest of the continent. They report 11 data sets rising and 7 falling. There are 3 data sets on the penninsula which means that for the rest of the continent there are 8 rising and 7 falling. -
neilperth at 00:12 AM on 28 November 2009What do the hacked CRU emails tell us?
In a strange way the hacked HadCrut emails have finally convinced me that global warming is man-made :) -
Riccardo at 11:00 AM on 27 November 2009What do the hacked CRU emails tell us?
TruthSeeker, you should be frustrated for not having looked at the science behind dendroclimatology and at the simple fact that one set of tree rings alone tells us just a little, many different cross-checked reconstructions are solid evidence. It would be really poor science if they throw away thousands of data sets just because a few got weird. Indeed, they are studying the divergence problem, which is related more to tree physiology than to climate. -
TruthSeeker at 09:57 AM on 27 November 2009The physical realities of global warming
Also, what is wrong with asking for another source to support the data that the HADCRU provides. The whole accusation is that they are biased and fix the data to fit their hypothesis, they fight the freedom of information act and deny access to their data, and that independents don't support their conclusions. I could be convinced that their evidence is accurate if an independent part could replicate the data. Now, I would still like someone to explain to me that, if it is currently increasing, this trend isn't driven by the sun, as the thread on that subject is woefully lacking.Response: There are various independent studies that confirm the HADCRU data - coincidentally I'm working on a post on that very subject (hopefully later today).
How do we know the sun isn't driving the warming trend? Because over the past 30 years, the sun has shown a slight cooling trend. Because of this, there is a long list of peer reviewed studies concluding the sun has played a very minor role in global warming. -
TruthSeeker at 09:52 AM on 27 November 2009The physical realities of global warming
Here is the quote I was referring to but since has been deleted. " the people responsible for the graph may be accused of cherry-picking. I don't, but in the present situation, i would never have shown something like that. Other selections give entirely different results. " See, SNRatio suggested that they could be accused of cherry picking and that other selections give entirely different results. -
TruthSeeker at 09:40 AM on 27 November 2009It's the sun
Did anyone answer the question as to why correlation has to be between increase and sun activity and temperature. As I heard it stated, I can put a pot of cold water on my stove, heat up my stove from fold to a constant temperature quickly, and then have the water take much longer to heat and continue to heat up even after my stove is at a constant temp. Why is it any difference from the sun? Especially now as the sun activity seams to be declining and the temperatures of the last decade are stagnate.Response: This issue is examined in Climate time lag. -
TruthSeeker at 09:33 AM on 27 November 2009What do the hacked CRU emails tell us?
Riccardo at 20:23 PM on 25 November, 2009 TruthSeeker, "So why don't we exclude all the tree ring data, since its be proven to be faulty?" Never this proof appeared," Really, the proof appeared when they "diverged" from the temperature record, and as a result those individual entries are no longer considered good. If they arn't what evidence does anyone have that these were ever any good? Until someone can explain to me why, when their is no temperature record, they are good, but when a temperature record exist they are "to low" they will just be proof positive that these scientist are cherry picking. I am getting frustrated with the number of people telling me they were once good(supplying no supporting evidence) and then saying but now that we have temperature records they are to low. -
Riccardo at 08:31 AM on 27 November 2009East Antarctica is now losing ice
HumanityRules, I know you're not in bad faith and i hope you'll not find me too pedantic for what i'm going to say. You should not take graphs for what they just appear; look at the tempeature scale, it's huge for the kind of difference you're looking for. I digitized the three graphs to check for trend. Casey and Davis are both increasing (0.014 and 0.019 °C/yr respectively) but the former is not statistically significant due to the few data available. Mawson is almost flat, 0.002 °C/yr not statistically significant. Doing science is a hard task and no one should draw conclusions without thinking twice and checking thrice. Or more. -
PeterPan at 07:13 AM on 27 November 2009An overview of Antarctic ice trends
A skeptic recently showed me that the IPCC 2007 blamed the West Antarctic ice loss on ongoing grounding line retreat since the Last Glacial Maximum: "They found [...] a trend in antarctic shrinkage of about 90 Gt yr–1, primarily because of retreat of the West Antarctic grounding line in response to the end of the last ice age" http://www.ipcc.ch/pdf/assessment-report/ar4/wg1/ar4-wg1-chapter4.pdf (p 366) The references are Huybrechts 2002 (abstract) and Huybrechts et al 2004 (full pdf): "quite large thinning rates up to 30 cm/year over the West Antarctic ice sheet, related to ongoing grounding line retreat since the Last Glacial Maximum". I don't know if they are speaking about the same thing... He, of course, also pointed that the glaciar rebound was overestimated (Bevis et al 2009 - press) and it may substract around 33 Gt/yr from GRACE estimates. From the linear trend (143 ± 73 Gt /año), that would leave 110 Gt/yr, from which 90 Gt/yr would be natural (according to IPCC-Huybrechts) and just around 20 Gt/yr that might be human-related. :P Quite elaborated, I must admit it... -
chris at 06:44 AM on 27 November 2009What do the hacked CRU emails tell us?
"unable to adequately simulate".... oh dear...split infinitives now. We just can't take seriously anything you say. -
Riccardo at 05:52 AM on 27 November 2009The physical realities of global warming
HumanityRules, "3) Yet in the measurement of the atmospheric CO2 in ppm for the last 50 years they show a linear rise." you quoted fifty years so i though you were referring to Mauna Loa, the only marine instrumental record i know of going back so far. Anyways, the difference between Mauna Loa and global average are minor. In the report, instead, the graph starts in 1980 and I understand it may appear linear, the shorter the trend the more whatever curve can be approximated by a straight line. But this is not even the case. Instead of eyeballing, plot the data and fit a straight line, you'll notice that the data will be higher than the straight line on the two sides and lower in the middle (you might want to do better and calculate the residual); this means that the trend is not linear. -
Mizimi at 05:40 AM on 27 November 2009What do the hacked CRU emails tell us?
Apologies for my english...perhaps I should have said " unable to adequately simulate" Also of the items I listed 4 are the subject of recent research so it is not unexpoected that they are not included in current models. They do have an impact however; for example, terpene release and subsequent decomposition forms aerosols which increase low level cloud density ( apparently by up to 5%). -
Albatross at 04:55 AM on 27 November 2009East Antarctica is now losing ice
Humanity, "No obvious trends there". I disagree. Now I would have believed your claim had you plotted a linear regression and determined whether not one can reject the null hypothesis that the slope is zero? You have also chosen three locations in a continent the size of the USA. The following shows the big picture: http://earthobservatory.nasa.gov/IOTD/view.php?id=8239 Convinced now? And this is not even from the much debated Steig et al. paper. -
chris at 04:33 AM on 27 November 2009The physical realities of global warming
re #14 Just to add to your post SNRatio: I guess there's a simple physics answer to the point about the rather significant warming consequences (sea level rise, Arctic sea ice and polar ice loss and glacier retreat, precipitation patterns) and the absence of large warming during the last decade: i.e. there actually has been quite a bit of warming during the last decade! Many of the warming consequences are likely the response to persistent high temperatures. That's particularly the case with ice (melt) and sea (rise)-related consequences to warming which have rather long response times. So the single short anomalous spike in the temperature trend in 1998, didn't have strong consequences in terms of ice melt and sea level rise, and it is the fact that the global temperatures are persistently around 0.2 oC warmer globally in the "noughties" compared to the 1990's that's likely responsible for the significant consequences. That ~0.2 oC global average rise is "amplified" over land and additionally "focussed" in the high Northern latitudes, and so it's pretty significant. I guess it's pretty obvious, but it's always worth repeating that the fact that global temperatures haven't signficantly surpassed the 1998 level doesn't mean that the world hasn't warmed significantly.... -
TruthSeeker at 03:03 AM on 27 November 2009The physical realities of global warming
SNRatio, "To me, the _lack_ of a huge temperature rise during the last 10 years, together with the "business even better than usual" changes in the real important parameters, like rainfall, deglaciation and sea level, is what really bothers me: I think this gives strong indications that the 2 oC target may not be acceptable at all." What 2 oC target are you referring to? -
Alexandre at 01:47 AM on 27 November 2009The physical realities of global warming
I´ve never seen here that Science paper with the specific comparision between IPCC projections and observations (maybe I missed it somewhere). Anyway, I´ve been looking for an excuse to post it, so here it is: Rahmstorf et al. 2007 "Recent Climate Observations Compared to Projections"Response: Actually, that paper was covered in Comparing IPCC projections to observations. -
SNRatio at 22:55 PM on 26 November 2009The physical realities of global warming
About the temp record, the people responsible for the graph may be accused of cherry-picking. I don't, but in the present situation, i would never have shown something like that. Other selections give entirely different results. Remember that except for GHG, forcings would have implied cooling the last decade. Here you can look at updated 12month running means (I think that was what I got) of GISTEMP and UAH over a realistic observational period (glossing over any inherent data problems in these time series) And to explore updated trend, look at HADCRUT3, variance-adjusted, with trendline of last 10 years To me, the _lack_ of a huge temperature rise during the last 10 years, together with the "business even better than usual" changes in the real important parameters, like rainfall, deglaciation and sea level, is what really bothers me: I think this gives strong indications that the 2 oC target may not be acceptable at all. -
HumanityRules at 18:46 PM on 26 November 2009East Antarctica is now losing ice
Not sure if anybody is interested in raw data but Australia's BOM has a website were you can get historical raw climate data and plot graphs. It includes three stations in Antarctica. The website is here http://www.bom.gov.au/climate/data/weather-data.shtml I've plotted the annual mean max temps for all three stations Mawson Casey Davis No obvious trends there. -
HumanityRules at 16:41 PM on 26 November 2009The physical realities of global warming
#8 that is the record for Mauna Loa which I see does have an upward curve but the document shows a global average for CO2 in ppm which really does look linear. So when they say in the bullet points that they see an almost threefold acceleration in emissions in the last 18years we shouldn't expect a three fold acceleration in the rate of increase of CO2 in the atmosphere (a little more given the carbon sink issue)? -
dhogaza at 16:39 PM on 26 November 2009The physical realities of global warming
This may not be the right interpretation, but perhaps the IPCC report was most certain regarding temperature response and, when uncertainties were greater the authors tended to forecast toward the lower range of projections.
I think that interpretation is totally reasonable, since the IPCC stuff has to be vetted by every country involved, and there's tremendous pressure to stick to the "what we know almost absolutely" stuff since, despite what denialists claim, government (especially in the US), isn't receptive to the scientific claims. So the less solid the data and the science investigating it, the more likely the IPCC report downplays it. So you see the recent copenhagen climate report put forward by 26 leading climate scientists pointing out how conservative AR4 was ... -
WAG at 13:49 PM on 26 November 2009The physical realities of global warming
Also, I'd add that skeptics have two neat cognitive tricks for dismissing claims that "global warming is happening faster than expected." First, they say, "well this means the models were wrong, so we shouldn't believe them." Second, they say, "well this just proves scientists are altering data to make it sound scarier." It's cognitive dissonance times 1000 -
WAG at 13:46 PM on 26 November 2009The physical realities of global warming
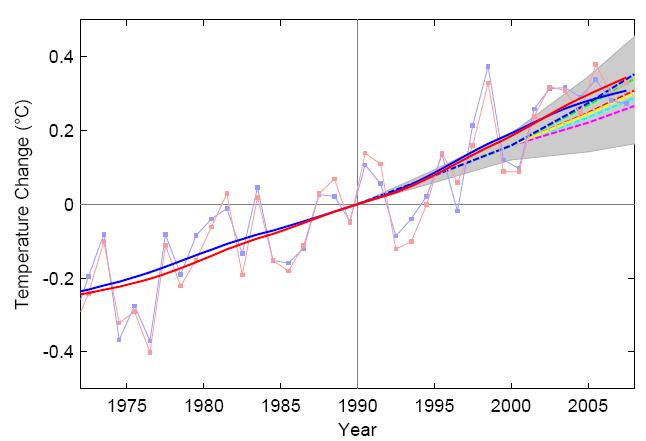
John - You ought to add the temperature graphs from this previous post here. They do a good job of answering the skeptic assertion that "observations don't match models' predictions."Response: Thanks for reminding me of that post. Here's the observed versus modelled temperature (I'll keep it here in the comment as the post above is focused on the Copenhagen Diagnosis report):
Courtesy of Tamino: Solid blue and red lines are trends from GISS and HadCRU data, dashed lines are IPCC projections included in the TAR. -
HumanityRules at 11:55 AM on 26 November 2009East Antarctica is now losing ice
Not sure what you mean about 30%. My understanding for East Antarctic is that there is a positive anomaly in the GRACE data. From Chen and many others this is put down to GIA i.e. the land is rising and depending on how much you believe is occuring this leads to stasis or falling ice mass. The Tregoning paper suggests using GPS data that the positive anomaly can't be put down to GIA therefore it must be due to ice/snow accumulation. It should be noted that the work was done on coastal regions. So one method says stasis followed by ice loss while another says ice gain followed by stasis. I think this does change the picture. I also think it does change a fundamental pillar of the antarctic picture. -
Steve L at 11:38 AM on 26 November 2009Record high temperatures versus record lows
Thanks for that Albatross. I've got a tinyurl for the Kilinc & Beringer paper: http://tinyurl.com/yeqsp5p Unfortunately I won't be able to look at it or the diagnosis any time soon (too many deadlines!). -
Albatross at 10:52 AM on 26 November 2009The physical realities of global warming
SteveL, maybe they "hid" the red trace under the blue line. Seriously though, good point. Perhaps an oversight? This document was not subjected to as intense a review as AR4 ways, for example. PS: I provided a reference for you on the other thread concerning temperature records that you might be interested in. -
Riccardo at 10:49 AM on 26 November 2009The physical realities of global warming
HumanityRules, you are missing that the CO2 concentration trend is not linear. It would be linear only if the emissions were constant. In math words, concentration is the integral of emissions, scaled by the roughly constant factor of the ocean sink. -
Riccardo at 10:31 AM on 26 November 2009East Antarctica is now losing ice
HumanityRules, The old model is wrong? Assume it is, include the new model and recalculate mass balance. What's the effect? Around 30%, fair enough. It does not change the picture, science goes a step further and we're all happy :) What i want to say is that when a single piece of a complex picture turns out to be wrong, unless it is a foundamental pillar we can not conclude that the whole picture is wrong, we need to look at the consequences before coming to conclusions. We've already seen this kind of adjustments many time before, it continuosly happen indeed. -
HumanityRules at 10:06 AM on 26 November 2009The physical realities of global warming
I have a small question about the CO2 section. 1)They show the rate of CO2 emissions have increased since 2003. 2) They also say that the ability of the natural carbon sinks to absorb CO2 has dropped (by 5%) 3) Yet in the measurement of the atmospheric CO2 in ppm for the last 50 years they show a linear rise. If human CO2 is the main source of the increases in atmosphreic CO2 and if the first two points are correct then surely we should see an increasing rate of CO2 accumulation in the atmosphere. What am I missing? -
HumanityRules at 09:56 AM on 26 November 2009East Antarctica is now losing ice
Riccardo It's not just a case of more accurate data. It's that models were developed based on the same best guess assumptions about GIA, a perfectly reasonable thing to do at the time. These models have gone on to inform almost every measurement of antarctic ice loss. Direct GPS measurements have suggested that these assumptions are wrong. Which calls into doubt the accuracy of almost all previous measurements. That is important. I'm still unsure what weight to put on the conclusions from the GPS data. -
Steve L at 09:36 AM on 26 November 2009The physical realities of global warming
I find it interesting that most signs of trouble are advancing faster than expected, but the one metric showing the expected rate of change is global temperature. This may not be the right interpretation, but perhaps the IPCC report was most certain regarding temperature response and, when uncertainties were greater the authors tended to forecast toward the lower range of projections. Another observation: the tide gauge estimate of sea level rise in Fig 3 above stops years ago. The same is true here in the figure from Church 2008: http://www.skepticalscience.com/sea-level-rise.htm Why? Have the tide gauge data not been processed yet? -
wingding at 08:55 AM on 26 November 2009What do the hacked CRU emails tell us?
I have put together two posts analyzing two of the accusations made http://allegationaudit.blogspot.com -
Riccardo at 08:53 AM on 26 November 2009What do the hacked CRU emails tell us?
Mizimi actually switched from "unable to include many known factors that influence climate" to "model inadequacies". Quite a big difference. The only thing partly true is that small scale phenomena are not simulated, but some sort of parametrization is used; which is a trick (intentionally used this word ;) ) to include phenomena at a scale smaller than the grid. -
Nunataq at 08:48 AM on 26 November 2009The physical realities of global warming
dhogaza, Many thanks for that clarification. It is well noted and I will be sure to mention that when linking to the report. -
dhogaza at 08:30 AM on 26 November 2009The physical realities of global warming
Appreciate this summary. Most folks would find the latest IPCC release a bit of a challenge.
Again, for the sake of accuracy, this report is not an official IPCC document, though many of the authors are significant authors of AR4. -
Nunataq at 07:55 AM on 26 November 2009The physical realities of global warming
John Appreciate this summary. Most folks would find the latest IPCC release a bit of a challenge. Great to have a link to help with that. All the best. -
dhogaza at 07:46 AM on 26 November 2009What do the hacked CRU emails tell us?
ENSO events.
Models generate ENSO-like events. -
dhogaza at 07:44 AM on 26 November 2009What do the hacked CRU emails tell us?
They do not explicitly simulate convection, for example.
Actually, Model E does include a cloud convection module that among other things generates anvil-heads that break the troposphere/stratosphere boundary, if I read the documentation correctly (I've not read the underlying paper, which is clearly referenced in the code, though). It's optional, not sure when they use it. Each grid halving requires at least 8x the computing power if nothing else changes, I believe. You get four "boxes" where before there was one, thus that's 4x the amount of computation. Plus the time step must be shrunk by half since propagation times are linear to the grid size. Therefore I get 8x more computation needed. Over time they've also increased the number of layers the atmosphere is sliced into, added more physics, etc so you can see why progress in model resolution etc improves incrementally, not by giant leaps. -
NewYorkJ at 07:35 AM on 26 November 2009The physical realities of global warming
Taking a page out of the recent political event, I have to note it's quite a devious "trick" those scientists pulled in adding satellite observations to the tide gauge data. Such blatant data manipulation! Ari, Skeptics tell us Arctic sea ice is growing (starting in 2007 of course). Models and alarmists are wrong again. That graph above, therefore, is propaganda. -
Albatross at 06:44 AM on 26 November 2009What do the hacked CRU emails tell us?
Mizimi, he/she asked you to list the known factors that the models do not include. Your list is a mish-mash of what they are not particularly good at simulating, mostly b/c of grid spacing issues. The latest AOGCMs include atmospheric chemistry, and the grid spacings are closer to one degree lat/lon. They do include/reproduce clouds, aerosols, internal climate modes, WV, ET etc etc. Read Chapter 8 in AR4. They do not explicitly simulate convection, for example. Anyhow, what the heck has this to do with the CRU email hack? -
Ari Jokimäki at 05:54 AM on 26 November 2009The physical realities of global warming
Climate skeptics usually make a big deal about how bad IPCC-models are, but for some reason the situation with Arctic sea ice extent doesn't seem to be interesting to them, and yet there seems to be a real gap between the models and the observations. Strange. -
Mizimi at 05:21 AM on 26 November 2009What do the hacked CRU emails tell us?
# 76: dhogaza...model inadequacies: Cloud and subsequent albedo Aerosols ( not just ours but plant aerosols..terpenes) ENSO events. Alterations to WV distribution patterns caused by land use changes & deforestation. Rate of evaporation/precipitation in tropical zones. Relationship between wind & evaporation over oceans ( wind is affected by SST and SST is affected by wind speed) Current models work in pretty large cells where it is not possible to do anything more than generalise.. a good example of thjis is oceanic circulation; compare a satellite pic of circ patterns and then overlay a 200km cell and see what the models miss. -
Albatross at 05:13 AM on 26 November 2009What do the hacked CRU emails tell us?
Re #97. Thanks dhogaza, I was worried I had not referenced the diagnosis correctly. "Truthseeker" re #92, read the Copenhagen Diagnosis, especially the grey box on page 15. That said, as SNRatio noted, the data and facts are there, but are your willing to be open minded and unbiased enough to embrace them? Liberally cut and pasting text from other sources without any associated discussion or context is not citing evidence "Truthseeker", nor is it constructive. That said, NeilP does seem to be now engaging people, so that is a start. -
dhogaza at 02:20 AM on 26 November 2009What do the hacked CRU emails tell us?
thats fine for you, but when I see someone talk out of both sides of their mouth, they have a credibility issues with me. I am sorry that you bias lets you forgive the discrepancy when it is convenient for you.
He links to his relevant paper right in the e-mail you claim you understand better than he himself. Go read the paper, if you don't, you have no idea as to the context of the argument he's making in his e-mail. -
dhogaza at 02:19 AM on 26 November 2009What do the hacked CRU emails tell us?
On Tuesday the IPCC released an update to the AR4 for Copenhagen. You can view and/or download the file at: http://www.copenhagendiagnosis.com/
Just for clarification, this isn't an IPCC update to AR4, but rather an effort by a couple of dozen researchers working on their own. As it happens, many are lead IPCC chapter authors, etc, but it's not IPCC-vetted. Which, if denialists are to be consistent, gives it *more* credibility than AR4, right, since IPCC is just an anti-science political body? :) -
Tom Dayton at 00:48 AM on 26 November 2009Water vapor is the most powerful greenhouse gas
John, the embedded video is just a blank box for me. But I'm using Firefox on a Mac; maybe it's platform-specific.Response: Hmm, I see a blank box in Firefox on the PC but it works fine in Internet Explorer. Any YouTube boffins have any solution to this conundrum? -
SNRatio at 00:21 AM on 26 November 2009East Antarctica is now losing ice
More about not acting when there is uncertainty. That's a completely flawed notion for risk management. To make rational choices for each alternative, you have to integrate the cost-benefit function over the stipulated pdf for the outcome, to get the expected cost of that alternative. Then, there may be enough with a relatively small probability of a very expensive outcome of an alternative to have reason to discard it as policy. So we may find some "alternatives" are not really options, after all. If you don't base decisions on such principles, you're not rational. Humanity has a long and sad record of acting non-rationally. Just to use the present situation as an example: If the present levels of radiative forcing are already enough to cause global deglaciation over time, we may already have blown it. The accelerating ice loss of Greenland and the Antarctica indicates that we now can't set the probability of that to zero. We don't know the costs, they're very much dependent on how fast it happens, but in any case, they will be huge over time. Could we have known this in advance? No. Does that lack of knowledge entitle us to set the probability of it happening at present forcing levels to zero? Absolutely no, as is evidenced by this post. -
Kevin Eady at 00:00 AM on 26 November 2009Humans are too insignificant to affect global climate
I’ve always been puzzled as to why people think humans are too puny to have any effect on the planet. Far smaller organisms than us have had a significant impact. Just look at the Great Barrier Reef, the White Cliffs of Dover or the Peak District. None of these would be present, or would be substantially different, if the results of the blind unthinking actions of primitive creatures had not accumulated over long periods of time. Neither would we be breathing an oxygen-rich atmosphere were it not for the photosynthetic activity of plants over millions of years. OK, none of this was deliberate or short-term, but it shows that really insignificant life forms can have an impact on the planet. As for humans, we can and have created deserts, made semi-desert more arid and the like by over-grazing of livestock, over-intensification of non-sustainable agricultural practices and deforestation. None of this is necessarily irrecoverable in the long term, given the will, the power and the knowledge of how to undo the damage, but our impact on so much of the biosphere is indisputable. Of itself this does not prove global warming, but it does invalidate any assertions that we are too unimportant to have any effect -
SNRatio at 23:43 PM on 25 November 2009High CO2 in the past, Part 2
@DrMike I really appreciate your questioning of all assumptions - that's important part of what good science is about. Somewhat on a tangent, I would like to comment on the principle of "early falsification", i.e. an apparent lack of fit between theory and data, in a situation where either theory or data, or both, is not very comprehensive. It may make good tactics, but bad strategy. Imagine a "data-driven" response to Copernicus: "You maintain those planets move in circles, but the data clearly shows they don't! That simplistic circular hypothesis could make a good heuristic, but to get at the real science, you have to resort on the computation machinery dating back to Apollonius, which describes this with as much precision as you like. If it doesn't fit, you must aquit!" Which is, factually, quite correct. But enter Kepler and Newton. For may of us, it's not about believing in it. We would rather be thrilled at getting better theories. To work with, that's what it's about. Working. -
SNRatio at 21:54 PM on 25 November 2009What do the hacked CRU emails tell us?
"billbrent Really apologize for mixing part of your post with another's. Scrolling up&down error. As for Trenberth, I think chris has explained things pretty well. I think you may think of this as "understanding the physics" of first and second order approximations: The first order terms, most relevant for the public warming debate, are in place reasonably well, but higher order needs more involved analysis of details. And phenomena like small systematic variations in the cloud albedo may have "huge" effects in this more detailed analysis. Lindzen&Choi's paper may turn out to have the opposite effect of what you think. You should check out Roy Spencer's comments on it on Watts Up With That, if you don't think that site is too biased towards warmism, then. You might also download and go through Lindzen's presentation "A deconstruction of global warming". That was really a deconstruction for me. But not of global warming. About "acceptable" temperature increases: I think the present rise is enough already to be of great concern, and a 1 degree rise could have huge negative impact. It very much depends on how variability develops.. With very small variability, 1 deg could be much more acceptable than with high variability. -
Riccardo at 20:23 PM on 25 November 2009What do the hacked CRU emails tell us?
TruthSeeker, "So why don't we exclude all the tree ring data, since its be proven to be faulty?" Never this proof appeared, not even in the "secret conspiracy emails"; on the contrary, they still prove usefull for temperature reconstructions. Instead, some trees in some sites are known (no breaking news here) to show a (relatively) recent divergence problem. And here comes the shouting on the hidden data ... "IF this is true, it would change my view from a skeptic to a believer." The data are there, the anticipated effects of warming too; you are free to distrust them if you're happy with this. I'm sure we'll not see you change your "view from a skeptic to a believer" any soon ;)
Prev 2546 2547 2548 2549 2550 2551 2552 2553 2554 2555 2556 2557 2558 2559 2560 2561 Next


