


 Arguments


Recent Comments
Prev 303 304 305 306 307 308 309 310 311 312 313 314 315 316 317 318 Next
Comments 15501 to 15550:
-
nigelj at 06:58 AM on 2 February 2018It's not okay how clueless Donald Trump is about climate change
Well said. Trump is just clearly totally scientifically ignorant, and you can probably add in some deliberate stupidity. He doesnt like carbon taxes, and renewable energy etc so he attacks the science.
He is excessively prioritising corporate values above the environment and public good. This is clear in everything he has done since being in office legislatively, so his words claiming otherwise are fake words.
Clearly Trump doesn't like multi party agreements. He is used to negotiating two party property deals, and multi party agreements are foreign to him. It's not so easy for him to dominate and manipulate people in multi party agreements.
Trump has pulled out of the TPPA, which is a multi party trade agreement. America was dominating this agreement and getting the best deal, so his move makes little sense. However Trump has opposed free trade for a long time, despite the fact nearly all economists promote free trade.
Trump also obviously hates and resents Obama. This appears almost pathological.
America is lost, and it's people mostly don't seem to care anymore what made up nonsense their politicians talk.
-
nigelj at 05:50 AM on 2 February 2018Is warming in the Arctic behind this year's crazy winter weather?
Alchemyst @2
"Quoting the acticle it states that "losing half the arctic sea ice cover in 30 years". Following the reference the original acticle in Review of Geophysics, by WM Meier et states "Over the past few decades, summer areal density has declined over 30%.....Exagerated claims dscredit the site. "
Perhaps the writer added the 30% decline in sea ice area to the 40% decline in thickness to say the arctic has lost half the sea ice 'cover' in 30 years. Just a guess on my part.
-
william5331 at 05:35 AM on 2 February 2018Is warming in the Arctic behind this year's crazy winter weather?
It is reasonably likely that this is a transition phase. When the Polar Hadley cell finally reverses for longer and longer periods, we should see climate zones rapidly move northward and all of Northern America warm considerably. Right now, Polar air can make it's way south as the Polar Hadley cell weakens and is no longer confining Arctic air to the Arctic but this should change as the sea is more and more open water. At least there is one positive in all this. As heat is drawn northward, just possibly enough heat will be removed from southern waters to save our coral reefs. Not much of a comfort if the Northern Hemisphere grain belts are destroyed.
-
Alchemyst at 04:45 AM on 2 February 2018Is warming in the Arctic behind this year's crazy winter weather?
Quoting the acticle it states that "losing half the arctic sea ice cover in 30 years". Following the reference the original acticle in Review of Geophysics, by WM Meier et states "Over the past few decades, summer areal density has declined over 30%.
So going to the Arctic sea ic website from the university of colorado we get in their oct 2017 bulletin "The linear rate of sea ice decline for September is .....13.2% per decade.
Now the greatest decline is found in the summer, but this auhor seems to have increased his by 10 or 20 % and not mentioned that the winter decline is much less about 15% over 30 years.
Exagerated claims dscredit the site.
could someone please explain this disepancy or is it due to inflation and projection?
-
One Planet Only Forever at 04:36 AM on 2 February 2018In 2017, the oceans were by far the hottest ever recorded
swampfoxh@10,
A Top 5 (or Top 10, or Top anything) list should never be presented in 1,3,2,4,5 order.
-
swampfoxh at 04:13 AM on 2 February 2018In 2017, the oceans were by far the hottest ever recorded
Thegraph slows a slight reduction in heat in year 2016. Just below that we see the "top five" listed by joules. At first glance it looks like a steady upward trend until one notices the years 2015 & 2016 are "flipped".
My choice would have been to list the top five in year to year sequence so "first glance" would not have given the impression that its up, up, up, up up
Some of you are probably thinking "swampfox doesn't have anything to do today" and I probably don't.
Regards.
-
scaddenp at 13:11 PM on 1 February 2018In 2017, the oceans were by far the hottest ever recorded
I havent done the calculation, but I believe the diagnotic from OHC is that ERB is 0.8w/m. Incognitoto seems to believe it should same as change in delta-F.
-
Eclectic at 11:52 AM on 1 February 2018In 2017, the oceans were by far the hottest ever recorded
Sidd @6 , I haven't checked the calculation figures offered by RealClimate poster "Incognitoto" — but I am not sure where you see a problem.
Effective radiative forcing has increased from 1 watt/sq.m. at approximate date 1975, up to 2 watts/sq.m. by 30 years later.
Was poster "Incognitoto" referring to Ocean Heat Content in the surface 700m of the ocean, or in the surface 2000m [as mentioned in this particular SkS article, or in the total ocean?
And was he allowing for the temporary reductions (in radiative forcings) caused by major volcanic eruptions?
All in all, there seems no reason to doubt that "over 90% of radiative imbalance" is going into the oceans.
-
scaddenp at 11:04 AM on 1 February 2018In 2017, the oceans were by far the hottest ever recorded
I may have misunderstood the question, but there seems to be some confusion in the maths over change in forcing versus change in ERB. As earth has got hotter, much of that 500TW is going irradiated again. The non-zero ERB is because oceans are burying heat.
-
sidd at 09:26 AM on 1 February 2018In 2017, the oceans were by far the hottest ever recorded
Over at realclimate, there was a question posed: Over 90% of radiative imbalance is supposed to go in the oceans. But OHC increase is considerably smaller. So where is the heat going ?http://www.realclimate.org/index.php/archives/2018/01/the-claim-of-reduced-uncertainty-for-equilibrium-climate-sensitivity-is-premature/#comment-690005
Anyone care to comment ?
sidd
-
One Planet Only Forever at 04:05 AM on 1 February 2018Is warming in the Arctic behind this year's crazy winter weather?
Increased awareness and better understanding can occur. Some people are willing to change their minds for Good reason.
However, anyone who already believes that global average surface temperature warming by 2 degrees C means the end of cold weather (many claim this) is unlikely to be willing to understand that global warming can produce more frequent cold events that are not quite as cold as, and may be snowier than, the less frequent cold events used to be.
The power of Private Interest in personal benefit can develop some very persistent damaging beliefs (like the belief that the popular and profitable burning of fossil fuels cannot possibly be unsustainable or harmful because, as those Economic Masters of Misunderstanding would declare, "if it was actually harmful or unsustainable it couldn't be popular or profitable").
-
Bob Loblaw at 12:19 PM on 31 January 2018They changed the name from 'global warming' to 'climate change'
John: your link at #26 just points back to skepticalscience.com.
Moderator Response:[JH] Glitch fixed. Thank you for bringing it to my attention.
-
John Hartz at 11:54 AM on 31 January 2018Ocean acidification isn't serious
Recommended supplemental reading:
Scientists Pinpoint How Ocean Acidification Weakens Coral Skeletons, News Release, Woods Hole Oceanographic Institute, Jan 29, 2018
-
One Planet Only Forever at 09:45 AM on 31 January 2018New research, January 15-21, 2018
John S@3,
Burning wood does not increase the carbon in the recycling surface environment the way that burning fossil fuels does. However, all results of the entire activity needs to be included in the evaluation. That would include the other pollution created when wood is burned. It would also include any pollution related to the building and production of competing renewable energy systems.
Other considerations would include the impacts of deforestation or impacts of renewable enegry systems on other life in the diverse web of life that humans have to sustainably fit in to in order to have a future.
Another consideraton regarding biomass is if it displaces food production. Using inedible vegitation from food production would be positive. Displacing food production to 'make energy' would be a negative.
Not sure where wood burning or biomass would end up in a comprehensive evaluation of true sustainability. It would probably be the winner in many locations.
The more important point is that evaluating the true sustainability of any human activity must be the basis for allowing it to be considered to be an acceptable participant in the games of competion to win popularity and profitability.
The failure to restrict what is allowed to compete for profitability and profitability undeniably leads to unsustainable and damaging activity Winning because of the 'competitive advantage of the cheaper and easier ways that can be gotten away with'.
Admittedly the current challenge is that people peceiving themselves to be the biggest Winners understand that they have the most to lose if what has incorrectly developed actually gets corrected. The faster the correction the more they lose. And of course those undeserving Winners stand to win more by fighting against any correction occurring in their wealth-pursuing lifetime that negatively affects their wealth-pursing opportunities.
-
John Hartz at 02:24 AM on 31 January 2018They changed the name from 'global warming' to 'climate change'
Recommended supplemental reading:
Debunking the claim ‘they’ changed ‘global warming’ to ‘climate change’ because warming stopped by Jason Samenow, Capital Weather Gang, Washington Post, Jan 29, 2018
-
Ogemaniac at 23:14 PM on 30 January 20182018 SkS Weekly Climate Change & Global Warming Digest #4
Few people that support Trump can adequately explain global warming, even the basics. Just hand one you know in real life a sheet of paper with a semi-circular "sun" on the left and "Earth" on the right, and watch them utterly flounder to explain even the least of the basic ideas underlying the theory.
-
nigelj at 04:43 AM on 30 January 20182018 SkS Weekly Climate Change & Global Warming Digest #4
The power of marketing. Facebook designed to be addictive:
adage.com/article/digital/sean-parker-worries-facebook-rotting-children-s-brains/311238/
Phones, cars, and high carbon consumption all the same. Designed and marketed to be addictive.
-
MA Rodger at 01:52 AM on 30 January 2018Plant stomata show higher and more variable CO2 levels
qwertie @12,
Middleton's five-point graph simply mis-places the averaged point by plotting them against the date of the last of the five measurements. So his final five-point average is 334ppm plotted against 1988 when it should be plotted against 1927 when the ice core measurements suggest it would have been just topping 300ppm.
The stomata data comes from Kouwenberg et al (2005) who plot 3-point averages (& the final 1988 plot as a singleton) with single-point confidence intervals +/-40ppm, as shown in Fig 4.4 in this PDF.
-
One Planet Only Forever at 01:42 AM on 30 January 20182018 SkS Weekly Climate Change & Global Warming Digest #4
The likes of Trump are reacting to the environment they developed in. Their unjustifiable attitudes and actions are encouraged to develop in competition to 'appear to be superior to others - any way that can be gotten away with'.
Popularity and profitability are lousy measures of acceptability.
The reality is that there are many people with over-developed and unsustainable perceptions of superiority, prosperity and opportunity. They are the reason that serious action to correct the direction of economic development did not occur when the unsustainable and damaging reality of the unanatural economic developments was identified decades ago.
Humanity's only path to a sustainable future requires low-tolerance for people who are Big Winners to deliberately be incorrectly aware or misunderstand important understandings. Those types of undeserving winners need to be Losers until they 'Learn to Care to Change Their Minds'.
This is not Rocket Science. Any business that would allow its Leaders to be incorrectly aware or misunderstand what is actually going on has no real future. Any perception of Winning those types of Winners/Leaders develop will never last. Unfortunately they can do a lot of damage if their removal from influence is delayed by Successful Poor Excuses (Good Reason would remove them from their Winning - only Poor Excuses can support them as Winners).
The early thinkers about free market capitalism who were concerned about the potential for marketing to distort things and develop damaging results were clearly correct (many early thoughts in England were that advertising should be restricted to the inside of the shop that was selling an item or service - no mass-marketing allowed).
-
DPiepgrass at 12:06 PM on 29 January 2018Plant stomata show higher and more variable CO2 levels
Sorry for having the wrong image width - I noticed the problem as soon as I posted it but there is no edit button on comments. As I've proposed before, you can fix image widths automatically with CSS like `#comments img { max-width:99%; }` or suchlike. If I understand correctly, this rebuttal is about a graph by Indermühle et al, research by Wagner et al, and an interpretation of Wagner's data by Middleton. The link under 'climate myth' points to an article by Middleton with numerous graphs, one of which is the one I reposted.
-
DPiepgrass at 11:22 AM on 29 January 2018Plant stomata show higher and more variable CO2 levels
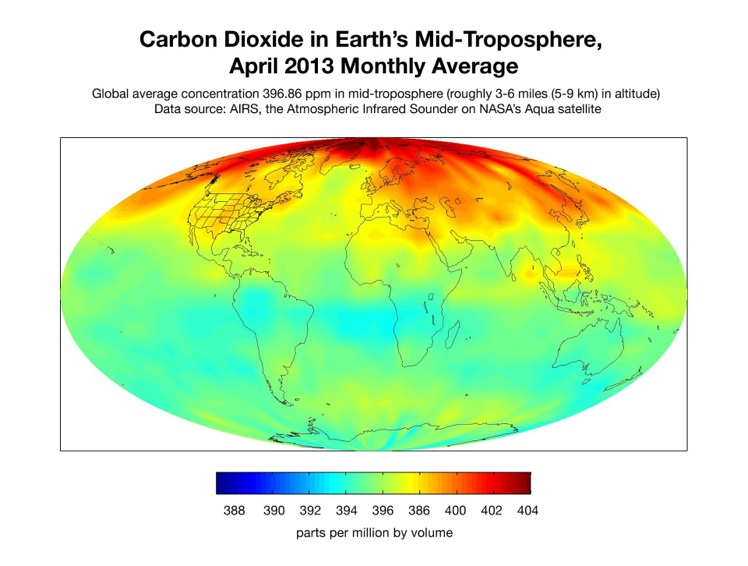
So Middleton would like his followers to trust a source that says CO2 was at about 373ppm in 1960, whereas direct measurements of the atmosphere say it was about 315 ppm, while 21st century satellite pictures (AIRS) show only 10-20ppm variation across the globe.
It's tempting to quibble with his other claims and insinuations... for example "show me an AIRS image that shows the polar regions to have higher CO2 levels than the mid and low latitudes" - look, humans emit most of their CO2 from the northern hemisphere so it can takes a few months for it to reach Antarctica. This is very clear by watching an AIRS time-lapse video, where anyone can see what's going on. Weather patterns do occasionally cause mid land low lattitudes to have roughly the same CO2 as Antarctica, though. Clearly AIRS does not justify the position that Antarctica had lower CO2 before humans came along! But no matter how much we quibble with Middleton, people that want to believe that "nature" quickly raises and lowers CO2 "at will", without human influence, will take his word as gospel.
-
DPiepgrass at 10:15 AM on 29 January 2018Plant stomata show higher and more variable CO2 levels
The image in this rebuttal is broken (embedding an image from another web site is a dangerous thing to do). I think the image was supposed to be this one:

Legend: Taylor Dome (⋄), Vostok (□); top: Stomata
"This figure shows that Wagner's data shows a sharp increase to 330ppm at 11,260 years BP (years before 1950), staying there for 500 years, in disagreement with the Taylor Dome and Vostok ice-core records." Keep in mind that time flows leftward on this graph.
It should also be noted that Taylor Dome is not the highest-resolution ice core record available, and that Middleton himself published this graph showing Stomata disagreeing with direct measurements of atmospheric CO2 and high-resolution ice cores in the 20th century:
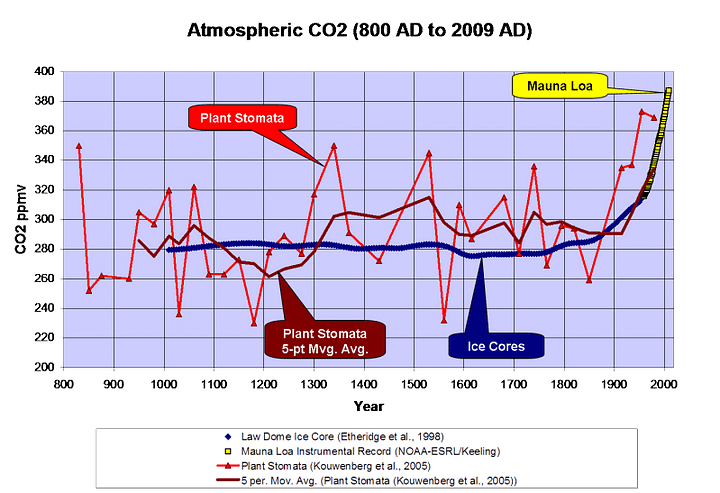
(His 5-point moving average, by the way - the final point doesn't make any sense because you need 5 points to create a 5-point moving average, so which 5 points is the final point based on? Also, it's much lower resolution than the ice cores, and it's not a consistent time unit since the spacing of the red triangles is uneven.)
Moderator Response:[DB] Please limit image widths to 450 to avoid breaking page formatting. Thanks!
[PS] Middleton's "published" graph (linked under climate myth at top of the article) is what this rebuttal is about.
-
David Kirtley at 08:54 AM on 29 January 2018From the eMail Bag: A Deep Dive Into Polar Ice Cores
Great comments/questions, qwertie. You said: "not a single climate scientist, including any of the contrarians (the 3%), has thought of any way that CO2 could disappear from the atmosphere as quickly as it has been added."
Exactly. Which is what Dr. Buizert was saying. A sudden spike in CO2 would leave a mark in the record because everything we know about the carbon cycle tells us that the spike wouldn't "quickly disappear". Also, a sudden CO2 spike would have other effects on the ice core records: they would show a spike in temperatures which are also measured in the ice cores.
Your skeptic, in your example, wants to just look at the ice core CO2 measurements in isolation, without taking into account what is known about the carbon cycle.
You said: "Unfortunately this article isn't clear enough to draw such a conclusion. One way it would be more clear is if it gave at least one example to demonstrate how to calculate the gas age distribution."
Finding the "age distribution" isn't a very straight-forward process. This is all rather complicated stuff and I confess not to have a complete grip on all of it...especially all of the math involved. But conceptually I think I understand it (mostly). I'll try to explain it, but you may want to check the papers yourself. I would suggest these (you can find the links to them above in my list of refs.): Etheridge et al. 1996, Trudinger et al. 1997, Marcott et al. 2014. Also this one not listed: Buizert et al 2015.
When I was corresponding with Dr. Buizert I asked him where I could find age distributions for the various ice cores. He said that they are better known for firn air but not for the older air trapped deeper and deeper in the ice core bubbles. However the Delta-ages of ice cores are easier to find (see Figure 6 in OP), hence his "short-cut" for finding the age distributions: Δ-age x 5% = age dist.
Here is how these various things are related:
ice age - gas age = Δ-age
"Ice age" is easy to find, it can be found simpy by counting the layers in the ice core, like counting tree rings. And it is possible to tie this count into our calendar years by noting specific points in the core, like a layer of volcanic ash from an especially large and known volcanic eruption.
For the "gas age", we know that the air in bubbles is younger than the surrounding ice (described in the OP). But how much younger? Well that depends on the conditions (amount of snow accumulation and temperature) at the ice core location, and how long it takes for the bubbles to get "locked in" through the lock in zone. So to find the "gas age" scientists work backwards from the equation above, they start by calculating the Δ-age.
They find the Δ-age by using mathematical models using the specific firn conditions of the ice core location. With the modelled Δ-age and the known ice age, they can then use the equation to find the gas age. Here is an example of this technique, as described in the Marcott et al. 2014 paper from my ref. list:
"Gas ages were obtained by subtracting a modelled ice-age/gas-age difference (Δ-age) from the ice-age timescale. Δ-age was calculated using a dynamical firn-densification model with heat diffusion. The modelling is constrained by measurements of δ15N of N2, a proxy for past firn column thickness."
Let's say, for example, that our firn model gave us a Δ-age for the Law Dome ice core of 30 years. That means there would be a 30 year difference between the ice age and the gas age. Look at Figure 4 of the firn cross-section. The 30 year Δ-age is basically the time it takes for the top snow layer to get buried and eventually reach the close-off depth. At that depth any air in the ice is locked into bubbles and is closed off from further contact with the air in the firn above which is open to the atmosphere.
Back to Law Dome, a 30 year Δ-age is the actual value found in Etheridge et al. 1996. Here is a table from that paper:
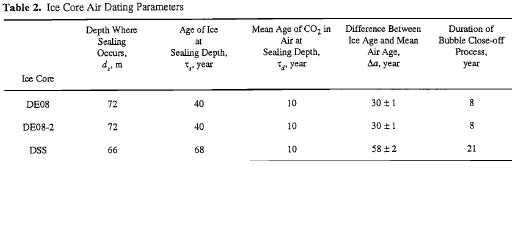 Notice the last column: "Duration of Bubble Close-off Process". This is another way of describing the "age distribution" of the gas within the bubbles. Look again at Figure 4 of the firn cross-section. The bubble close-off process takes place in the "lock in zone". The length of time it takes for the air to become finally trapped in bubbles in the lock in zone defines the "age distribution". This is different for every ice core location, again, depending on snow accumulation, temperature, firn density, etc.
The time in the lock-in zone is roughly 10% of the time span given by the Δ-age. (But, again, this rough approximation would be different for each different ice core location.) So yes, the age distribution of the gas is directly related to the Δ-age. Hence, the quote from the Mitchell paper:
"The bubbles are known to close off over a vertical ice age range [the Lock-in Zone] that corresponds to roughly 10% of the gas age-ice age difference, which intuitively should result in a gas age distribution width corresponding to 10% of the gas age-ice age difference [the Δ-age]. However, the observed smoothing of the trapped gas record often appears to be less than would be expected from this rate of gradual bubble closure."
And my further comment: "So rather than 10%, a good rule-of-thumb, according to Dr. Christo Buizert, is to take 5% of the Δ-age to find the age distribution."
Back to Law Dome, again. Ten percent of the 30 year Δ-age would give an age distribution of only 3 years, not the 8-15 years I alluded to from Figure 5. Well, like I said, these are rough approximations.
The main point is to simply realize that the date of the CO2 in ice core bubbles cannot be pinpointed to a single year in the past. There is an age distribution or range of years that the gas is dated to. It may be very difficult to determine the exact width of a given ice core's age distribution, i.e. the span of years in the distribution, but we can get in the right ballpark.
Moderator Response:[DB] Please limit image widths to 450 to avoid breaking page formatting. Thanks!
-
nigelj at 05:49 AM on 29 January 20182018 SkS Weekly Climate Change & Global Warming Digest #4
"After proclaiming his belief in “clean air and clean water”, the US President questioned some of the central tenets of climate science in an interview with Piers Morgan."
Despite this, Trump has begun dismantling Obama’s clean water rules. The contradictory, two faced nonsense he speaks is just incredible.
www.vox.com/energy-and-environment/2017/2/28/14761236/wotus-waters-united-states-rule-trump
"The ice caps were going to melt, they were going to be gone by now, but now they're setting records. They're at a record level."
Some people like Trump have great difficulty separating out short term climate noise, for example a one year 'recovery' in ice levels, from longer term trends of declining ice cover. I dont know why, and with Trump he just seems to take simple statements on face value if he likes the person delivering the message. Or perhaps some people just have trouble differentiating between short and long term trends, and I'm becoming increasingly convinced of this.
Or perhaps some people resent carbon taxes and government rules, and lifestyle changes, so deny the science, possibly without even realising they are doing this.
I havent really seen any investigation claiming a single reason stated for the climate denial, and it may just be a combination of these things.
There are of course much blunter ways of putting all this.
-
nigelj at 06:45 AM on 28 January 2018In 2017, the oceans were by far the hottest ever recorded
New Zealand currently has a heatwave, due to a combination of warm oceans, la nina conditions, and a stalled jet stream that is keeping colder southern air away, while northerly tropical air flows down. We have set a record for the hottest January in history.
I bought one of those Dyson fans (actually a fan heater, so I can use it in winter as well). I recommend this device. It's expensive, but has a very powerful fan with a focused stream of air, and a quiet fan.
-
nigelj at 06:03 AM on 28 January 20182018 SkS Weekly Climate Change & Global Warming News Roundup #4
Climate change is making the planets climate more tropical. The tropics have more diseases. Warmer climates have more biodiversity, so more animals and bugs, and warmer climates are ideal for laying eggs.
Some basic form of universal healthcare makes sense. Because nobody in their right mind wants to see desperate sick people unable to afford even basic healthcare, and a healthy workforce benefits employers as well.
Government have a fundamental role in environmental protection, because free markets don't look after the environment, because of the tragedy of the commons problem.
But not everyone thinks that way. This is because not everyone thinks.
-
michael sweet at 03:11 AM on 28 January 2018Sea level rise is exaggerated
FFGeorge,
The ENVISAT satalite has been shut down since April 2012. How can you possibly suggest that it has more accurate data for the period 2010-2017 when it has not collected data for most of that time? The video you linked is unreliable.
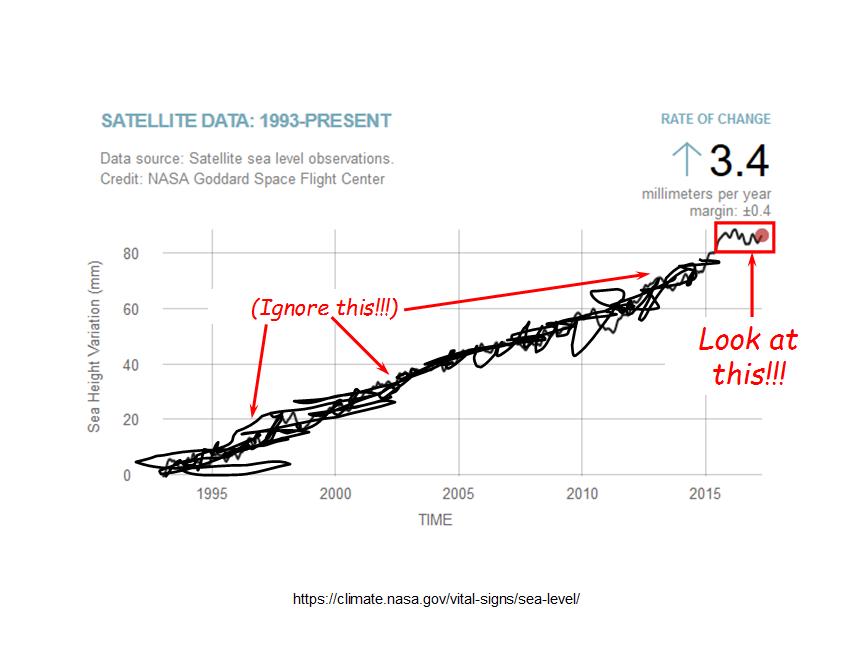
You are choosing a time period that is too short to measure the sea level rise. You are focusing on the noise and not the signal.
Find a reliable source of information. Read Tamino.
-
michael sweet at 03:01 AM on 28 January 2018Sea level rise is exaggerated
George,
I noticed that you did not link the graph for La Jolla. Here it is. Long term trend 2.17 mm/yr, not no sea level rise. Read some of Tamino's stuf and you will be better able to determine if there is a trend from a graph.
-
michael sweet at 02:55 AM on 28 January 2018Sea level rise is exaggerated
George,
Manhattan is a very noisy record. There are many short periods where it appears to not rise while the long term (actual) trend is increasing. Since land elevation is a long term issue that would primarily afect the long term trend and not the noise. Tamino has a lot of sea level analysis where he explains the statistics.
The noise is affected by the weather and by issues like El Nino/La Nina. Longer term processes like the Arctic ocellation would also affect the noise.
-
GeorgeLet at 01:29 AM on 28 January 2018Sea level rise is exaggerated
https://www.youtube.com/watch?v=EhW-B2udhQw
7:00 no sea level rise in La Jolla, CA
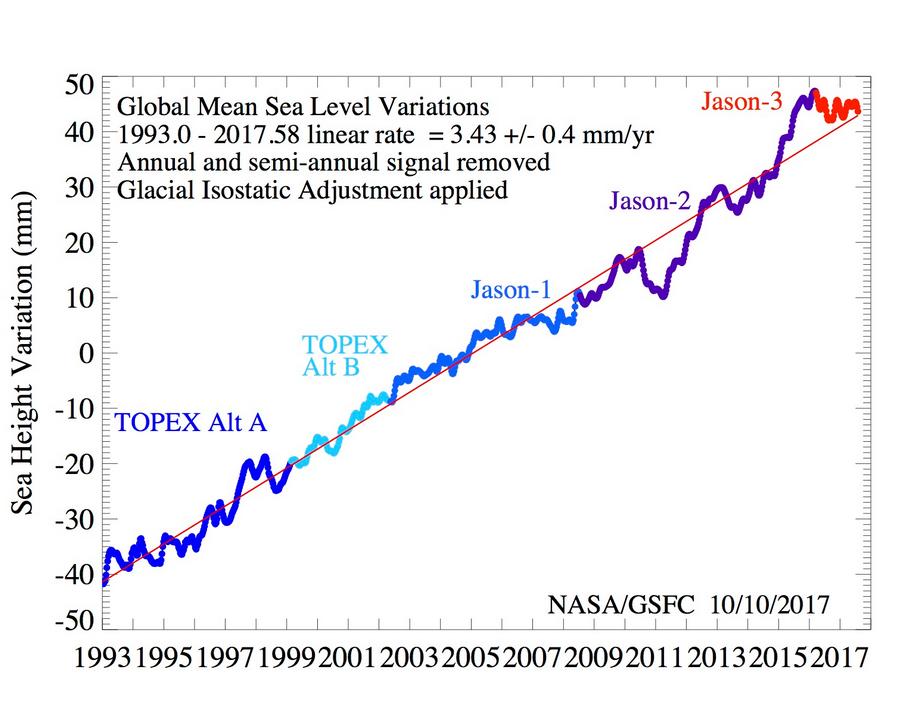
12:00 Topex/Poseidon Satellite measurements are crude
12:43 ENVISAT, European satellite with higher resolution, much lower sea level rise, decrease since 2010How do you explain Manhattan? Has the land elevated there?
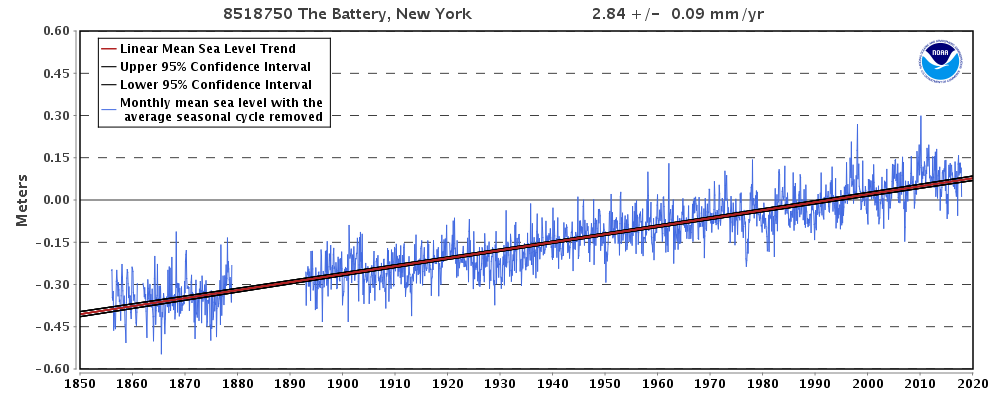
https://tidesandcurrents.noaa.gov/sltrends/sltrends_station.shtml?stnid=8518750
Moderator Response:[Rob P] - Not surprisingly, sea level at New York has risen over the long-term. In the short-term, fluctuations in the ocean circulation are having an effect. Now that ice mass loss from the Greenland ice sheet is fully underway it will be interesting to see how that alters sea level rise along the North American east coast. There's a recent paper on the subject here: Causes of accelerating sea level on the East Coast of North America (Davis & Vinogradova [2017])
-
jef12506 at 01:15 AM on 28 January 2018In 2017, the oceans were by far the hottest ever recorded
Thanks Glen - I do get it. I just hate reading "The fact that 2017 was the oceans’ hottest year doesn’t prove humans are warming the planet."
Maybe it should have read "The fact that 2017 was the oceans’ hottest year BY ITSELF doesn’t prove humans are warming the planet." or something.
-
michael sweet at 00:47 AM on 28 January 2018Sea level rise is exaggerated
George,
Your first link (I cannot get the graph to copy here) is from Monterey Bay. While it has a lower long range trend, the trend from 2010-present is very high, the opposite of your claim. Your second graph, from Nantucket, shows a high long range trend but lower from 2010-present. You must konw that individual locations have high noise and also land height change issues. If that is the best you can find in the entire USA that indicates that sea level is rising rapidly.
If you get some guages from Alaska they will actually show a long term decrease in sea level since there is strong isostatic lift (increase in land height) due to the melting of the glaciers from the ice age. That does not mean the sea level is not rising, just that the land is rising faster.
-
GeorgeLet at 23:55 PM on 27 January 2018Sea level rise is exaggerated
Here are a couple more around the U.S.
https://tidesandcurrents.noaa.gov/sltrends/sltrends_station.shtml?stnid=9413450
https://tidesandcurrents.noaa.gov/sltrends/sltrends_station.shtml?stnid=8449130There is certainly no acceleration in sea level rise and in fact a drop in sea level since 2010.
My belief is that there has been additional snow and ice buildup causing the drop in sea level."Cherry Pick since 2010"? Eight years of opposing data is not enough to make you question your hypothesis?
Moderator Response:[DB] Multiple comments using the same failed rhetoric are unhelpful. The facts are, global sea levels have risen since 2010. Attempting to find a few areas where sea levels show different results is like using the existence of smaller waves at the oceanside following larger ones in an attempt to show that the tide has somehow stopped coming in. It's a fallacy.
We also know which of the components of SLR contribute to it most (mass increases vs thermal expansion):
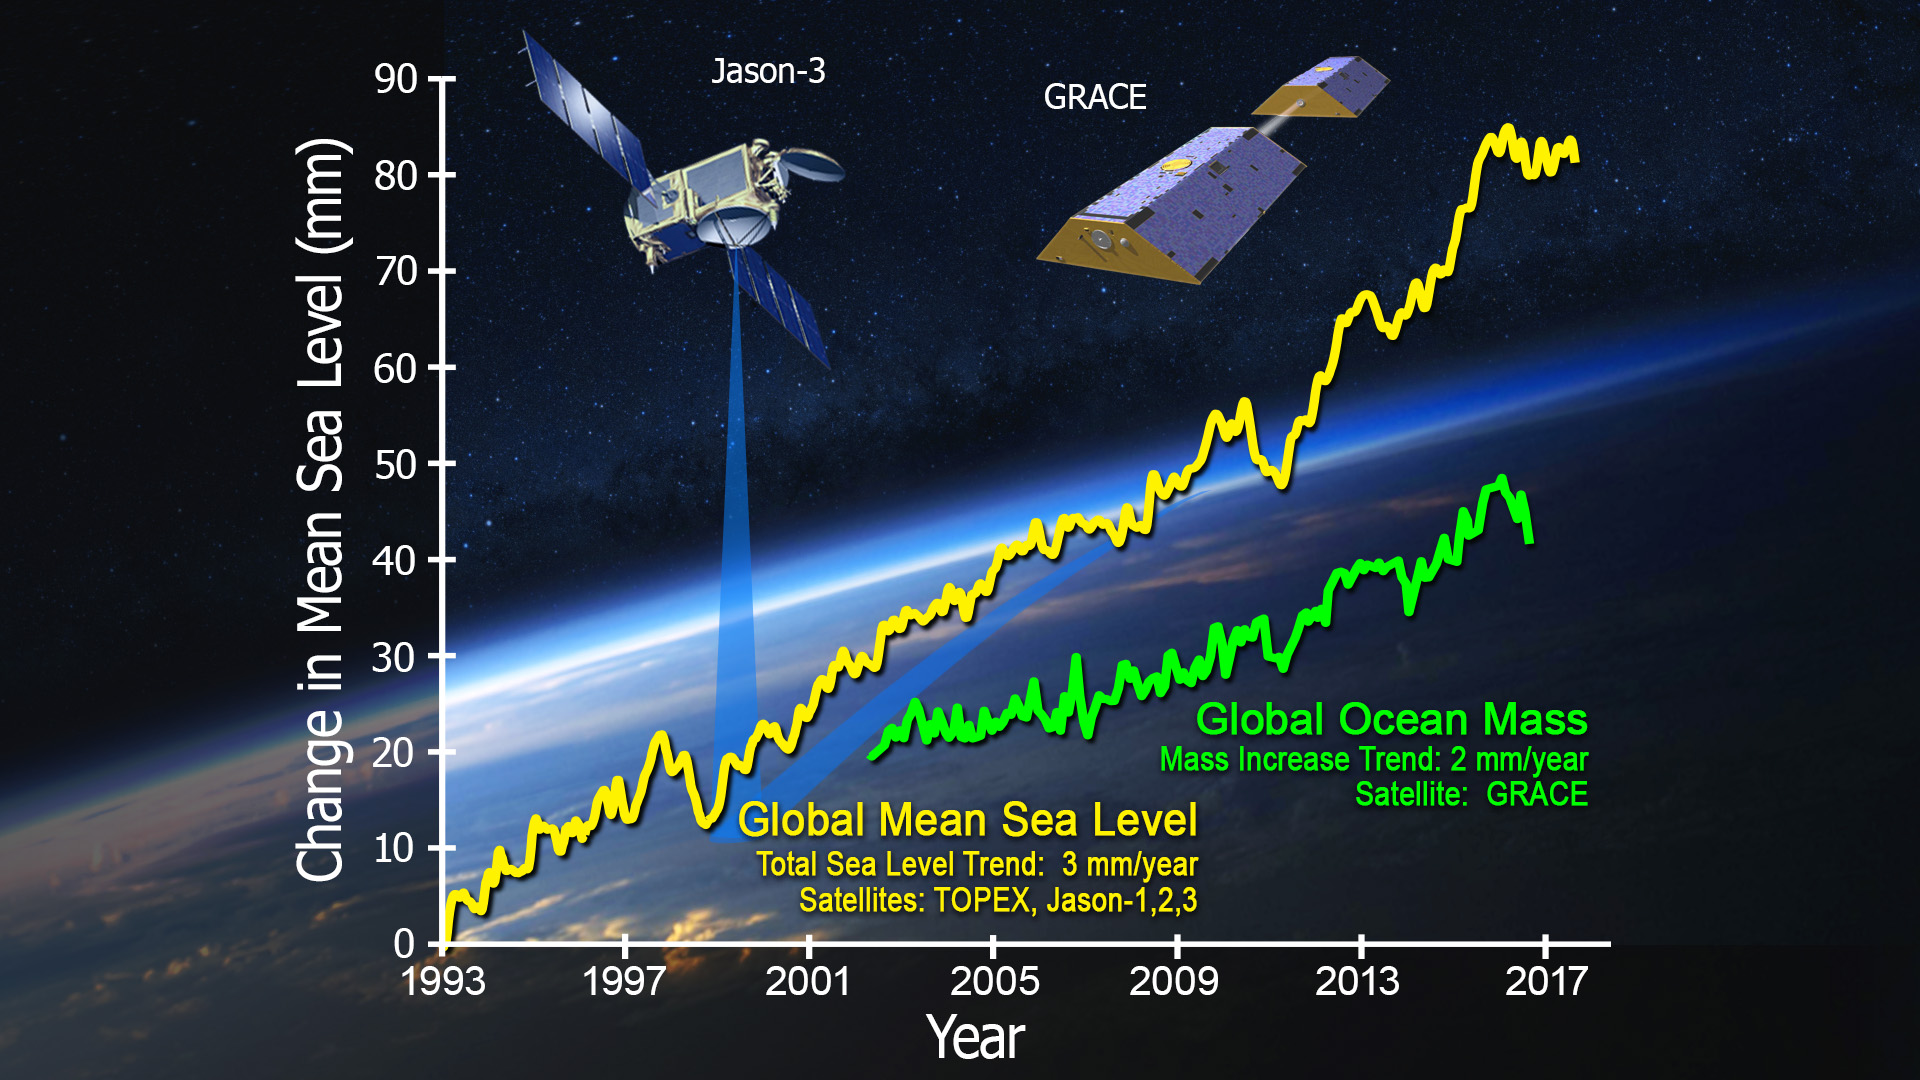
And, from Hsu and Velicogna 2017, which areas will see more resultant SLR than others:
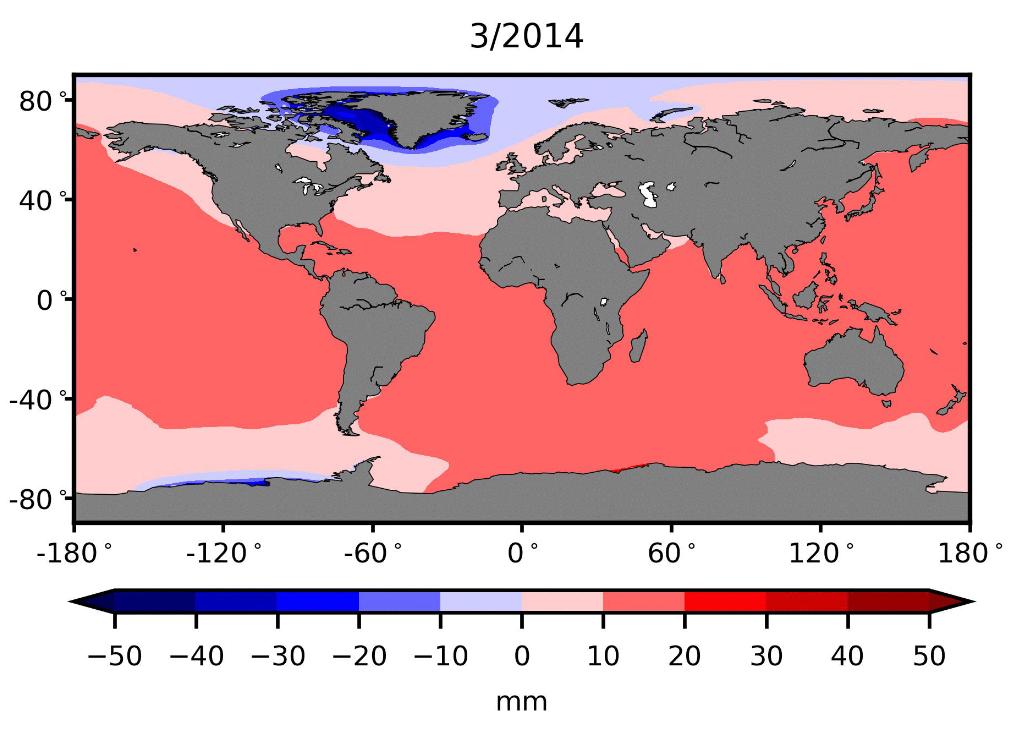
No amount of effusive prestidigitation (handwaving) can make that go away:
Please note that posting comments here at SkS is a privilege, not a right. This privilege can be rescinded if the posting individual treats adherence to the Comments Policy as optional, rather than the mandatory condition of participating in this online forum.
Please take the time to review the policy and ensure future comments are in full compliance with it. Thanks for your understanding and compliance in this matter.
-
michael sweet at 22:00 PM on 27 January 2018Sea level rise is exaggerated
George,
While there is no rise since 2010, there is a large rise since 2008. The long term rise is clear. Do you have a reason for selecting 2010 or was it just to cherry pick your claim?
Have you ever seen the escalator?

Do you think you could make a similar graph from the tide guage in New York?
-
Ari Jokimäki at 16:51 PM on 27 January 2018New research, January 15-21, 2018
Xulonn, I just tried the #32 and it opened with no problem. Perhaps it was just a temporary problem. There has been some problems with opening Wiley papers recently, though.
-
Glenn Tamblyn at 15:45 PM on 27 January 2018In 2017, the oceans were by far the hottest ever recorded
Jef
John Abraham was just being conservative. But actually, these numbers alone do go a loing way to show it is humns becasue they rule out lots of other posibilities.
This article from 2014 is using older data but the case is the same - the new numbers just make it clearer.
https://skepticalscience.com/Its_all_a_Question_of_Balance.html -
Glenn Tamblyn at 15:38 PM on 27 January 2018In 2017, the oceans were by far the hottest ever recorded
NODC is showing the same. Drop in 2016 then recovery in 2017. They had to lift the verticl scale from a max of 20 to 25 a few years back. Looks like they will have to do it again next year.
https://www.nodc.noaa.gov/OC5/3M_HEAT_CONTENT/heat_content2000m.png
-
Eclectic at 15:14 PM on 27 January 2018Sea level rise is exaggerated
George @277 , the tide gauge records collated by NOAA, for The Battery, on Manhattan, show a 400 mm rise in sea level during the past 160 years. (Strangely, the record shows a gap from about 1879 - 1893.) As you say, the reference no. is 8518750.
Mean sea level rise approx 2.8 mm per year, over that 160 years.
Possibly Manhattan Island is developing a strong tilt in recent times, with the northern end of the island lifiting high? I must look more closely at the Empire State Building, to see if it appears out of plumb. My previous impressions were that it was nowhere like as bad as that skyscraper in Pisa (fortunately).
-
GeorgeLet at 13:06 PM on 27 January 2018Sea level rise is exaggerated
I guess Manhattan must be elevating to actually show a decrease in sea level since 2010. And certainly no acceleration in sea level rise for more than 150 years.
https://tidesandcurrents.noaa.gov/sltrends/sltrends_station.shtml?stnid=8518750
Moderator Response:[PS] Precisely what point are you trying to make here from the basis of a single tide station? The relevance to the article is not clear.
-
jef12506 at 09:00 AM on 27 January 2018In 2017, the oceans were by far the hottest ever recorded
"The fact that 2017 was the oceans’ hottest year doesn’t prove humans are warming the planet. But, the long term upward trend that extends back many decades does prove global warming."
Clever little wiggle there. Implying that... hey, earth is warming but we can't be sure that humans are responsable.
Passive agressive denialism or just misinformation?
Moderator Response:[DB] From the article's concluding paragraph:
"Fortunately, we know why the oceans are warming (because of human greenhouse gases), and we can do something about it. We can take action to reduce the heating of our planet by using energy more wisely and increasing the use of clean and renewable energy (like wind and solar power)."
Emphasis added.
-
nigelj at 07:40 AM on 27 January 2018New research, January 15-21, 2018
Planting corn (maize) for biofuels is also pretty dubious, unless its limited strictly for aircraft applications. In that case algae based biofuels would be ideal, as they don't encroach on food crop lands.
-
nigelj at 07:34 AM on 27 January 2018New research, January 15-21, 2018
Imo biofuels have very limited application. Sometimes we get too focused on the science possibilities, and fail to do enough practical thinking. For example, to have any substantial impact, biofuels require a lot of land, and land is a scare resource. We have enormous pressure for food crops, grazing land, and forestry for building construction, and now also as a carbon sink.
It doesn't make a lot of sense turning crop lands into forestry plantations. Food crops are fundamental to humanity, and so will be prioritised, which is why it's so hard preserving what forests remain. It's sad to see degradation of the rainforests, and it should stop, but let's at least acknowledge why it happens.To think we can plant vast quantities of more forests seems very idealistic to me.
Replacing electricity generation with wood fired plant with biofuels doesn't make a lot of sense, when other totally clean alternatives now exist like wind and solar. Ditto biofuels for cars don't make a lot of sense, when electric cars are a now reality.
Imo the only application of biofuels that makes some degree of sense is 1)fuels for aircraft, because alternatives like electric powered aircraft are so challenging and 2) poor countries are better to burn wood than coal.
Signed, biofuels sceptic.
-
John S at 06:16 AM on 27 January 2018New research, January 15-21, 2018
Re: #1 Does replacing coal with wood lower CO2 emissions? Dynamic lifecycle analysis of wood energy: what about residues from trees that are harvested anyway for forest products? I believe less than 1/3 of the biomass makes it into forest products (i.e. tops and bottoms, bark, sawdust, other bits and pieces). What about fallen trees on the forest floor? What about grass? Algae? Municipal solid waste? Agricultural wastes? Some of all of the above could end up as fugitive methane. Advanced biofuels have a higher value than displacing coal (which other sources of energy can do nicely) – they can give us liquid fuels for transportation. Let’s not put all our eggs in the EV basket! Biomass can be the feed-stock for everything we currently get from oil and gas. That was my impression from reading Beyond Oil and Gas: The Methanol Economy (Aug 2011), by George A. Olah, Alain Goeppert and G.K Surya Prakash. To pre-empt someone saying there’s a mismatch in supply versus demand, I’d say that’s a strawman argument based on the all too frequently heard “all or nothing” mentality. On the contrary, surely any carbon neutral contribution can be worthwhile.
-
Xulonn at 02:47 AM on 27 January 2018New research, January 15-21, 2018
At least a few bad links with same error (such as #32 on moulins). My browser trys to connect to the link, fails, and then switches to 127.0.0.1 and displays the following message:
"Firefox can’t establish a connection to the server at 127.0.0.1"
Doing an IP lookup for that address yields:
"You have entered reserved IP Address 127.0.0.1 for private internet use and IP lookup for these will return no results."
In the "moulin" example, the fault appears to be with the paper's source Wiley's online library - and not Skeptical Science, because if I look up the paper's title in Google and click on that link, I get the same error.
-
SirCharles at 23:25 PM on 26 January 2018New research, January 15-21, 2018
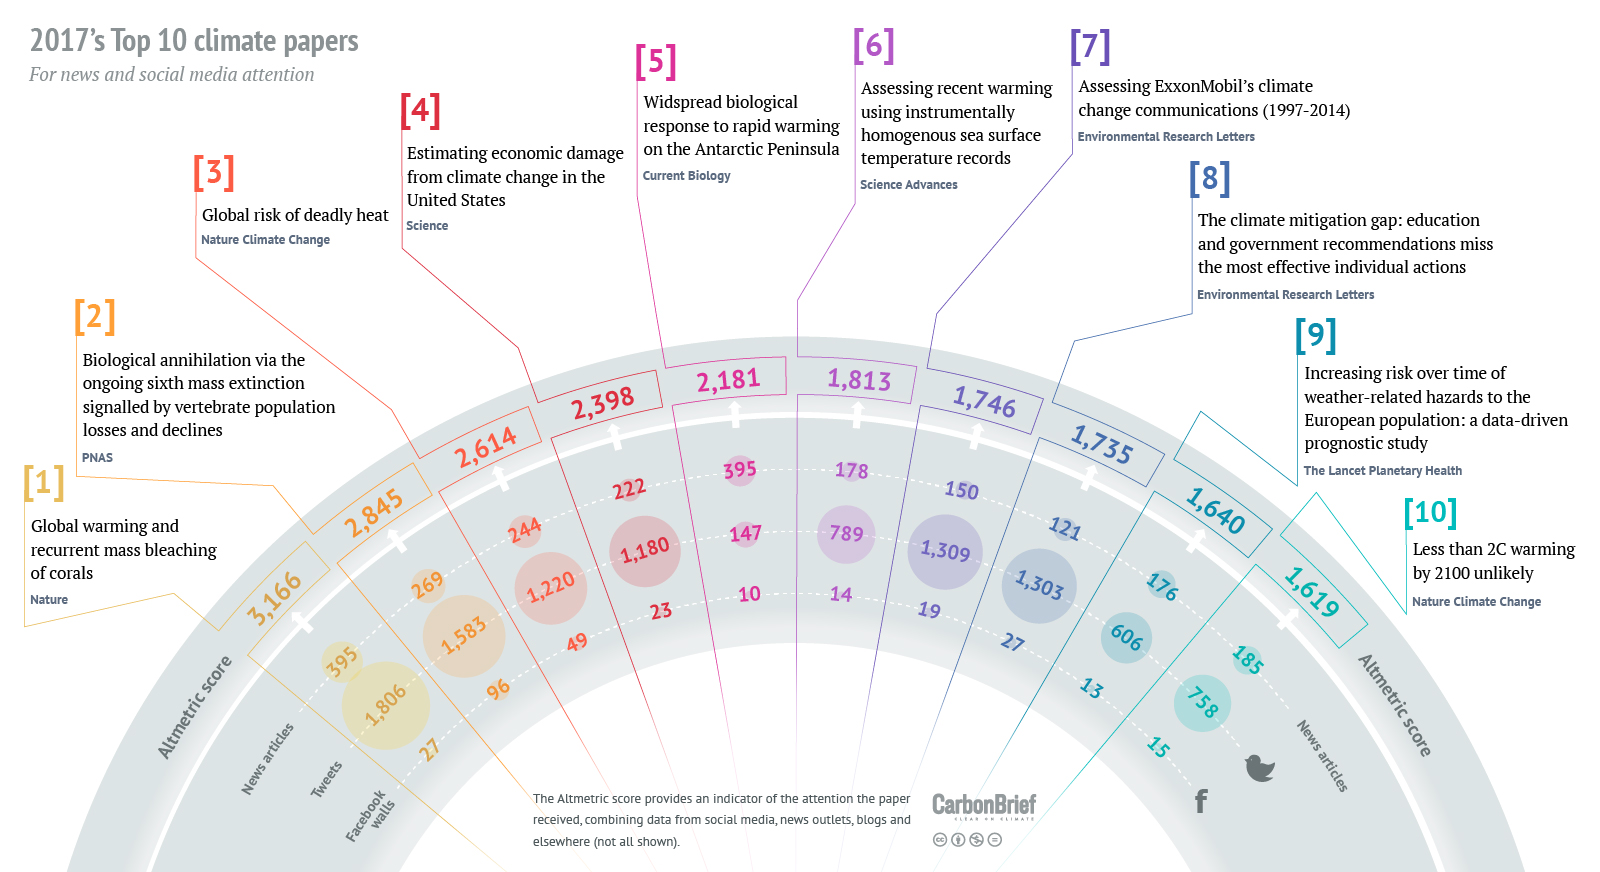
=> Analysis: The climate papers most featured in the media in 2017
(Carbon Brief)
-
michael sweet at 22:21 PM on 26 January 2018So, why is two degrees the magic number?
Winter Solstice
The winter has not been unusually cold yet this year. It is only cold compared to the record warm winters we have gotten used to. It is probably warmer than the average winter 50-75 years ago. The issue is that people have gotten used to it always being warm. Most people only remember the last 10 or so years of weather.
According to the NOAA record temperatures page, in the last 30 days there were only 17 all time record cold temperatures set (only 19 in the past year). This compares to the 177 all time high record temperatures set last summer. The number of record lows was less than you would expect based on long term averages. The media emphasizes the cold and ignores the heat.
There were only 100 monthly low temperatures in the last 30 days while there were 115 mothly highs. The daily records (in the last 30 days 7400 record lows and 4000 highs) are not as hard to break and there are a few more record lows.
Keep in mind that the news reports are about all the cold when we see that there are as many hot monthly records as cold (it is very rare for a hot all time record to be set in the middle of winter).
Compare the current normal cold weather to the record hot temperatures set during March 2012 when at least four locations the low temperature at night broke the previous daily highest temperature record. Monthly records from April were broken in March (April is normally much hotter than March).
Moderator Response:[DB] WinterSolstice is the 3rd sock puppet of banned user Pluto. No further replies to it are necessary, as all such sock puppets are now recused from further participation here.
-
WinterSolstice at 17:18 PM on 26 January 2018So, why is two degrees the magic number?
Could "dangerous climate change" also include record low temperatures striking the northeastern and midwestern USA this winter season along with severe weather events caused by these cold fronts colliding with warmer, moister air from other regions?
Moderator Response:[JH] Your question does not compute. To understand why, go to the SkS Climate Science Glossay and carefully read the definitions of climate and weather.
-
scaddenp at 06:22 AM on 26 January 2018Antarctica is gaining ice
matt - as per JH comment, you need to take notice as to which ice you are talking about. Sea ice extent appears to be influenced by katabatic winds bring cold air from the interior over the surrounding sea. These increase outward dispersion of sea-ice was well as freezing the surface so you can increase seaice extent despite a warming ocean as per papers cited in article. The strength of the katabatic winds seems to be influenced by the ozone levels in the stratosphere. However, more observations are needed before this can established with certainity.
Land ice is a more complex picture. Early models (TAR I think), predicted Antarctic land ice would increase as warming seas resulted in more moisture being blown over Antarctica and falling as snow. However, this is balanced by substantial ice sheet losses on margins especially in West Antarctica as calving rates accelerate. You can see the pictures/videos of land ice mass change over here. Broadly it is mass gain around EAIS and mass loss of WAIS, with overall net mass loss.
-
shastatodd at 04:15 AM on 26 January 2018So, why is two degrees the magic number?
good video.
and let us remember the maunder minimum (estimated at -.4C) caused the little ice age. so if -.4C did that, how can +2C somehow be "ok"? -
One Planet Only Forever at 03:52 AM on 26 January 2018So, why is two degrees the magic number?
Three terms need more consideration: Us, Dangerous and Sustainable.
'Us' is a term that is wide open to interpretation. It can be used/abused to refer to any sub-set of humanity or to humans as a sub-set of life on this amazing planet. And it can easily exclude future generations (They are not Us!). The assessment of acceptability of any Private Interest (and all there is is a collective of Private Interests - even in Communism) to develop a better future for humanity (or to ensure there is a future for humanity) must be that Private Interest actions will not be expected to result in any 'Net Harm' to any other aspect of life, with more conservative caution applied when there is less understood about the potential for harm. Using the term Us does not clearly focus on protecting the future of humanity, it excuses Private Interest sub-sets.
'Dangerous' can be perceived to be significantly different for different Private Interests. The loss of potential Profitability can be seen as 'dangerous' (by a sub-set Us). And the loss of perceptions of superiority, prosperity and opportunity can also be thought of as 'dangerous' (by a sub-set Us). For climate science and the clear understanding of the need to rapidly terminate an overdeveloped popular pursuit of profit, it is better to relate things to the Harm done to life. That consideration is more difficult for Private Interest bias to argue against (Private Interest can be expected to try to excuse a desire or belief). The activities associated with burning of fossil fuels have always done 'net harm' to other life, and understanding that it was harmful was well established in the 1960s and some harms like the SO2 and soot were addressed, sort of, eventually. And those harmful activities cannot be economically sustained even if the harm done is excluded from consideration (burning up non-renewable resources has no future). In fact, to remain economically viable the understood harms have to be increasingly excused to allow the activity to continue to be profitable/popular.
A focus on developing sustainable human activity is the Key. And sustainable activity means all humans fitting in as a sustainable part of a sustainable robust and diverse web of life on this, or any other, amazing planet (Darwin identified that things thrive and survive based on how they adapted evolved and 'Fit in'). It also means activity that does not require excuses or denial to defend it.
Some things can be observed to Thrive unsustainably to their ultimate demise. Humanity has the ability to think about how humanity 'collectively thrives', and act collectively to ensure that Private Interest sub-sets of humanity do not Win a better present for themselves to the detriment of any Others. The development of the gift of a sustainable and constantly improving future for all of humanity needs to become the understood Objective Measure of acceptable actions.
The Sustainable Development Goals are a solid basis for evaluating acceptable actions and identifying what needs to be corrected. And like all well developed understandings they are open to improvement if a Good Reason is presented that improves the Understanding, but they are highly unlikely to be dramatically changed.
Lack of responsible correction/limits of behaviour, just letting pursuit of popularity and profit produce the results it produces, developed the circumstance that made limiting global average surface temperature impacts to 1.0C impossible and limiting them to 1.5C unlikely. The need to curtail the burning of fossil fuels was understood in the 1960s, at a time when a 1.0C limit was achievable, but the required actions would have been to the detriment of many very wealthy people and would have requiring a reduction of perceptions of superiority and prosperity in the 'supposedly most advanced and developed nations'. The result of the actions of the collective of all Private Interests (all there is is the collective of Private Interests) was clearly sub-set evaluations of what was 'Dangerous' to 'Us' that resulted in over-development in dangerous unsustainable directions (and the development of misleading marketing) - and that needs to be understood to be the expected result of using Popularity and Profitability as the measure of the acceptability of Private Interest actions - and it needs to be understood that increased beliefs in the freedom of everyone to believe whatever they want and act as they wish makes things worse - that belief is Dangerous to the future of humanity because unacceptable pursuers of Private Interest can abuse 'desired beliefs' to excuse understandably unacceptable actions.
Prev 303 304 305 306 307 308 309 310 311 312 313 314 315 316 317 318 Next


