


 Arguments


Recent Comments
Prev 416 417 418 419 420 421 422 423 424 425 426 427 428 429 430 431 Next
Comments 21151 to 21200:
-
Tom Curtis at 12:31 PM on 24 January 2017We’re now breaking global temperature records once every three years
Richard McGuire @5, the four major surface temperature records show the following differences between 2015 and 2016:
GISTEMP LOTI 0.12 C
Berkeley Earth Surface Temperature LOTI 0.078 C
NOAA LOTI: 0.04 C
HadCRUT4: 0.013 C
Of these, NOAA and HadCRUT4 do not significantly cover polar regions, with HadCRUT4 also missing significant parts of Africa, the Middle East, and Australia. Apparently the Arctic was unusually hot, so that would account for the low values of those two relative to GISSTEMP and BEST. Further, BEST uses more stations, and probably has a better statistical technique than does GISSTEMP. NOAA and GISSTEMP use almost the same stations, with just a few extra for GISSTEMP, with GISSTEMP using the better technique; and HadCRUT4 has significantly less stations than the other three, and probably the worst technique.
Finally, each dataset has its own error margin. Further, at this stage each is liable to further, small adjustment as data from late reporting stations comes in. For both reasons, the figures should be considered as indicative rather than set in stone.
-
Richard McGuire at 12:11 PM on 24 January 2017We’re now breaking global temperature records once every three years
How much hotter was 2016 ? I read at the beginning of the the piece that 2016 broke the 2015 record by 0.12 degrees celsius according to NASA. Yet I have before me a news item taken from the ABC web site January 19th this year where the temperature rise is cited at 0.04 degrees celsius. The news item does not clarify which temperature data set that figure is taken from. I go to the Climate Council web site for more information and yes 2016 was the hottest year again by 0.04 celsius. Reading on I discover that their figure is based on NOAA temperature data. Throw in the UK Met Office and lower troposphere satellite data and it all becomes a bit of a dogs breakfast. Would it ever be possible when it comes to global surface temperatures for the NASA's, NOAA'S ect to collaborate come up with one figure ? Then there is the satellite data much loved by climate change deniers, but on this forum often accused of being problematic and unreliable. Did their 2016 data better that 1998 spike ? In the end it all comes down to clear communication.
-
Jim Eager at 12:00 PM on 24 January 2017We’re now breaking global temperature records once every three years
Tony Heller, aka Steven Goddard. The guy who claimed it snows CO2 atop the Antarctic ice dome. The guy who claimed the reason Lake Superior is cold is it "remembers" the last glaciation.
'Nuff said.
-
RedBaron at 11:21 AM on 24 January 2017Press complaints process is ‘exercise in futility’ for scientists
Reminds me of the Black Knight in a Monte Python skit declaring "None shall pass". When confronted with evidence of injury, completely ignores the "flesh wound" and simply repeats, "None shall pass". Just substitute Delingpole and Booker as the Black Knight.
The very idea that Ipso made such a ridiculous ruling only compounds the absurd nature of the whole thing. Almost like a court Jester kibitzing in from the side saying the Black Knight is right. His arm isn't off.
Doesn't speak well for UK journalism. That's certain. But I can't say US journalism is any better. Heck, we even elected the Black Knight POTUS.
Please tell me this is some strange UK humor?
-
Wol at 10:00 AM on 24 January 2017Press complaints process is ‘exercise in futility’ for scientists
Wasn't it in an interview with Dawkins that Delingpole actually stated that he was quite comfortable about not knowing science? That he was a "reviewer of reviews" or something like that?
A joke for anyone with any respect of science but unfortunately there are many who are so uneducated that people like Delingpole can spout "facts" and be taken seriously.
-
Postkey at 07:09 AM on 24 January 2017We’re now breaking global temperature records once every three years
Thanks for that.
-
Tom Curtis at 06:56 AM on 24 January 2017We’re now breaking global temperature records once every three years
Postkey @1, Breitbart's source is Tony Heller of Real Climate Science, now renamed "The deplorable climate science blog" (the one accurate thing about it). Tony Heller is one of the worst of the climate deniers. His output does not even rise to the level of pseudoscience, being rather a straightforward series of outrageous distortions of the data. His style can be shown by another recent article on the popularity of Trump, where he accuses "fake news networks" (by which he means the mainstream news) of reporting Trumps approval rating at 32% whereas, he assures us, it is actually 56%. In fact, the media have been reporting approval ratings around 40%, some based on a Fox Poll showing 42% favourable to 55% unfavourable. Looking at RealClearPolitics shows what is happening. Their average of 9 polls shows 41.8% favourable, to 49.9% unfavourable, but with the Rasmussen poll as a clear outlier, and the only one to show a net positive approval rating for Trump. Heller, of course, reports only the Rasmussen poll. Thus, by first distorting the news reporting, and then cherry picking his data, he purports to find media bias, wheras he only demonstrates his own. (I would go much further than that were it not for the comments policy.)
I another recent example, he indicates he has "Smoking gun of fraud by NASA and Gavin Schmidt". The "evidence" is a report on Real Climate claiming there was no pause. This is compared to a scientific paper, "Making Sense of the early 2000s slowdown" which said:
"It has been claimed that the early-2000s global warming slowdown or hiatus, characterized by a reduced rate of global surface warming, has been overstated, lacks sound scientific basis, or is unsupported by observations. The evidence presented here contradicts these claims."
Heller claims, based on the Real Climate article that "Now, the same people claim there never was a global warming pause or hiatus, and it was just a “red herring.”
Heller's evidence that these "are the same people" is that Michael Mann was both a co-author of the scientific paper and is a contributor to Real Climate. But a one person overlap hardly counts as "the same people". Nor is even that overlap relevant given that the Real Climate article was written, not by Mann, but by Rasmus Benestad. To summarize, Heller accuses Schmidt of fraud because one of his colleagues (Mann) supported one opinion in a scientific paper, and a different one of his colleagues supported a diferent opinion, later, and with more evidence. Needless to say, as an evidentiary basis this is beyond weak. As evidentiary support, it ressembles more a magic trick where he uses random facts to distract the audience from the fact that his thesis has no support at all, but is rather simply an unjustified slander.
Given that background, it will be no surprise that his evidence, rellied on by Breitbart, consists only of appending the running five year mean of the 2000 version of GISTEMP up to (approximately) 1995 to the running five year mean of RSS TLT up to 2014. That is, he has cherry picked the satellite data with the lowest trend knowing full well it does not measure surface temperatures and appended it to a surface temperature record whose endpoint is reduced to early 1990 levels (ie, Pinatubo volcano levels) by the inclusion of that volcano but not the 1998 El Nino in the averaging frame.
In short, it is just more prestidigitation.
No surprise then, that it should be echoed on a fake news site like Breitbart.
-
RedBaron at 06:32 AM on 24 January 2017How much does animal agriculture and eating meat contribute to global warming?
sjames0101,
The guest article written by West and Briske at RealClimate was rigorously and vigorously disputed in the comments section. Not the least of which was this formal rebuttal by Teague.
DEFICIENCIES IN THE BRISKE ESTIMATES OF CARBON SEQUESTRATION ON RANGELANDS
By Richard Teague
Professor, Ecosystem Science and Management, Texas A&M University
Senior Scientist of the Borlaug Institute
Associate Resident Director, Texas A&M AgriLife Research
P.O. Box 1658, Vernon, TX 76385
E-mail: rteague@ag.tamu.eduMost research related to grazing management, and thus carbon sequestration potential, on rangelands cited by Briske et al. [1,2,3] has been short-term and has examined the issue from a reductionist viewpoint that ignores the critical influences of scale, and does not use adaptive multi-paddock grazing to achieve sound animal production, resource improvement, and socio-economic goals under constantly varying conditions on rangelands [4]. Superior results in terms of range ecosystem improvement, productivity, soil carbon and fertility, water holding capacity and profitability have been regularly obtained by ranchers using multiple paddocks per herd with short periods of grazing, long recovery periods and adaptively changing recovery periods and other management elements as conditions change [4,5].
The references cited by Briske et al. [1,2,3] concentrate only on differences in rangeland productivity without meaningfully taking into account negative impacts on the environment that can lead to misleading extrapolations. These conclusions cloud, rather than enhance, knowledge about sustainable grazing management and are not relevant to practical grazing management. Multi-paddock grazing research from Australia, Southern Africa, Argentina and USA [4,5] that was: i) conducted at the scale of ranching operations, ii) adaptively managed as conditions changed to achieve desired ecosystem and production goals, and iii) measured parameters indicating change in ecosystem function, have arrived at the opposite conclusion. These published data were omitted in the reviews by Briske et al. [1,2,3].
Many ranchers around the world have used adaptive, multi-paddock grazing management to restore ecosystem services and productivity on degraded rangelands in areas with less than 10 and up to 80 inches of annual precipitation. Many of these ranches in drier areas were initially so bare of vegetation that they would have been classified as desertified. By ignoring such successful restoration examples, Briske and other scientists with the same limited experience are grossly underestimating the potential of management to increase carbon sequestration on the rangelands of the world. Consequently, the inferences and conclusions made by Briske et al. [1,2,3] do not represent the subject adequately because conclusions have been selectively chosen so as to exclude published data showing superior results at commercial ranch scale from adaptively managed multi-paddock grazing. The studies referenced underestimate positive benefits to soil and ecosystem function, so they almost certainly underestimate the potential of rangelands to sequester carbon. The accumulated body of small-scale grazing systems research promoted by Dr. Briske and partners needs to be evaluated in light of the discrepancies with larger-scale studies, and perhaps should be largely set aside as being of little relevance to any discussion of grazing distribution on commercial ranches.
The majority of conservation awards to ranchers operating on native rangelands have overwhelmingly gone to ranchers using multi-paddock grazing of one form or another. These ranchers operate in extensive, heterogeneous landscapes, where they are confronted with the adverse effects of uneven grazing distribution, and their collective ecological and management knowledge using multi paddock grazing indicating the necessity of using adaptive, multi-paddock grazing management to achieve superior outcomes. The articles in the Rangelands October 2013 issue, a journal of the Society for Rangeland Management, support this.
In calculating the potential of rangelands to sequester carbon to offset global climate change and improve ecosystem function we cannot ignore the superior outcomes achieved by conservation award winning ranchers, those who have restored ecosystem function and productivity on degraded rangeland using adaptively managed multi-paddock, time-controlled grazing, or published research that does not refute the results achieved on these ranches.References
1. Briske, D., Derner, J., Brown, J., Fuhlendorf, S., Teague, R., Gillen, B., Ash, A., Havstad, K., Willms, W., 2008. Benefits of Rotational Grazing on Rangelands: An Evaluation of the Experimental Evidence. Rangeland Ecology and Management 61, 3-17. http://www.srmjournals.org/doi/abs/10.2111/06-159R.1
2. Briske, D.D., Sayre, N.F., Huntsinger, L., Fernandez-Gimenez, M., Budd, B., Derner, J.D., 2011. Origin, persistence, and resolution of the rotational grazing debate: integrating human dimensions into rangeland research. Rangeland Ecology and Management 64, 325e334.
3. David D. Briske, Brandon T. Bestelmeyer, Joel R. Brown, Samuel D. Fuhlendorf, and H. Wayne Polley, 2013. The Savory Method Can Not Green Deserts or Reverse Climate Change. A response to the Allan Savory TED video. Rangelands 35(5):72-74. 2013
doi: http://dx.doi.org/10.2111/RANGELANDS-D-13-00044.14. Richard Teague, Fred Provenza, Urs Kreuter, Tim Steffens, Matt Barnes, 2013. Multi-paddock grazing on rangelands: Why the perceptual dichotomy between research results and rancher experience? Journal of Environmental Management, Volume 128, 15 October 2013, Pages 699-717, ISSN 0301-4797, http://dx.doi.org/10.1016/j.jenvman.2013.05.064.
5. Teague, W.R., Dowhower, S.L., Baker, S.A., Haile, N., DeLaune, P.B., Conover, D.M., 2011. Grazing management impacts on vegetation, soil biota and soil chemical, physical and hydrological properties in tall grass prairie. Agriculture Ecosystems and Environment 141, 310-322.
http://www.sciencedirect.com/science/article/pii/S0167880911000934The John Carter et al. paper is an open access article. And yet even with large viewership, not once has it been cited in any other peer reviewed paper. This should be your first clue regarding the quality of the review. Simply put, a so called review of HM that doesn't actually review HM land isn't really worth a whole lot except to document why the consensus prior to Savory's work didn't believe Savory would succeed as he has. But empirical evidence always trumps low quality reviews like this. The Teague rebuttal of Briske applies here as well.
The Rolf Sommer paper is a much better paper, but it did not study any HP managed land, nor any other of the many regenerative agricultural practises. It has been cited 15 times. Generally it is a good example of the potential of conventional no till and fallows as a mitigation tool. I happen to agree with the Sommer paper that this won't work. I said as much in my previous post to you. If we are locked into this sort of agriculture, even the best case scenarios are still insufficient and do no more than slow the inevitable. In that false dichotomy where we are forced to do agriculture in this manner, then yes veganism is less destructive. Already stipulated. I simply don't agree that we are locked into this sort of high input agriculture that Rolf Sommer modeled. In fact, neither does the USDA.
"When farmers view soil health not as an abstract virtue, but as a real asset, it revolutionizes the way they farm and radically reduces their dependence on inputs to produce food and fiber." -USDA
The last paper you referenced is another great paper in my opinion, However, keep in mind what it is basically saying is the Roth C model is not capable of describing the LCP.
These inconsistencies suggest that ESMs must better represent carbon stabilization processes and the turnover time of slow and passive reservoirs when simulating future atmospheric carbon dioxide dynamics.
In fact I agree. The Roth C model was thought to do a good job of describing labile carbon cycling in the soil, but does not describe the medium to long carbon cycling at all. It is inadequate for predicting carbon sequestration in the soil snk. Your study shows it is even less adequate than previously known. Dr Christine Jones has written extensively about this. And her conclusions come from multiple 10yr case studies of HM land against controlls.
Liquid Carbon Pathway Unrecognised
Moderator Response:[PS] Just a note that Teague and Briske have conducted a lively debate in the literature over quite a number of years which you can follow by cites in google scholar. A recent paper trying to reconcile differences in results might be of interest to commentators.
RB, instead of having comments and references supporting your arguements scattered over many SkS threads and comments, how about you create a website (or make a free blog with Wordpress or blogger.com) where you can collect your evidence and references in one place with a full coherent argument. Then you can direct other commentators to this resource rather than simply repeating it all the time.
-
Postkey at 04:10 AM on 24 January 2017We’re now breaking global temperature records once every three years
“deniers gonna deny.”
The 'latest'?
“Unadjusted and satellite records combine to suggest that there has been no more than 0.6 degrees C warming since the middle of the 19th century.”
http://www.breitbart.com/big-government/2017/01/20/hottest-year-evah-climate-alarmists-last-big-scare-story-before-trump/ -
John Hartz at 01:44 AM on 24 January 20172017 SkS Weekly Climate Change & Global Warming Digest #3
ajki: An explanation of how Climate Central computed the data used to create the Graphic of the Week is contained in its Research Report, Flirting with the 1.5°C Threshold, April 20, 2016.
-
sjames0101 at 19:03 PM on 23 January 2017How much does animal agriculture and eating meat contribute to global warming?
@RedBaron 192
Allan Savory is just a con man. There is no evidence that his ideas on "holoistic management" actually work. Furthermore there is evidence that soil carbon sequesteration is not a solution to climate change the animal agriculture climate change denialists would have us believe.
Here is a good comentary on his Ted talk http://www.realclimate.org/index.php/archives/2013/11/cows-carbon-and-the-anthropocene-commentary-on-savory-ted-video/
More evidence...
https://www.hindawi.com/journals/ijbd/2014/163431/
http://www.sciencedirect.com/science/article/pii/S0301479714002588?np=y
http://science.sciencemag.org/content/353/6306/1419Moderator Response:[PS] Please read and comply with the comments policy - no accusations of fraud. Fixed the links. Please use to the link tool in the comment editor to create these yourself - posting links to references like this is best way to conduct a discussion. We strongly encourage it.
-
ajki at 17:08 PM on 23 January 20172017 SkS Weekly Climate Change & Global Warming Digest #3
Tom @2: When I look up some anomaly curves/data (e.g. on woodfortrees, gistmp LOTI), I can really see a massive "spike" within the timeframe 11/2015 and 02-03/2016 (the Nino peak, I assume). But the per-day values in this timeframe are sure connected (in the upward direction) - there isn't something like a sudden "step" from Dec 2015 to Jan 2016. This is a kind of representational flaw within the graph, which may lead (and sure led me) to a very high astonishment factor.
-
One Planet Only Forever at 14:44 PM on 23 January 20172017 SkS Weekly Climate Change & Global Warming Digest #3
The Story of the Week is a comprehensive presentation of how damaging just one USA Presidential term of deliberate delay on climate action can be. However, the clear precedent for the concerns was not mentioned. The USA anti-Leadership of the Bush Administration on this matter is clearly a major reason the challenge today is so much larger.
During those 8 years some very smart people deliberately trying to get away with behaving as unacceptably as they could get away with. THeir actions had major impacts on the magnitude of the challenge being faced today. The developing nations were given plenty of good excuses to refuse to consider that they had any responsibility to commit to behaving better than the already developed nations, particularly the leadership of the USA, had behaved. It also derailed efforts by other developed nations that wanted to be more helpful, because being more helpful was clearly a global competitive disadvantage to the deliberate trouble-makers encouraged and excused by the likes of the Bush Administration.
Another point not clearly presented is that the added actions to try to mitigate the climate impacts are costs and challenges being imposed on future generations, other people. Many of the people benefiting from creating the future costs, and potentially insurmountable challenges of trying to correctly determine exactly how to adapt to the rapid climate changes in every region of the planet, will not suffer the consequences. Some of the most powerful people benefiting today likely only care about benefiting for a short period of time (maximizing their image and personal rate of return during their personal lifetime. They really do not care what people in the future think about them. Why should they?).
Particularly troubling are the statements that if things get built on the gamble that they will be gotten away with, they actually become activities that deserve protection. It is as if the investors who gambled on getting away with behaving unacceptably get protected from losing on their bad bets because of some implication that getting 'Leadership Permission' to go ahead somehow grants them immunity from personally losing Big Time when the unacceptability of what they is better understood.
Since the end of the 1980s it has been clear that every wealthy powerful person understood the unacceptability of already fortunate humans trying to get even more benefit from an activity like the global burning of fossil fuels. Only the less fortunate deserved an opportunity to benefit. And even their opportunity to benefit from burning fossil fuels would need to be limited. The exact global limit was not as clearly understood then, but the gist of it was undeniable.
I will present my perspective of the case of Alberta Bitumen Extraction (since it is what I am intimately familiar with, having lived here through those years). The understanding that there would be global limits on fossil fuel burning, and understanding that the less fortunate would be considered to be the only ones allowed to really benefit, was likely a major motivation for the Alberta efforts to rapidly accelerate the extraction of buried ancient hydorcarbons, particularly the massive amount of Bitumen in the sands of Northern Alberta. Those efforts included setting incredibly low Royalty rates and giving other incentives to get investors to bet on getting away with profiting from extraction of Alberta Bitumen. Future Albertans clearly could have gotten more value out of the buried ancient hydrocarbons but that was not a serious consideration. The key action was rapidly building a popular impression of economic activity that could be claimed to be deserving of protection and further growth. Don't all those people who have jobs deserve to continue doing what they were doing for as long as they can get away with? More importantly, don't the investors deserve to get their 'expected' return on their investment?
The expansion of the rate of extraction is now being claimed to be the reason that pipelines must be built. The threat is that if the new pipelines for the unjustifiably expanded, but 'permitted', operations are not allowed then that larger rate of extraction will be shipped in more damaging ways. And the Conservative Federal government deliberately weakened the permission process for pipelines, making it a quicker process and far more difficult for the unacceptable permission of such pursuits to be 'legally' blocked. And the regional popularity and profitability make it even more difficult to stop because 'why should anyone care about the future problems other people may face?'
A sad part is the recent claims of Alberta leadership on climate action. The claims being made are that by taking nominal action regarding CO2 emissions Alberta is granted social license and support for pipelines (or continuing to benefit from the extraction of the bitumen as long as can be gotten away with). It is sort of like claiming that since you properly stop at a stop sign you get the social licence to speed through playground zones, or from a business perspective if you donate to the Food Bank you can pollute the river. No amount of good action grants permission to behave less acceptably, yet popular opinion in Alberta (and outside of Alberta), clearly indicates those ways of thinking are indeed common, and many people actually consider such thinking to be sensible.
That is just the case of what happened in Alberta since the end of the 1980s. Many similarly damaging developments of undeserved perceptions of prosperity have been gotten away with. And it is undeniable that the Trump Administration will try to develop popular support for even more undeserved perceptions of prosperity.
Such actions are claimed to be the proper balancing of economic interests with other considerations. But they deliberately exclude future considerations or any considerations of unacceptability that clearly should Trump any “demand for balance'. The reality of what goes on was well presented in the 1987 UN commissioned report “Our Common Future”. That report made it clear that any reasonably aware wealthy powerful person no longer had any excuse to try to get away with benefiting from an activity that likely created problems for future generations. The following quote from that document states it undeniably:
“.25. Many present efforts to guard and maintain human progress, to meet human needs, and to realize human ambitions are simply unsustainable - in both the rich and poor nations. They draw too heavily, too quickly, on already overdrawn environmental resource accounts to be affordable far into the future without bankrupting those accounts. They may show profit on the balance sheets of our generation, but our children will inherit the losses. We borrow environmental capital from future generations with no intention or prospect of repaying. They may damn us for our spendthrift ways, but they can never collect on our debt to them. We act as we do because we can get away with it: future generations do not vote; they have no political or financial power; they cannot challenge our decisions.
26. But the results of the present profligacy are rapidly closing the options for future generations. Most of today's decision makers will be dead before the planet feels; the heavier effects of acid precipitation, global warming, ozone depletion, or widespread desertification and species loss. Most of the young voters of today will still be alive. In the Commission's hearings it was the young, those who have the most to lose, who were the harshest critics of the planet's present management.”The future for life on this planet is clearly the responsibility of every generation of humanity. And every 'today' is the result of how responsible or irresponsible previous generations were. Real leaders understand their responsibility for the future. Many Winners like Trump care more about 'Appearing to Win any way they can get away with'. The USA is now clearly being governed by Winners for at least 2 years (the mid-term election could change control of the Senate, and maybe even the House). Hopefully the Winners who care less about the future will be encouraged to change their minds and becoming Responsible Leaders. If they don't then the future of humanity loses; It becomes more difficult for other Responsible Leaders to succeed if they have to compete with “People who don't care how they Win”.
-
RedBaron at 14:07 PM on 23 January 2017How much does animal agriculture and eating meat contribute to global warming?
sjames0101,
It is the same false dichotomy posted many places on the web. The false assumption being there is no sustainable way to do agriculture. So that isn't even an option. Therefore given we are locked into destructive forms of agriculture, a vegan diet would be the lessor of the two evils.
If your premise were true, sure that makes sense. However, it isn't true. We can change agricultural models to regenerative systems. When we do that, animals are an important part of the biological cycles.
“The number one public enemy is the cow. But the number one tool that can save mankind is the cow. We need every cow we can get back out on the range. It is almost criminal to have them in feedlots which are inhumane, antisocial, and environmentally and economically unsound.” Allan Savory
So for now I commend you for boycotting industrial factory farming of animals. But it isn't a solution to climate change. The types of agriculture that can actually be part of a solution to climate change in almost every case involve animal husbandry properly done.
-
sjames0101 at 09:59 AM on 23 January 2017How much does animal agriculture and eating meat contribute to global warming?
The problem is not just how to address climate change now, but in the future. Bajželj et al. estimate that business as usual increases in westernisation of global diets will mean that by 2050 agriculture will be responsible for 20.3Gt of CO2, pretty much our complete carbon emissions budget. And that is assuming that Climate change does not negitively affect yields what with water scarcity and resulting irrigation problems. If we have a higher population than some estimates, say the UN's high estimate of 10.9 billion then agricultural GHG emissions go up to 25.4Gt. http://sbc.ucdavis.edu/files/202364.pdf
Maybe we substantially increase yields despite the challenges of climate change, and lets say we decrease food waste by 50%, and lets assume estimates of population are 9.6 billion rater than the UN's high estimate. Eve then 2050 GHG emissions are still estimated by Bajželj et al. to be 11.7 Gt of CO2, more than half of our carbon budget. If the population cut out animal products from their diet on mass though, modeled by Bajželj as a healthy diet YG3 scenareo (US per head red meat reductions approx 75%), that gets GHG emissions down to 5.9 Gt.
Given this, it stands to reason a culture of veganism would go a long way to helping the population as a whole meet such a avg per head target. And if we dont meet such avg reductions our hope of not exceeding our carbon budget in the future looks pretty slim even if we manage to avoid population and yield challenges. It seems to me then the best way of meeting these risks for the future is for as many people as possible to go vegan, in developed counties at least. -
One Planet Only Forever at 09:27 AM on 23 January 20172017 SkS Weekly Climate Change & Global Warming Digest #3
One thing I like about the 30 year average in the surface temperature data is there is a slight decline from about 1950 to the early 1960s (30 year averages ending in 1965 through the late 1970s). Seeing that slight decline helps understand why some people where thinking the planet was headed into cooling at a rate that may be beneficially moderated by increased levels of green house gas. It also shows that by 1980 such thinking was clearly no longer supported by the trend of the temperature data.
-
D Murray at 09:15 AM on 23 January 2017Global weirding with Katharine Hayhoe: Episode 8
Tom Curtis @7. That depends. The Bible as a historic text is irrefutably accurate. But prophecies are in some cases warnings to change behavior, others are made as defintie and certain outcomes, even if we do not know exactly what they mean. How they are fulfilled is also a mystery. But, many a biblical scholar concur with certain meanings, interpretations and the context.The same for those verses follwing 16:8-9. They actually are pretty clear though. Not only can the author understand some of the things he reveals, but others may understand as well. Afterall, "we see now as looking into a mirror darkly..." (See Daniel 12 and Hosea)
William @2. You actually are correct. The backup generators do run out of fuel after a while. They may prolong their suffering, but the rich are warned about being too comfortable.
I did not intend for this to be a test here. I only meant that some should take the apocalyptic judgments to mean that things would get worse. Climate Crises Theory does the same. Whether one can turn that around and avoid such judgments is unknown. In the case of climate change, we do not really know how much is manmade or what else contributes to it. We can adapt though.
Tom Curtis @8. All Christians do not oppose climate change as a matter of faith. Their faith is put in God. Unfortunately, many a conservative- and many are Christian- believe that there is a movement toward embracing a false world governance in some form and, therefore, a false prophet or false world leader. If you can understand this, then you will understand their fears. Being a Christian who believes in a prophetic event does not lead one to ignore doing right, which could be opposing anything that seems to oppose God. Talk by politicians and the UN to create a world tax and give them power to enforce world laws on climate and environment are to be avoided by Christians in particular who view this as helping to usher in the ungodly dominance of the world.
As David Orr wrote, he believed that religion could play a big part in helping to resolve climate problens. Afterall, man was designated as stewards of creation. That supposes a great responsibility to do good toward it. Find common ground with Christians, and some other religions, and you can move the world to a better place. Attack and scare them by thinking you are so smart as to know the answer and push it on them, you will accomplish little.
Moderator Response:[PS] Please take this discussion elsewhere. "The Bible as a historic text is irrefutably accurate." is simply an inflammatory slogan on a science blog.
-
One Planet Only Forever at 09:08 AM on 23 January 20172017 SkS Weekly Climate Change & Global Warming Digest #3
The Graphic of the Week appears to be a "Cherry-picked" way of analysing and presenting the data. It seems to have been done in order to claim the warming has just about reached 1.5 C. That is unnecessarily Alarmist.
I struggle to see a scientific reason for evaluating the temperatures the way they have been evaluated.
However, I also consider it far more meaningful to present a graph of a running 10 year average (a new point for each new month, not even having to wait for a calendar year to end) than showing straight lines of the average over each Decade. The use of the 10 year bar leads to arguments that we need to wait for the next 10 years of data to be collected before anything can be concluded.
I also think that a running 12 month average is also a more meaningful presentation of what is going on than waiting until the December numbers are in to declare how much warmer a 12 month period has been.
I would think that a clearer and more comprehensive presentation would be the running 12-month average through the past 137 years of data. It would highlight what needs to be highlighted about how warm the planet is becoming even though the maximum value would not have been as close to 1.5 C. And lines for the running 10-year average and 30-year average should also be shown to highlight the trend of the temperatures.
And the same should be done for the satellite data. The 9 year length of the 30 year average in the satellite data would be good for people to see, because though it is short it is undeniably climbing. And it would raise the valid question of why the likes of Dr. Roy Spencer prefer to show a 13 month average on the satellite data.
-
D Murray at 08:04 AM on 23 January 2017Other planets are warming
Wow! So many inferences about lack of research and data, now one about backyard quarterbacks (did you mean armchair quarterbacks?), yet, some of you would have the world accept AGW as solid science and irrefutable. All these debates prove one thing— lack of concensus and that scientists are not gods afterall. Models are not irrefutable science. THey are just models to help us understand what is going on. They are useful to see our errors and to help us make adjustments. No more, no less!
If one sees a trend, a scientist will test it over and over. How does one do that here. Always guessing, always adjusting, always trying to save face for ones' ego. Compensating for human error and good and bad "guesses".
Global warming is real and there may be, probably is, more than AGW casuing the abnormal increases behind it. Trying to remove manmade contributors is not all feasible. Controlling them is not a bad thing. The human race will survive, we will make adjustments and adapt. Crops will be rotated and adjusted as mother nature has always done, and not all crops will be lost (unless pollinators continue to decline), we will make adjustments to planting seasons as man has for thousands of years. Plants will enjoy the increases of CO2, and the areas which flood— the areas we have been saying not to develop in— will be underwater. So what? We will learn a final lesson and go on with life.
Even if we removed all man-made contributors driving the AGW climate change, it would only clear up 10%-12% of the problem. The rest is beyond our control! It seems more realistic, and cheaper, to minimize losses to property and life by removing some existing development and prohibiting further development in sensitive area, continue to put more research into green technologies and water conversion and delivery methods to live more sustainably.
THINK positively, and critically! What can we do to achieve some concensus? What do we do to achieve the least expensive means to accomplish this? We need concensus and realistic goals. Not more theory and arguments.
Moderator Response:[DB] Off-topic snipped. Please stay on the topic of this thread, Other planets are warming.
[PS]
Thank you for taking the time to share with us. Skeptical Science is a user forum wherein the science of climate change can be discussed from the standpoint of the science itself. Ideology and politics get checked at the keyboard.
Please take the time to review the Comments Policy and ensure future comments are in full compliance with it. Thanks for your understanding and compliance in this matter.
In particular, comments must be ontopic and please note the ban on sloganeering - repeating long refuted myths without any substatiated debate. You post has numerous instance where you making such statement. Eg "Even if we removed all man-made contributors driving the AGW climate change, it would only clear up 10%-12% of the problem." You must back your position by references/data. Strawman arugments also have no place. This is place for discussion of the science and you cannot hope to make some useful criticism of science without spending some effort actually understanding it.
-
Tom Curtis at 07:56 AM on 23 January 2017Global weirding with Katharine Hayhoe: Episode 8
In the subtitles:
"Our first clue came from the poles" should be "Our first clue came from the polls". (1:15)
"Thousands of gages..." should be "Thousands of gauges...". (2:54) For what it is worth, a gage is a glove thrown down to indicate a challenge to knightly combat, or more figureatively, a pledge of good faith.
Katherine Hayhoe's definition of Evangelicals as "People who take the Bible seriously" is self serving, and condescending. Catholics, I am sure, think they also take the Bible seriously, as no doubt would Orthodox Christians. Certainly, so also would charismatics (a different distinction that overlaps with other groups). It is also, if intended to mean they take the Bible at face value, false; as is shown by the overwhelming support of Trump by white Evangelicals, or more directly by their support of institutions dependent on the charging of interest (contrary to the Biblical prohibition). (1:11)
The main point, ie, that Christians, to be faithful must oppose climate change as a consequence of the love they are enjoined to practise, is exactly right.
-
Tom Curtis at 07:39 AM on 23 January 2017Global weirding with Katharine Hayhoe: Episode 8
D Murray @6, I assume you had in mind Revelation 16: 8-9, however nobody other than the author (whether you take that to be a natural or supernatural entity) knew (or knows) the correct interpretation of Revelation. Its language is sufficiently fantastical to act as a rorschach test of anybodies predelictions. I would not cite it as evidence of anything (beyond John's apprehension of persecution, and hope of deliverance in the late first century AD).
Moderator Response:[PS] While this topic lends itself to religious discussion, I would ask commentators to keep discussions focussed directly on topic and especially to find somewhere for any discussions about veracity of the bible etc.
-
Tom Curtis at 07:33 AM on 23 January 20172017 SkS Weekly Climate Change & Global Warming Digest #3
ajki @1, the graph shows "year-to-date anomalies". That is, in January it shows the average anomaly of all months up to January (ie, the January anomaly). In February it shows the average up to February (ie, the average of January and February). And so on.
If you look at 2015, it started moderately warm (about 1.12 C). It then warmed for three months (ie, each successive month was slightly warmer than the average of the preceding months). It then cooled for 6 months (each successive month was cooler than the average of the preceding months), then warmed over the remainder of the year. That means it finished hot, just as 2016 started hot, even though its final value (the average for the year) was not very hot relative to 2016 because of the cooler months in the middle of 2015.
All temperature qualifiers are relative to the last few years. Of course they all have been very hot relative to the early twentieth century, or even relative to most years in the late twentieth century.
-
D Murray at 07:08 AM on 23 January 2017Global weirding with Katharine Hayhoe: Episode 8
The Bible does address climate change. Check the Revelation for one. It will get wose. :)
-
ajki at 06:46 AM on 23 January 20172017 SkS Weekly Climate Change & Global Warming Digest #3
I have to freely confess that I don't really get the "Graphic of the Week".
It seems to show temperature curves throughout consecutive years from Jan to Dec. But how can the end of, say, the 2015 curve in Dec 2015 be about 0.3° (or so) lower than the start of the 2016 curve in Jan 2016?
-
martin3818 at 04:20 AM on 23 January 2017So what did-in the dinosaurs? An update.
The newest uranium-lead dates measured in rocks near Denver by Clyde et al, published last fall, also show that the fern spike (the layer which indicates most vegetation was replaced by ferns during the extinction) peaked about 85 years after the impact, and lasted roughly 850 years.
85 years! Is this a typo?
-
One Planet Only Forever at 03:38 AM on 23 January 2017Video: NASA’s Dr Gavin Schmidt on 2016 as the hottest year on record
Rocketeer@2,
Corrections/clarifications to my previous post. Working in a rush can clearly be detrimental.
Though I started looking at Jan Null's (not Nulls') presentation to match Arctic Sea Ice Minimums to the ENSO events, I ultimately found that the NOAA ONI table was a better way to determine what the ENSO conditions were leading up to an Arctic Sea Ice September minimum.
With that in mind, and looking at all cases where the Arctic minimum was lower than years before and after, the following are clarified observations:
- 1981, 1990, 1993 and 2005 were during ENSO Neutral periods.
- 1985, 1999, and 2012 appear to be the cases where lower Arctic Sea Ice Extent occured at the end of or during a La Nina event.
- 1995 and 2007 occurred at the start of a La Nina. Not likely that La Nina conditions significantly impacted the minimum ice extent.
- 2002 occurred near the beginning of an El Nino event with a full year of ENSO Neutral preceeding it.
- 2015 occurred a full year into an El Nino.
-
Echo_Alpha_Charlie at 17:39 PM on 22 January 2017Video: NASA’s Dr Gavin Schmidt on 2016 as the hottest year on record
Moderator Response:[PS] Picture/link only comment and suspected to be sockpuppet of earlier banned poster. Some people just dont know how to read the Comments policy.
[DB] Sock puppet confirmed and commenting privileges suspended. As will all future iterations, puppet.
-
Jose_X at 00:48 AM on 22 January 2017Comparing Global Temperature Predictions
Can you guys provide an update post 2016? How close is Hansen's prediction?
-
Glenn Tamblyn at 13:43 PM on 21 January 2017So what did-in the dinosaurs? An update.
Lionel.
Adding to Tom C's comment. The Author list for that paper he links to includes Walter Alvarez. It was he and his father Luis who first put forward the idea of the impact. -
Joel_Huberman at 10:49 AM on 21 January 2017So what did-in the dinosaurs? An update.
Thanks, Howard Lee, for a truly interesting article. I'm looking forward to future episodes of this fascinating story.
-
michael sweet at 10:36 AM on 21 January 2017So what did-in the dinosaurs? An update.
I found this article very interesting. It seems to me that scientists are obtaining new data from new scientific methods. Hopefully in a few years you will be able to write that the new data has all fit together and the solution explains the observed data.
If the Decan Traps turn out to be the primary cause of Dinosaur extinction it will be the second time in my life that this major point has been changed. This shows to me that scientists accept new explainations when new data is obtained.
-
Tom Curtis at 08:30 AM on 21 January 2017So what did-in the dinosaurs? An update.
Lionel A @1, the idea is not at all silly, and some research has been conducted into the possibility. A recent paper states:
"New constraints on the timing of the Cretaceous-Paleogene mass extinction and the Chicxulub impact, together with a particularly voluminous and apparently brief eruptive pulse toward the end of the “main-stage” eruptions of the Deccan continental flood basalt province suggest that these three events may have occurred within less than about a hundred thousand years of each other. Partial melting induced by the Chicxulub event does not provide an energetically plausible explanation for this coincidence, and both geochronologic and magnetic-polarity data show that Deccan volcanism was under way well before Chicxulub/Cretaceous-Paleogene time. However, historical data document that eruptions from existing volcanic systems can be triggered by earthquakes. Seismic modeling of the ground motion due to the Chicxulub impact suggests that the impact could have generated seismic energy densities of order 0.1–1.0 J/m^3 throughout the upper ~200 km of Earth’s mantle, sufficient to trigger volcanic eruptions worldwide based upon comparison with historical examples. Triggering may have been caused by a transient increase in the effective permeability of the existing deep magmatic system beneath the Deccan province, or mantle plume “head.” It is therefore reasonable to hypothesize that the Chicxulub impact might have triggered the enormous Poladpur, Ambenali, and Mahabaleshwar (Wai Subgroup) lava flows, which together may account for >70% of the Deccan Traps main-stage eruptions. This hypothesis
is consistent with independent stratigraphic, geochronologic, geochemical, and tectonic constraints, which combine to indicate that at approximately Chicxulub/Cretaceous-Paleogene time, a huge pulse of mantle plume–derived magma passed through the crust with little interaction and erupted to form the most extensive and voluminous lava
flows known on Earth. High-precision radioisotopic dating of the main-phase Deccan flood basalt formations may be able either to confirm or reject this hypothesis, which in turn might help to determine whether this singular outburst within the Deccan Traps (and possibly volcanic eruptions worldwide) contributed significantly to the CretaceousPaleogene extinction."(My emphasis)
As the emphasised sentences highlight, the eruptions associated with the Decan Traps started well before the Chicxulub impact, but that impact may well have significantly increased the lava flows at a later stage.
-
RenaissanceMan at 07:19 AM on 21 January 2017Increasing CO2 has little to no effect
[PS]@223: "The point of graphing is illustrate the data to maximum effect in the context."
The "context" of the Keeling Curve, as he presented it, is to emphasize the increase in atmospheric carbon dioxide.
By so making such an emphatic presentation, he utterly destroyed any perspective of the place of carbon dioxide vis a vis the total panoply of greenhouse gases, most particularly water vapor.
My graph demonstrates "maximum effect" of the "population explosion."
(snip) It "fills the page." I made it so to show the dishonesty of such exaggeration, like that of the Keeling Curve.
Moderator Response:[RH] Again, no accusations of dishonesty are allowed in these comment forums. How hard is that to understand?
Now beyond final warning. All further comments will be deleted.
-
RenaissanceMan at 07:10 AM on 21 January 2017Increasing CO2 has little to no effect
schaddenp@235: "In this I think the issue is more about role of government. The right wing struggles to envisiage a solution that does not involve large government intervention - be it carbon tax (another no-no word), cap-and-trade schemes etc."
Response: (snip) The obvious counterpart to that nasty "right wing" is the "left wing" which almost undoubtedly would elicit a warning from the moderator, who brooks no discouraging word of any left wingers. But right wingers are chastized instantly.
" As stupid as it sounds, the logic of "solutions to this problem are incompatiable with my values, ergo problem must not exist", I think plays a very real role in this."
Response: (snip) The logic of "don't take away our billions of research dollars" and the profound left-wing bias of contemporary academia likewise plays a very real role.
"However, most US citizens I know are academics, mostly scientists, so I may be underestimating prevalence of "wealth redistribution" phobics. (I gather these people dont mind redistribution of wealth from masses to a few extremely wealthy men - perhaps the old communist bogeyman lives on in US psyche)."
Response: (snip) "Wealth redistribution" is part and parcel of the left wing obsession of characterizing that "right wing" as greedy, mean-spirited, and completely uncaring about "the poor." On that topic, the book by a former liberal and college professor, titled Who Really Cares, shows that the left wing does not practice what it preaches. In other words, left wingers give less of everything, to everyone than the right wing.The final sentence written by schaddenp is socialist down to its core, claiming that the rich got that way by taking from the poor. It isn't remotely true, as proven throughout history. But the left wing never learns.
Moderator Response:[RH] You can't seem to figure out the commenting rules. And, no, they're not being only applied to you. If you read carefully, the rules are being applied equally to all commenters.
I think you're on your last and final warning at this point.
-
Kiwiiano at 06:47 AM on 21 January 2017So what did-in the dinosaurs? An update.
Lionel@1: perhaps more relevant is the thought that 65 million years ago the Deccan area would have been further south, possibly significantly, directly opposite where Mexico was. The shock waves of a massive impact may attenuate as they spread out but converge on the other side of the planet.
...just a thought?
-
Lionel A at 03:48 AM on 21 January 2017So what did-in the dinosaurs? An update.
I have been reading about this issue since it first became a hot topic (having walked into the caldera of Vesuvius in my early twenties sparked an interest in geology on top of interest in palaeontology since early years) and have pondered more recently on maybe the Chicxulub event triggered an eruption event on the other side of the globe seeing as the Deccan planes are almost opposite on the globe at a similar latitude.
Maybe it is a silly idea, but...
-
amoeba at 20:16 PM on 20 January 2017Prepare for reanimation of the zombie myth ‘no global warming since 2016’
@nigelj I am not sure you will be notified of this comment (and I don't know how to reach you elsewhere), but just in case you will: could you please update the Wikipedia global warming figure with the newly released 2017 datapoint? It looks like you did last several years. Thanks a lot.
-
One Planet Only Forever at 15:59 PM on 20 January 2017Video: NASA’s Dr Gavin Schmidt on 2016 as the hottest year on record
rocketeer@2
The NASA presentation of Arctic Sea Ice Minimums shows several noticable lows. The chart is developed form the NSIDC data.
Comparing them with Jan Nulls' presentation of ENSO events and magnitudes and NOAAs ONI which were the basis for Jan Nulls' presentation, there are several lows that do not correlate with strong La Nina events. For example:
- The lows of 1990, 1993 and 2005 were essentially ENSO Neutral periods.
- And the low of 1995 occured at the start of an El Nina event.
- 2002 and 2007 occured at the start of a La Nina, before the event could have a significant impact on the ice extent.
1985 and 2012 look like outliers of the potential for La Nina to be a signifcant factor in low Arctic Sea Ice Extent.
However, there may be connection between El Nino events and a low Artic extent occuring a year or two later, like 2017 is shaping up to be, a low arctic minimum with an ENSO Neutral or weak La Nina condition but shortly after a powerful El Nino.
-
bozzza at 13:01 PM on 20 January 2017Video: NASA’s Dr Gavin Schmidt on 2016 as the hottest year on record
I didn't relaise the tip of Western Antarctica was THAT close to South America: do they get boat people?
Moderator Response:[JH] Off topic.
-
scaddenp at 11:31 AM on 20 January 2017CO2 is coming from the ocean
Just adding a reference on C14 measurement "Observations and modelling of the global distribution and long-term trend of atmospheric 14CO2". This demonstrates dilution of atmospheric C14 by fossil fuel burning. Also one on impact of FF burning of C14 applications in the future.
-
scaddenp at 10:19 AM on 20 January 2017Increasing CO2 has little to no effect
RB - In my opinion, this is really only an objection to very small group, many conspiracy theorists etc. Letting data define our opinions is not something that comes very naturally to human, even scientists. I think for many, the predisposition to disbelieve global warming and then haunt denialist sites to reinforce the opinion is more socially driven - its not what my "tribe" believes in/ not what opinion-makers I follow says is true etc. But what then drives the opinion makers?
In this I think the issue is more about role of government. The right wing struggles to envisiage a solution that does not involve large government intervention - be it carbon tax (another no-no word), cap-and-trade schemes etc. International treaties are also difficult as soon as they involve obligations even if there is no wealth redistribution at international level. As stupid as it sounds, the logic of "solutions to this problem are incompatiable with my values, ergo problem must not exist", I think plays a very real role in this.
However, most US citizens I know are academics, mostly scientists, so I may be underestimating prevalence of "wealth redistribution" phobics. (I gather these people dont mind redistribution of wealth from masses to a few extremely wealthy men - perhaps the old communist bogeyman lives on in US psyche).
-
RedBaron at 09:44 AM on 20 January 2017Increasing CO2 has little to no effect
MA Roger,
Would you agree that
"we redistribute de facto the world's wealth by climate policy'. [1061]”
is the real source of the objections we find discussing AGW and particularly how we propose to mitigate AGW? -
MA Rodger at 10:00 AM on 19 January 2017Increasing CO2 has little to no effect
Tom Curtis @227,
I think 'misquotation' understates the what appears in Downing (2011) "World Empire and the Return of Jesus Christ". It is a total misrepresentation of Edenhoffer. The sentence in Simon Downing (2011) runs as follows:-
“And, as many of us have suspected all along, a UN IPCC (Intergovernmental Panel on Climate Control) official recently admitted that 'one has to free oneself from the illusion that international climate policy is environmental policy... we redistribute de facto the world's wealth by climate policy'. [1061]”
As I say @226, the name of the reference [1061] is not available from the link so it may be that Downing is not responsible for the fraud. And within this quote from Downing, the Downing mis-quote, bar the lower-case 'w' and the two extra fullstops indicating missing text, it is identical to the (mis)quote presented by RenaissanceMan @210.
Moderator Response:[PS] No accusations of fraud please.
-
gws at 08:49 AM on 19 January 2017Increasing CO2 has little to no effect
Tom @212: fwiw, the Edenhoffer quote translation is correct. But more importantly, thanks for demonstrating how the denialists use chery picked, out-of-context, and rearranged "quotation" to mislead.
-
Tom Curtis at 07:10 AM on 19 January 2017Increasing CO2 has little to no effect
RM @223:
1) The most misleading aspect of the new sample graph is the heading, not the choice of window of the y-axis chosen.
2) While true that non-informed people often have a false assumption that graphs always include the origin, and can be misled by their false assumption. That can be partly countered by using of breakpoints in the graph as in this example:
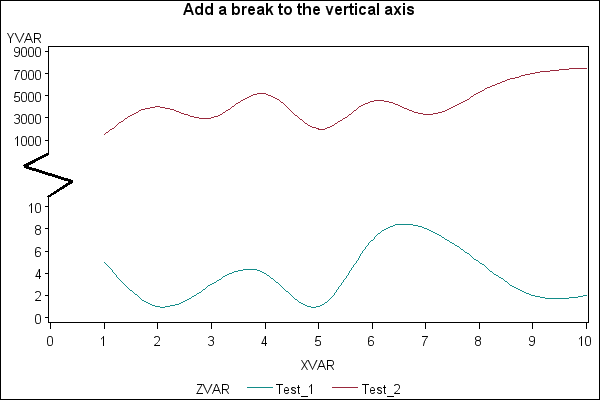
Still better, it should be countered by better choice of sample graphs in education; and by always emphasizing that no graph interprets itself - that you always need to look at the axies, the units, heading and text associated with the graph to understand it. It should not be pandered to by choosing a y-axis window so large that the variation in the data cannot be seen.
3) There has been about an 80 ppmv increase in CO2 over the last fifty odd years, not 1.6 ppmv as you claim.
4) The claimed 15,000 ppmv of greenhouse gases is a furphy (see preceding post).
-
Tom Curtis at 06:58 AM on 19 January 2017Increasing CO2 has little to no effect
Turning to RM's graphing examples, his example plotting CO2 concentration with his two adjustements (@209) shows a number of obvious flaws.
Firstly, and most obviously, we may be interested in CO2 concentration quite independently of our interest in the Total Greenhouse Effect. That the graph of CO2 concentration (the Keeling curve) does not include the primary contributor to the Total Greenhouse Effect is, therefore, irrelevant to its usefulness. Indeed, if we are exclusively interested in the Total Greenhouse Effect, we are better plotting that, with changes to it, rather than only the CO2 concentration. Consequently, the best that can be said for RM's graph is he plotted the wrong value for what he was interested in.
Far worse, for the actual graph he plots, is that RM overstates the value of water vapour concentration in ppmv by nearly a factor of 4. The concentration of water vapour, averaged across the atmosphere, is about 4,000 ppmv, not the 15,000 ppmv shown by RM. The 15,000 ppmv is indeed a reasonable approximation of the average concentration of water vapour at the surface; but the radiative interaction that gives us the greenhouse effect does not occur exclusively (or even significantly) at the surface. Rather, it occurs at altitude, and unlike CO2, the concentration of water vapour falls rapidly with altitude:

(Note: graph is of model values, for actual observations see preceding two links.)
So, not only does RM grossly inflate the graph to obscure important detail by including the irrelevant (for most purposes) H2O concentration, but he then includes an inflated value of the H2O concentration.
Finally, if RM was interested in the Total Greenhouse Effect, he ought simply to have plotted the Total Greenhouse Effect. The contribution of H2O and CO2 to the Total Greenhouse Effect is not proportional to their concentration. Indeed, though H2O has a stronger greenhouse effect overall, it has a very much weaker effect per molecule. (That is partly because the H2O concentration is closer to radiative saturation, but mostly due to the lower, and hence much warmer altitudes from which H2O radiates to space.) Schmidt et al (2010) showed that circa 1990, of the Total Greenhouse Effect, CO2 contributes about 20%, gaseous H2O a further 50%, and H2O in the form of clouds an additional 25%, with the remainder being contributed by minor greenhouse gases.
For those unfamiliar with the term, the Total Greenhouse Effect is the difference between the "Thermal Up Surface" and the "Thermal Outgoing TOA" as shown on this energy balance graph from the IPCC AR5:
 That is, by best modern estimate it is about 159 W/m^2, though Schmidt et al cite 155 W/m^2 from an earlier source.
Of that, about 3.38 W/m^2, or 2.125% is the increase in radiative forcing from all anthropogenic greenhouse gases. It is very likely that approximately 2% further is due to the increase in the H2O contribution that has resulted from the increase in temperature leading to an average increase in global mean water vapour concentration (as discussed by HK @224). Whichever is used, it is significantly more than the misleading 0.8% increase not shown due to poor scale choice in RM's fundamentally misleading preferred graph.
-
Increasing CO2 has little to no effect
When what you are attempting to convey is the _change_ in a value, filling the graph is the only reasonable choice. Padding the graph with unchanging values is in such situations misleading to the point (in many cases) of misinformation.
-
rocketeer at 02:51 AM on 19 January 2017Video: NASA’s Dr Gavin Schmidt on 2016 as the hottest year on record
@jja just eyeballing the records from NSIDC http://nsidc.org/arcticseaicenews/charctic-interactive-sea-ice-graph/ it appears that, if anything, La Nina years are associated with less Arctic sea ice than El Nino years. The record low year 2012 was a La Nina year.
-
jja at 01:38 AM on 19 January 2017Video: NASA’s Dr Gavin Schmidt on 2016 as the hottest year on record
We will soon find out that his assertion that there is no ENSO driver for north and south pole sea ice anomalies this year to be incorrect.
-
JohnSeers at 01:37 AM on 19 January 2017Increasing CO2 has little to no effect
#223 @Renaissance Man
"Reference follows:" - Where is the reference?
Your example graph (Population Explosion) demonstrates clearly why it is often a good idea to not start the y axis at 0. If you had done we would have to scroll up or down about 200 metres to see the whole thing. I think you would admit that is impractical?
Prev 416 417 418 419 420 421 422 423 424 425 426 427 428 429 430 431 Next


