


 Arguments


Recent Comments
Prev 419 420 421 422 423 424 425 426 427 428 429 430 431 432 433 434 Next
Comments 21301 to 21350:
-
Glenn Tamblyn at 13:43 PM on 21 January 2017So what did-in the dinosaurs? An update.
Lionel.
Adding to Tom C's comment. The Author list for that paper he links to includes Walter Alvarez. It was he and his father Luis who first put forward the idea of the impact. -
Joel_Huberman at 10:49 AM on 21 January 2017So what did-in the dinosaurs? An update.
Thanks, Howard Lee, for a truly interesting article. I'm looking forward to future episodes of this fascinating story.
-
michael sweet at 10:36 AM on 21 January 2017So what did-in the dinosaurs? An update.
I found this article very interesting. It seems to me that scientists are obtaining new data from new scientific methods. Hopefully in a few years you will be able to write that the new data has all fit together and the solution explains the observed data.
If the Decan Traps turn out to be the primary cause of Dinosaur extinction it will be the second time in my life that this major point has been changed. This shows to me that scientists accept new explainations when new data is obtained.
-
Tom Curtis at 08:30 AM on 21 January 2017So what did-in the dinosaurs? An update.
Lionel A @1, the idea is not at all silly, and some research has been conducted into the possibility. A recent paper states:
"New constraints on the timing of the Cretaceous-Paleogene mass extinction and the Chicxulub impact, together with a particularly voluminous and apparently brief eruptive pulse toward the end of the “main-stage” eruptions of the Deccan continental flood basalt province suggest that these three events may have occurred within less than about a hundred thousand years of each other. Partial melting induced by the Chicxulub event does not provide an energetically plausible explanation for this coincidence, and both geochronologic and magnetic-polarity data show that Deccan volcanism was under way well before Chicxulub/Cretaceous-Paleogene time. However, historical data document that eruptions from existing volcanic systems can be triggered by earthquakes. Seismic modeling of the ground motion due to the Chicxulub impact suggests that the impact could have generated seismic energy densities of order 0.1–1.0 J/m^3 throughout the upper ~200 km of Earth’s mantle, sufficient to trigger volcanic eruptions worldwide based upon comparison with historical examples. Triggering may have been caused by a transient increase in the effective permeability of the existing deep magmatic system beneath the Deccan province, or mantle plume “head.” It is therefore reasonable to hypothesize that the Chicxulub impact might have triggered the enormous Poladpur, Ambenali, and Mahabaleshwar (Wai Subgroup) lava flows, which together may account for >70% of the Deccan Traps main-stage eruptions. This hypothesis
is consistent with independent stratigraphic, geochronologic, geochemical, and tectonic constraints, which combine to indicate that at approximately Chicxulub/Cretaceous-Paleogene time, a huge pulse of mantle plume–derived magma passed through the crust with little interaction and erupted to form the most extensive and voluminous lava
flows known on Earth. High-precision radioisotopic dating of the main-phase Deccan flood basalt formations may be able either to confirm or reject this hypothesis, which in turn might help to determine whether this singular outburst within the Deccan Traps (and possibly volcanic eruptions worldwide) contributed significantly to the CretaceousPaleogene extinction."(My emphasis)
As the emphasised sentences highlight, the eruptions associated with the Decan Traps started well before the Chicxulub impact, but that impact may well have significantly increased the lava flows at a later stage.
-
RenaissanceMan at 07:19 AM on 21 January 2017Increasing CO2 has little to no effect
[PS]@223: "The point of graphing is illustrate the data to maximum effect in the context."
The "context" of the Keeling Curve, as he presented it, is to emphasize the increase in atmospheric carbon dioxide.
By so making such an emphatic presentation, he utterly destroyed any perspective of the place of carbon dioxide vis a vis the total panoply of greenhouse gases, most particularly water vapor.
My graph demonstrates "maximum effect" of the "population explosion."
(snip) It "fills the page." I made it so to show the dishonesty of such exaggeration, like that of the Keeling Curve.
Moderator Response:[RH] Again, no accusations of dishonesty are allowed in these comment forums. How hard is that to understand?
Now beyond final warning. All further comments will be deleted.
-
RenaissanceMan at 07:10 AM on 21 January 2017Increasing CO2 has little to no effect
schaddenp@235: "In this I think the issue is more about role of government. The right wing struggles to envisiage a solution that does not involve large government intervention - be it carbon tax (another no-no word), cap-and-trade schemes etc."
Response: (snip) The obvious counterpart to that nasty "right wing" is the "left wing" which almost undoubtedly would elicit a warning from the moderator, who brooks no discouraging word of any left wingers. But right wingers are chastized instantly.
" As stupid as it sounds, the logic of "solutions to this problem are incompatiable with my values, ergo problem must not exist", I think plays a very real role in this."
Response: (snip) The logic of "don't take away our billions of research dollars" and the profound left-wing bias of contemporary academia likewise plays a very real role.
"However, most US citizens I know are academics, mostly scientists, so I may be underestimating prevalence of "wealth redistribution" phobics. (I gather these people dont mind redistribution of wealth from masses to a few extremely wealthy men - perhaps the old communist bogeyman lives on in US psyche)."
Response: (snip) "Wealth redistribution" is part and parcel of the left wing obsession of characterizing that "right wing" as greedy, mean-spirited, and completely uncaring about "the poor." On that topic, the book by a former liberal and college professor, titled Who Really Cares, shows that the left wing does not practice what it preaches. In other words, left wingers give less of everything, to everyone than the right wing.The final sentence written by schaddenp is socialist down to its core, claiming that the rich got that way by taking from the poor. It isn't remotely true, as proven throughout history. But the left wing never learns.
Moderator Response:[RH] You can't seem to figure out the commenting rules. And, no, they're not being only applied to you. If you read carefully, the rules are being applied equally to all commenters.
I think you're on your last and final warning at this point.
-
Kiwiiano at 06:47 AM on 21 January 2017So what did-in the dinosaurs? An update.
Lionel@1: perhaps more relevant is the thought that 65 million years ago the Deccan area would have been further south, possibly significantly, directly opposite where Mexico was. The shock waves of a massive impact may attenuate as they spread out but converge on the other side of the planet.
...just a thought?
-
Lionel A at 03:48 AM on 21 January 2017So what did-in the dinosaurs? An update.
I have been reading about this issue since it first became a hot topic (having walked into the caldera of Vesuvius in my early twenties sparked an interest in geology on top of interest in palaeontology since early years) and have pondered more recently on maybe the Chicxulub event triggered an eruption event on the other side of the globe seeing as the Deccan planes are almost opposite on the globe at a similar latitude.
Maybe it is a silly idea, but...
-
amoeba at 20:16 PM on 20 January 2017Prepare for reanimation of the zombie myth ‘no global warming since 2016’
@nigelj I am not sure you will be notified of this comment (and I don't know how to reach you elsewhere), but just in case you will: could you please update the Wikipedia global warming figure with the newly released 2017 datapoint? It looks like you did last several years. Thanks a lot.
-
One Planet Only Forever at 15:59 PM on 20 January 2017Video: NASA’s Dr Gavin Schmidt on 2016 as the hottest year on record
rocketeer@2
The NASA presentation of Arctic Sea Ice Minimums shows several noticable lows. The chart is developed form the NSIDC data.
Comparing them with Jan Nulls' presentation of ENSO events and magnitudes and NOAAs ONI which were the basis for Jan Nulls' presentation, there are several lows that do not correlate with strong La Nina events. For example:
- The lows of 1990, 1993 and 2005 were essentially ENSO Neutral periods.
- And the low of 1995 occured at the start of an El Nina event.
- 2002 and 2007 occured at the start of a La Nina, before the event could have a significant impact on the ice extent.
1985 and 2012 look like outliers of the potential for La Nina to be a signifcant factor in low Arctic Sea Ice Extent.
However, there may be connection between El Nino events and a low Artic extent occuring a year or two later, like 2017 is shaping up to be, a low arctic minimum with an ENSO Neutral or weak La Nina condition but shortly after a powerful El Nino.
-
bozzza at 13:01 PM on 20 January 2017Video: NASA’s Dr Gavin Schmidt on 2016 as the hottest year on record
I didn't relaise the tip of Western Antarctica was THAT close to South America: do they get boat people?
Moderator Response:[JH] Off topic.
-
scaddenp at 11:31 AM on 20 January 2017CO2 is coming from the ocean
Just adding a reference on C14 measurement "Observations and modelling of the global distribution and long-term trend of atmospheric 14CO2". This demonstrates dilution of atmospheric C14 by fossil fuel burning. Also one on impact of FF burning of C14 applications in the future.
-
scaddenp at 10:19 AM on 20 January 2017Increasing CO2 has little to no effect
RB - In my opinion, this is really only an objection to very small group, many conspiracy theorists etc. Letting data define our opinions is not something that comes very naturally to human, even scientists. I think for many, the predisposition to disbelieve global warming and then haunt denialist sites to reinforce the opinion is more socially driven - its not what my "tribe" believes in/ not what opinion-makers I follow says is true etc. But what then drives the opinion makers?
In this I think the issue is more about role of government. The right wing struggles to envisiage a solution that does not involve large government intervention - be it carbon tax (another no-no word), cap-and-trade schemes etc. International treaties are also difficult as soon as they involve obligations even if there is no wealth redistribution at international level. As stupid as it sounds, the logic of "solutions to this problem are incompatiable with my values, ergo problem must not exist", I think plays a very real role in this.
However, most US citizens I know are academics, mostly scientists, so I may be underestimating prevalence of "wealth redistribution" phobics. (I gather these people dont mind redistribution of wealth from masses to a few extremely wealthy men - perhaps the old communist bogeyman lives on in US psyche).
-
RedBaron at 09:44 AM on 20 January 2017Increasing CO2 has little to no effect
MA Roger,
Would you agree that
"we redistribute de facto the world's wealth by climate policy'. [1061]”
is the real source of the objections we find discussing AGW and particularly how we propose to mitigate AGW? -
MA Rodger at 10:00 AM on 19 January 2017Increasing CO2 has little to no effect
Tom Curtis @227,
I think 'misquotation' understates the what appears in Downing (2011) "World Empire and the Return of Jesus Christ". It is a total misrepresentation of Edenhoffer. The sentence in Simon Downing (2011) runs as follows:-
“And, as many of us have suspected all along, a UN IPCC (Intergovernmental Panel on Climate Control) official recently admitted that 'one has to free oneself from the illusion that international climate policy is environmental policy... we redistribute de facto the world's wealth by climate policy'. [1061]”
As I say @226, the name of the reference [1061] is not available from the link so it may be that Downing is not responsible for the fraud. And within this quote from Downing, the Downing mis-quote, bar the lower-case 'w' and the two extra fullstops indicating missing text, it is identical to the (mis)quote presented by RenaissanceMan @210.
Moderator Response:[PS] No accusations of fraud please.
-
gws at 08:49 AM on 19 January 2017Increasing CO2 has little to no effect
Tom @212: fwiw, the Edenhoffer quote translation is correct. But more importantly, thanks for demonstrating how the denialists use chery picked, out-of-context, and rearranged "quotation" to mislead.
-
Tom Curtis at 07:10 AM on 19 January 2017Increasing CO2 has little to no effect
RM @223:
1) The most misleading aspect of the new sample graph is the heading, not the choice of window of the y-axis chosen.
2) While true that non-informed people often have a false assumption that graphs always include the origin, and can be misled by their false assumption. That can be partly countered by using of breakpoints in the graph as in this example:
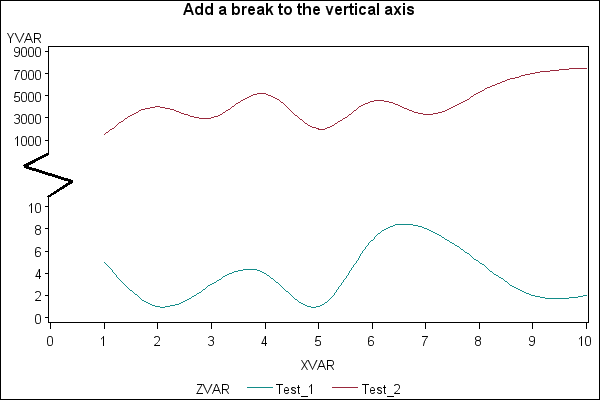
Still better, it should be countered by better choice of sample graphs in education; and by always emphasizing that no graph interprets itself - that you always need to look at the axies, the units, heading and text associated with the graph to understand it. It should not be pandered to by choosing a y-axis window so large that the variation in the data cannot be seen.
3) There has been about an 80 ppmv increase in CO2 over the last fifty odd years, not 1.6 ppmv as you claim.
4) The claimed 15,000 ppmv of greenhouse gases is a furphy (see preceding post).
-
Tom Curtis at 06:58 AM on 19 January 2017Increasing CO2 has little to no effect
Turning to RM's graphing examples, his example plotting CO2 concentration with his two adjustements (@209) shows a number of obvious flaws.
Firstly, and most obviously, we may be interested in CO2 concentration quite independently of our interest in the Total Greenhouse Effect. That the graph of CO2 concentration (the Keeling curve) does not include the primary contributor to the Total Greenhouse Effect is, therefore, irrelevant to its usefulness. Indeed, if we are exclusively interested in the Total Greenhouse Effect, we are better plotting that, with changes to it, rather than only the CO2 concentration. Consequently, the best that can be said for RM's graph is he plotted the wrong value for what he was interested in.
Far worse, for the actual graph he plots, is that RM overstates the value of water vapour concentration in ppmv by nearly a factor of 4. The concentration of water vapour, averaged across the atmosphere, is about 4,000 ppmv, not the 15,000 ppmv shown by RM. The 15,000 ppmv is indeed a reasonable approximation of the average concentration of water vapour at the surface; but the radiative interaction that gives us the greenhouse effect does not occur exclusively (or even significantly) at the surface. Rather, it occurs at altitude, and unlike CO2, the concentration of water vapour falls rapidly with altitude:

(Note: graph is of model values, for actual observations see preceding two links.)
So, not only does RM grossly inflate the graph to obscure important detail by including the irrelevant (for most purposes) H2O concentration, but he then includes an inflated value of the H2O concentration.
Finally, if RM was interested in the Total Greenhouse Effect, he ought simply to have plotted the Total Greenhouse Effect. The contribution of H2O and CO2 to the Total Greenhouse Effect is not proportional to their concentration. Indeed, though H2O has a stronger greenhouse effect overall, it has a very much weaker effect per molecule. (That is partly because the H2O concentration is closer to radiative saturation, but mostly due to the lower, and hence much warmer altitudes from which H2O radiates to space.) Schmidt et al (2010) showed that circa 1990, of the Total Greenhouse Effect, CO2 contributes about 20%, gaseous H2O a further 50%, and H2O in the form of clouds an additional 25%, with the remainder being contributed by minor greenhouse gases.
For those unfamiliar with the term, the Total Greenhouse Effect is the difference between the "Thermal Up Surface" and the "Thermal Outgoing TOA" as shown on this energy balance graph from the IPCC AR5:
 That is, by best modern estimate it is about 159 W/m^2, though Schmidt et al cite 155 W/m^2 from an earlier source.
Of that, about 3.38 W/m^2, or 2.125% is the increase in radiative forcing from all anthropogenic greenhouse gases. It is very likely that approximately 2% further is due to the increase in the H2O contribution that has resulted from the increase in temperature leading to an average increase in global mean water vapour concentration (as discussed by HK @224). Whichever is used, it is significantly more than the misleading 0.8% increase not shown due to poor scale choice in RM's fundamentally misleading preferred graph.
-
Increasing CO2 has little to no effect
When what you are attempting to convey is the _change_ in a value, filling the graph is the only reasonable choice. Padding the graph with unchanging values is in such situations misleading to the point (in many cases) of misinformation.
-
rocketeer at 02:51 AM on 19 January 2017Video: NASA’s Dr Gavin Schmidt on 2016 as the hottest year on record
@jja just eyeballing the records from NSIDC http://nsidc.org/arcticseaicenews/charctic-interactive-sea-ice-graph/ it appears that, if anything, La Nina years are associated with less Arctic sea ice than El Nino years. The record low year 2012 was a La Nina year.
-
jja at 01:38 AM on 19 January 2017Video: NASA’s Dr Gavin Schmidt on 2016 as the hottest year on record
We will soon find out that his assertion that there is no ENSO driver for north and south pole sea ice anomalies this year to be incorrect.
-
JohnSeers at 01:37 AM on 19 January 2017Increasing CO2 has little to no effect
#223 @Renaissance Man
"Reference follows:" - Where is the reference?
Your example graph (Population Explosion) demonstrates clearly why it is often a good idea to not start the y axis at 0. If you had done we would have to scroll up or down about 200 metres to see the whole thing. I think you would admit that is impractical?
-
Tom Curtis at 22:53 PM on 18 January 2017Increasing CO2 has little to no effect
MA Rodger @226, I consider the Downing quote to be a misquotation based on the fact that the selection shown in the search result shows the phrase "one has to free oneself" preceding the phrase "we redistribute", ie, the reverse of order in the actual quote. That may be a coincidence, but that is unlikely. Further, a fuller search string pushes Downing's book much further down the results (if it appears at all), which suggests Downing cannot have quoted the full passage verbatim.
-
MA Rodger at 22:34 PM on 18 January 2017Increasing CO2 has little to no effect
Concerning the fraudulent Ottmar Edenhofer quotation reproduced @211.
The quote appeared to be presented verbatum (bar a "..."?) in Simon Downing (2011) "World Empire and the Return of Jesus Christ." p338? (I note Tom Curtis @212 suggested the quote in this source was not identical to that presented @211. Sadly the google review I link to has limited personal useage so I cannot double-check.) The quote appears in the book as a referenced quote but unfortunately the page setting out this reference #1061 (page 515) is not available in the google review available. Or that was the message I took away before I overstayed my personal welcome in the google review. It would thus take a sight of p515 to be sure this was the source of the fraud, so if anyone has a copy of this book on their bookshelf....
-
Increasing CO2 has little to no effect
Note: My post #224 was a response to #222.
-
Increasing CO2 has little to no effect
"Atmospheric CO2 is relatively constant worldwide, in very dramatic contrast to water vapor. This clearly refutes the "water follows CO2" claim."
Why does the water vapour fluctuate so much while CO2 doesn't?
Because the local temperature sets an upper limit (but not a lower!) to how much water vapour the local atmosphere can hold.
CO2 and other forcings (including the Sun) control the global temperature and therefore the global amount of water vapour, which act as a strong climate feedback. The strong temperature dependency of water vapour also explains why its concentration drops so rapidly with altitude. If it didn't, but was a well-mixed gas like CO2, its warming impact would be so strong that the Earth would be inhabitable to all higher forms of life.BTW, the atmosphere as a whole contains about 4000 ppm of water vapour, not 15,400 as figure 2 in your post #209 claims.
Moderator Response:[PS] RM also fails to notice that most of the planet is covered by water.
-
RenaissanceMan at 12:30 PM on 18 January 2017CO2 is coming from the ocean
Natural sources of carbon dioxide were reported to be 770,000 metric tons by the IPCC in 2001. http://www.eia.gov/oiaf/1605/archive/gg04rpt/pdf/tbl3.pdf
This far surpasses the anthropogenic output.
Moderator Response:[PS] Conveniently ignoring natural sinks as well available from same source. In short, more rhetoric and not addressing pH, isotopic composition of CO2 in atmosphere, O2 changed raised here. Your response is yet another myth debunked here.
-
RenaissanceMan at 12:23 PM on 18 January 2017Increasing CO2 has little to no effect
[PS]@217
"The numerous text books and guides on scientific graphing do not support your argument. Provide a reference which does. Inappropriate scales instead are the common tools of misinformation."
Reference follows:
Population Explosion

Lay public can easily be misled by graphs which appear to show rapid changes, which when subjected to more thoughtful, more professional analysis, are not rapid changes at all. For example, 1.36 parts per million increase in atmospheric carbon dioxide, over the last fifty years, is an extremely small annual change on the basis of 15,500 parts per million of total greenhouse gas.
Moderator Response:[PS] The point of graphing is illustrate the data to maximum effect in the context. What is "insignificant" cannot be read from a graph - it can only be determined in larger context. A doubling of CO2 add nearly 4W/m2 to earth surface radiation and in climate terms that is significant. See myth "CO2 is insignificant trace gas". Please look at water vapour question at the link provided.
We have a large list of myths. See "arguments" on top left. Please read and be prepared to provide evidence in support of arguments before simply mindlessly repeating yet another one.
At moment, your discourse is sloganeering (repeating long debunked myths, assertions without backing), inflammatory tone, and frequently offtopic. Please pickup up your act.
-
RenaissanceMan at 12:05 PM on 18 January 2017Increasing CO2 has little to no effect
HK @218:
#215:
"CO2 is the thermostat that sets where the concentration of water in the atmosphere is. Water follows the CO2."Indeed!
Andrew Lacis et al did a model experiment where they removed all the greenhouse gases in the Earth’s atmosphere except for water vapour."Response: Atmospheric CO2 is relatively constant worldwide, in very dramatic contrast to water vapor. This clearly refutes the "water follows CO2" claim.
The claim of a "model" which spans a fifty year time span must be suspect because past models have done so very poorly at prediction of temperature changes.
The great deserts of our planet are not dry because there is no CO2 present across them. Nor are the wettest parts of the planet located at high CO2 environments. Indeed!
Moderator Response:[JH] Sloganeering snipped. Sloganeering is prohibited by the SkS Comments Policy.
Warning #1
Please note that posting comments here at SkS is a privilege, not a right. This privilege can be rescinded if the posting individual treats adherence to the Comments Policy as optional, rather than the mandatory condition of participating in this online forum.
Please take the time to review the policy and ensure future comments are in full compliance with it. Thanks for your understanding and compliance in this matter.
-
scaddenp at 10:35 AM on 18 January 2017Fact Check: Rex Tillerson on Climate Risks
Paul D There is some evidence of ocean warming weakening the ice shelf from below (eg this paper) with Pine Island and this paper on Larsen ice shelves. I would guess similar situation with Brunt. As to when it will calve, then I think it would be a brave man that made any bets on that.
-
Tom Curtis at 08:02 AM on 18 January 2017Increasing CO2 has little to no effect
RM @210, claims that "Degassification is a primary natural source of carbon dioxide. It leaves the ocean, rather than dissolving in it." That contrasts with the findings Sabine et al (2004) who find that:
"The global ocean inventory estimated here permits us, for the first time, to place observational constraints on the anthropogenic CO2 budget for the anthropocene. In particular, it permits us to estimate the magnitude of the time integrated terrestrial carbon balance which cannot be easily deduced from observations. We first consider the anthropogenic budget terms that are relatively well constrained. Over the anthropocene, about 244±20 Pg C was emitted into the atmosphere as a result of the burning of fossil fuels and cement production. About two thirds of these emissions have remained in the atmosphere, increasing the atmospheric CO2 concentration from about 281±2 ppm in 1800 (20) to 359±0.4 ppm in 1994 (21) translating to an increase of 165 Pg C. Subtracting our ocean inventory estimate of 118±19 Pg C and the atmospheric inventory change from the integrated fossil fuel emissions constrains the net carbon balance of the terrestrial biosphere to be a net source of 39±28 Pg C for the period between 1800 and 1994.Therefore the ocean has constituted the only true net sink for anthropogenic CO2 over the last 200 years. Without this oceanic uptake, atmospheric CO2 would be about 55 ppm higher today than what is currently observed (~370 ppm)."
This is one of a large number of similar studies with similar findings. Against these evidence based, peer reviewed studies, RM provides only the evidence of his own assertion (again).
Moderator Response:[PS] The "CO2 is from the ocean" myth is debunked in this article.
RM - if you disagree with the evidence presented there, then present your evidence on that thread and not here.
-
Tom Curtis at 07:43 AM on 18 January 2017Increasing CO2 has little to no effect
RM @214 objects to my aside about his name. For his information, I have the evidence of his posts on Skeptical Science of a massive incompetence when it comes to climate science that clearly disprove any claim he has to a broad competence across most fields of human intellectual and artistic endeavour, ie, to be a renaissance man. Of course, he can disprove my comment by naming any two academic fields to which he has made a significant contribution - with full citations of at least one peer reviewed paper in each. Or an academic field with citation to peer reviewed paper and refer his notable contribution to one of the arts - with evidence. The purported anonomous endorsement of a person of unknown competence is no evidence to his vaunting claim at all.
A case in point, as regards his incompetence in climate science is his claim @209 regarding the proper usage in scientific graphs, where he says that the Keeling Curve "... is blatantly dishonest ..." in part because "... it does not have a zero base". In fact scientific practise does not require the inclusion of the zero base as is easilly checked by looking at scientific websites such as the Laboratory of Atmospheric and Space Physics (LASP) at the University of Colorado, whose page on Total Solar Irradiance includes three graphs (the first of which is shown below), with lowest values on the y-axis of 1360.7, 1357, and 1360 W/m^2 respectively.

Or at scientific papers such as "Effects of freshwater and saltwater adaptation and dietary salt on fluid compartments, blood pressure, and venous capacitance in trout" which shows as figure 2, a graph with three parts, only one of which shows zero as the lowest value on the y-axis:

The reason for the practice of excluding the origin is simple. Graphs are intended to succintly display data. To do so they must be readable, and often including the origin will make that impossible by so compressing the display of the variation as to make it invisible. (Indeed, making the variation invisible is clearly RM in his second graph @209.)
So, not only is RM wrong about graphs - he is demonstrably wrong. Worse, he would be known to be wrong by anybody familiar with scientific literature (as opposed to the anti AGW pseudoscience sites that are obviously his main source of information). His compelling argument in favour of his view @217 that "No, you [ie, Michael Sweet] are mistaken" carries, in the end, no evidentiary weight.
Moderator Response:[PS] Enough. Stick to the topic
-
michael sweet at 06:19 AM on 18 January 2017Increasing CO2 has little to no effect
Renaissance Man,
The default setting on Excell is to fill the page with the graph and not show the zero. Why would it be the default setting if it were incorrect? Are you suggesting Microsoft programmers do not know how to make a graph? You are obviously not familiar with making graphs of data (I worked in industry for 20 years and had to send graphs to the USFDA. The FDA requires you fill the page with the data.) I used Denial Depot to make my point that your claim that the zero has to be included is incorrect. Dr. Inferno shows what that argument leads to.
If there were no CO2 in the atmosphere it would get colder. That would cause the water to rain out. Less water would make it even colder. In the end all the water would rain out and the Earth would freeze. The CO2 controls how much water evaporates into the atmsphere. The water is not independent of the CO2. Water concentration is controlled by the CO2 concentration.
At the top of the atmosphere, where the greenhouse effect causes it to get warmer, there is very little water vapor. It is too cold and the water rains out. CO2 does not rain out, it is stable as a gas at low temperatures. You need to regraph your data showing the CO2 and water concentrations at about 6km above the surface. You will find that the CO2 determines the amount of heating from the greenhouse effect.
This data is posted elsewhere on Skeptical Science. If you ask for new information I will help you look it up. When you make baseless claims it is not worth the effort.
I will not post again on this thread. Comments like these just gum up the board.
-
Increasing CO2 has little to no effect
#215:
"CO2 is the thermostat that sets where the concentration of water in the atmosphere is. Water follows the CO2."Indeed!
Andrew Lacis et al did a model experiment where they removed all the greenhouse gases in the Earth’s atmosphere except for water vapour.
The end result was something close to snowball Earth conditions, with a global temperature dropping to about -20°C, far colder than any ice age has been since the late Precambrian. Most of this cooling was caused by feedbacks like increased albedo and the loss of 90% of the water vapour.
This figure from the paper shows how the temperature and other parameters changed during the experiment.
-
RenaissanceMan at 06:00 AM on 18 January 2017Increasing CO2 has little to no effect
michael sweet@215:
"Denial Depot has an entire post on how Skeptical Science adjusts graphs like you state. Perhaps you can elaborate on how the CO2 graph should be made. Of course, it is a sham science site, but it has funny stuff."
1. How is it that you can make fun of the opposition here, but nobody is permitted to make fun of your theories and hypotheses? The moderator(s) would quickly come down on anyone daring to call climate change "sham science."
[PS] The moderator would come down quickly on accusation of fraud but not on arguments against arguments that are backed in scientific way.
2. I just posted the proper graph, which of course includes water vapor, the dominant greenhouse gas. The resultant greenhouse gas "curve" is about as flat as a pool table.
"I teach Science in High School and College and if a student were to submit the CO2 graph with zero in the Y axis I would take off points because they did not fill the page with their graph."
Because you teach in such a manner does not remotely make it right. I have never heard of such a trivial argument as "fill(ing) the page" with a graph. How about writing bigger! That should be neat. I repeat, the objective is information and its clear communication. Perspective is an essential component of communication.
"You are mistaken with your assertion that the zero has to be included."
No, you are mistaken when you assert that a page must be filled with a graph, and when you clearly believe that exaggeration is meaningless.
[PS] The numerous text books and guides on scientific graphing do not support your argument. Provide a reference which does. Inappropriate scales instead are the common tools of misinformation. A simple example would be to plot temperature over last 1million years in Kelvin and insist on graph starting at zero. This gives a flat line for all intents and purposes so ice ages arent significant right?
"CO2 is the thermostat that sets where the concentration of water in the atmosphere is. Water follows the CO2."
You should not be teaching science. You don't understand the vapor pressure/temperature relationship at all. Water doesn't "follow" CO2 or air. It really can exist independently, as a function of temperature and pressure.
Prev 1 2 3 4 5
Moderator Response:[PS] This discussion is skirting the edges of comments policy by both sides. Would everyone please read the policy and stick to the science.
The main "substance" of RM's argument is that about water vapour. This myth is addressed in this article. Please read the article and comment there. Followups to RM on water vapour go there too.
RM - please state your arguments in a line scientific way and keep the rhetoric for the public bar. By this, I mean you need to start backing your assertion with references. Starting with "You don't understand the vapor pressure/temperature relationship at all." in the appropriate thread.
Ideally you quote and reference the science paper or IPCC statement you disagree with, why you disagree and provide data/references to back it. Start with why you think the science has it wrong on Clausius-Clapeyron.
-
Tom Dayton at 05:58 AM on 18 January 2017Increasing CO2 has little to no effect
Renaissance Man, you claimed: "As to CO2 being "forcing," infrared radiation is absorbed by water vapor and by carbon dioxide in virtually identical spectra, which I shall not bother to reproduce here."
You were incorrect on two counts:
1. CO2 increase indeed is a forcing, but water vapor increases are a feedback to warming, not a forcing, as Michael Sweet pointed out to you. Read the post "Explaining how the water vapor greenhouse effect works"--first its Basic tabbed pane, then its Intermediate tabbed pane. If you want to argue/discuss/query further on that topic, do so in the comment thread on that post, not this one.
2. CO2 and H2O absorption do not entirely overlap. From physicist and historian Spencer Weart's "Discovery of Global Warming":
The early experiments that sent radiation through gases in a tube, measuring bands of the spectrum at sea-level pressure and temperature, had been misleading. The bands seen at sea level were actually made up of overlapping spectral lines, which in the primitive early instruments had been smeared out into broad bands. Improved physics theory and precise laboratory measurements in the 1940s and after encouraged a new way of looking at the absorption. Scientists were especially struck to find that at low pressure and temperature, each band resolved into a cluster of sharply defined lines, like a picket fence, with gaps between the lines where radiation would get through.(24) As Hulburt and Callendar had claimed, the most important CO2 absorption lines did not lie exactly on top of water vapor lines. Instead of two overlapping bands, there were two sets of narrow lines with spaces for radiation to slip through.
You should read more from that source, after that passage.
-
Paul D at 05:40 AM on 18 January 2017Fact Check: Rex Tillerson on Climate Risks
On the issue of Rex Tillerson, the Channel 4 (UK) Dispatches documentary (link below, although not sure what availability is outside the UK) suggests that the coal industry in the US is a bigger issue. I found the programme disturbing. Tillerson is also discussed in the programme.
President Trump's Dirty Secrets
Can't help thinking there are parrallels between Donald Trump and Damien in The Omen series of movies.
Damien Trump anyone !? -
Paul D at 05:30 AM on 18 January 2017Fact Check: Rex Tillerson on Climate Risks
What is the opinion of commentors of this event?
Ice crack to put UK Antarctic base in shut-down
Is the second crack at the Brunt ice shelf an indication of warming and that the shelf is likely to break up sooner than thought?
The scientists seem to suggest the risks are marginal, but they are not taking any risks just in case. -
Ravenken at 04:10 AM on 18 January 20172017 SkS Weekly Climate Change & Global Warming Digest #2
+Eclectic... got that right... sad part is, we need global dimming or... :-/
-
michael sweet at 04:08 AM on 18 January 2017Increasing CO2 has little to no effect
Renaissance Man,
Denial Depot has an entire post on how Skeptical Science adjusts graphs like you state. Perhaps you can elaborate on how the CO2 graph should be made. Of course, it is a sham science site, but it has funny stuff.
I teach Science in High School and College and if a student were to submit the CO2 graph with zero in the Y axis I would take off points because they did not fill the page with their graph. You are mistaken with your assertion that the zero has to be included. Read the linked post to see how your argument looks carried to its logical conclusion.
CO2 is the thermostat that sets where the concentration of water in the atmosphere is. Water follows the CO2.
-
RenaissanceMan at 03:45 AM on 18 January 2017Increasing CO2 has little to no effect
Tom Curtis@212:
"The misnamed RenaissanceMan...."
I could have sworn I read rules for this forum that ad hominem attacks were forbidden. Obviously that restriction does not apply to the "97%."
Tom Curtis has not the slightest basis for claiming that my good friend, who has known me very well for many years "misnamed" me. Tom has no basis; my good friend has a very broad and familiar basis indeed.
""Basically it's a big mistake to discuss climate policy separately from the major themes of globalization. The climate summit in Cancun at the end of the month is not a climate conference, but one of the largest economic conferences since the Second World War. Why? Because we have 11,000 gigatons of carbon in the coal reserves in the soil under our feet - and we must emit only 400 gigatons in the atmosphere if we want to keep the 2-degree target. 11 000 to 400 - there is no getting around the fact that most of the fossil reserves must remain in the soil."
1. Do conventions at Cancun, and Davos Switzerland, and at expensive resorts all around the world, widely attended at taxpayer expense, with not just dozens, not just scores, but hundreds of private jets arriving to deliver those who claim we must all cut back on fossil fuel useage advance this essential objective of keeping fossil fuels in the ground?
2. Do the habits of such people as Barack Obama, and Al Gore, and all the Hollywood rich and famous flying everywhere in private jets, riding on their large yachts keep fossil fuels in the ground, and advance the demand that we cut back fossil fuel use by some 80%/
3. Why does every conceivable magazine which supports the 97% feature countless advertisements for foreign travel, from Sierra, to National Geographic, to Audubon, to all of them?
4. Increasingly onerous restrictions, fees, cap and trade, and other actions drive up the cost of electricity and travel for even the poorest people worldwide. President Obama even bragged that his policies would double the cost of electricity. How can anyone support these reprehensible actions? People in Haiti resorted to eating dirt pies after the cost of corn skyrocketed due to its demand for ethanol.
5. "Ecotour" - a one-word oxymoron, an indefensible pretense.
-
RenaissanceMan at 03:30 AM on 18 January 2017Increasing CO2 has little to no effect
MARoger@211:
[snip]
"The choice of vertical scale on a graph of CO2 concentrations is hardily science. "
The root word for science is "scientia," Latin for knowledge. An essential component of knowledge is the accurate and honest presentation of such knowledge. The choice of presenting data to skew the slope of a graph can be demonstrated by a graph of a population explosion with a base of 1,000,000 and a top at 1,000,001, sharply sloping upward.
"And the relative position of a red line on a piece of paper does not determine the contribution of CO2 on global climate forcing. The atmospheric levels of CO2 presented on both of your graphs is roughly consistent (you appear to plot CO2 some 50ppm too high on the lower graph) and it is atmospheric levels which determine forcing."
As to CO2 being "forcing," infrared radiation is absorbed by water vapor and by carbon dioxide in virtually identical spectra, which I shall not bother to reproduce here.
"Yet you accuse the Keeling Curve of having an "unscientific nature." Have you any reason for such a claim? Setting out your claims in scientific terms would be the proper thing to do, if you are able."
I explained the etiology of the word "science" above, and for many I suspect this is their first such exposure. Your condescension, "if you are able," was conveniently overlooked by the moderator(s) who seem eager to jump on anyone posting a word contrary to the "97%". Elsewhere I am called a "denier" and the moderator ignored this blatant violation of the "rules" I just read. The moderator also ignored the religious reference by that same poster which I shall address more specifically in another post.
Finally, I am forbidden by the rules here from stating why I believe the Keeling Curve (1) has a steep slope, based on its non-zero base, and (2) based on its failure to include the dominant greenhouse gas, water vapor.
Moderator Response:[RH] Snipped for condescending tone. Trust me. People here know the definition of the word "science." Please, either raise the level of the conversation to one worth of science or risk further deleted comments.
-
jja at 02:59 AM on 18 January 2017Parts of United States are heating faster than globe as a whole
Dr. Bob Kopp led a study for the 'Risky Business' project with an update a few years ago that indicated that extreme heat and humidity impacts in the Unites States was most likely to occur in the Ohio River Valley region. The timelines for these impacts appear to be significantly delayed given the rapid warming we have experienced in the last 3 years. If this trend continues then the likely impacts should be accelerated by several decades.
more information here:
-
boba10960 at 01:01 AM on 18 January 2017Fact Check: Rex Tillerson on Climate Risks
Not to detract from concern about Tillerson, but one needs to be careful not to equate the Gulf Stream with AMOC. The Gulf Stream transports five to ten times more water as it leaves North America off Nova Scotia than the amount of water involved in AMOC. The rest of the water carried by the Gulf Stream constitutes ocean recirculation, including the subtropical North Atlantic Gyre. Consequently, northern Europe would continue to benefit from ocean heat transport even were AMOC to be reduced. Consider, for example, the climate of British Columbia. The Pacific Ocean lacks a PMOC that is equivalent to AMOC, yet the combination of ocean heat capacity and gyre recirculation maintains a mild climate in Vancouver.
Paleoclimate records clearly indicate periods of abrupt cooling in Europe during the last glacial cycle. Many scientists attribute this to a decrease in AMOC, but a competing hypothesis is that expansion of sea ice in the North Atlantic insulated the atmosphere from the ocean heat source in wintertime during these cold intervals (see, for example, Denton, G. H., R. B. Alley, G. C. Comer and W. S. Broecker (2005). "The role of seasonality in abrupt climate change." Quaternary Science Reviews 24(10-11): 1159-1182). Note that Wallace Broecker is also a co-author of the paper that advocates this sea ice hypothesis.
-
Tom Curtis at 00:46 AM on 18 January 2017Increasing CO2 has little to no effect
The misnamed RenaissanceMan (hereafter RM) @210 quotes Ottmar Edenhofer as saying:
"One has to free oneself from the illusion that international climate policy is environmental policy. We redistribute de facto the world’s wealth by climate policy."
The quote is a translation of a comment Edenhoffer made in an interview, where in response to the interviewer saying:
"De facto ist das eine Enteignung der Länder mit den Bodenschätzen. Das führt zu einer ganz anderen Entwicklung als der, die bisher mit Entwicklungspolitik angestossen wurde."
{"De facto, this means an expropriation of the countries with natural resources. This leads to a very different development from that which has been triggered by development policy."}
Edenhoffer replied:
"Zunächst mal haben wir Industrieländer die Atmosphäre der Weltgemeinschaft quasi enteignet. Aber man muss klar sagen: Wir verteilen durch die Klimapolitik de facto das Weltvermögen um. Dass die Besitzer von Kohle und Öl davon nicht begeistert sind, liegt auf der Hand. Man muss sich von der Illusion freimachen, dass internationale Klimapolitik Umweltpolitik ist. Das hat mit Umweltpolitik, mit Problemen wie Waldsterben oder Ozonloch, fast nichts mehr zu tun."
{"First of all, developed countries have basically expropriated the atmosphere of the world community. But one must say clearly that we redistribute de facto the world's wealth by climate policy. Obviously, the owners of coal and oil will not be enthusiastic about this. One has to free oneself from the illusion that international climate policy is environmental policy. This has almost nothing to do with environmental policy anymore, with problems such as deforestation or the ozone hole."}
(Note that the translation is by Philip Mueller, apparently for the Global Warming Policy Foundation. As that organization has repeatedly proven itself an unreliable source, I do not trust the translation, but not speaking German, must relly on it.)
Stating the obvious first, RM, or his source, has reversed the order of the two sentences he does include in the quote, and deleted three of five sentences in the paragraph, one from between the two sentences, and all without any indication of the deleted sentences existence. That sort of manipulation of other peoples words is, in academic situations considers fraud. That is because the meaning of any sentence depends on its context - and RM (or his source) completely butchers the context whilst trying to hide the fact that they have done so. So, at best RM rellies on a fraudulent source without fact checking. I note that Larry Bell similarly butchers the text in an article for Forbes. CFACT also butchers the quote, but again not in an identical form. Simon Downing also has a similar, but distinct butchering. It appears that AGW deniers are almost as bad as creationists when it comes to lying by out of context quotation. But I can find no evidence that RM is not himself an original butcher of the quote; and hence a perpetrator of a deliberate fraud.
So what is the context of the quote, and how does it effect things? Well, to begin with Edenhofer had already stated clearly, in the immediately preceding response that:
"Basically it's a big mistake to discuss climate policy separately from the major themes of globalization. The climate summit in Cancun at the end of the month is not a climate conference, but one of the largest economic conferences since the Second World War. Why? Because we have 11,000 gigatons of carbon in the coal reserves in the soil under our feet - and we must emit only 400 gigatons in the atmosphere if we want to keep the 2-degree target. 11 000 to 400 - there is no getting around the fact that most of the fossil reserves must remain in the soil."
That is, he has clearly acknowledged the objective of climate policy, ie, to keep the increase in Global Means Surface Temperature to 2 degrees celsius or less. But in doing so, he notes that the policy necessarilly will have impacts beyond the environmental, and specifically economic impacts. He clarrifies what that means afterwords. Specifically, the choice of different responses to AGW will de facto result in different consequences for the distribution of global wealth. He has already mentioned one example in the response before that (ie, two responses before the one RM, or source, butchered):
"That will change immediately if global emission rights are distributed. If this happens, on a per capita basis, then Africa will be the big winner, and huge amounts of money will flow there. This will have enormous implications for development policy. And it will raise the question if these countries can deal responsibly with so much money at all."
I might note that the current approach, of limits on emissions as a percentage of a nations current emissions locks in higher living standards for the first world as part of the treaty system well into the future.
No reasonable climate policy can be devised without noting, and negotiating these de facto effects. But they are, as Edenhofer clearly states, even in the butchered version of the quote, de facto effects. That is, consequences that were not the intended consequence of the policy.
Moderator Response:[PS] You know better. Please dont roll in the mud with the pigs.
-
Eclectic at 00:13 AM on 18 January 20172017 SkS Weekly Climate Change & Global Warming Digest #2
So, RenaissanceMan, which do you think is more insufferable: the actual physical global warming which is going on — or the hypocrisy of those who are using jet planes? Or the hypocrisy of those who conflate these two separate concepts?
Do Einstein's personal flaws mean that his Relativity ideas are wrong?
Your argument falls on its face, RenaissanceMan.
-
MA Rodger at 22:27 PM on 17 January 2017Increasing CO2 has little to no effect
RenaissanceMan @209.
The choice of vertical scale on a graph of CO2 concentrations is hardily science. And the relative position of a red line on a piece of paper does not determine the contribution of CO2 on global climate forcing. The atmospheric levels of CO2 presented on both of your graphs is roughly consistent (you appear to plot CO2 some 50ppm too high on the lower graph) and it is atmospheric levels which determine forcing.
Yet you accuse the Keeling Curve of having an "unscientific nature." Have you any reason for such a claim? Setting out your claims in scientific terms would be the proper thing to do, if you are able.
-
RenaissanceMan at 22:07 PM on 17 January 2017Increasing CO2 has little to no effect
Incidentally, the profound effect of water vapor on warming is clearly and demonstrably felt on cloudy nights, where water acts as a powerful blanket, warming local temperatures. The carbon dioxide concentration does not vary remotely as much as humidity, so that on cool, clear nights, the "forcing" argument is out the window, along with heat.
On a side note, another bogus claim is that "increasing ocean acidification" (sic) results from higher carbon dioxide concentrations dissolving in ocean water.
1. The ocean is not "acidic," it is alkaline. In fact, it is 18 times more alkaline than pure water. (The pH scale is logarithmic, and ocean water has a pH of ~8.2)
2. Degassification is a primary natural source of carbon dioxide. It leaves the ocean, rather than dissolving in it.
“One has to free oneself from the illusion that international climate policy is environmental policy. We redistribute de facto the world’s wealth by climate policy.” – Ottmar Edenhofer, who co-chaired the U.N.’s Intergovernmental Panel on Climate Change working group on Mitigation of Climate Change from 2008 to 2015
-
RenaissanceMan at 21:56 PM on 17 January 2017Increasing CO2 has little to no effect
"Radiative forcing" is such a contrived and meaningless term. It is simply an attempt to dismiss water vapor's dominant significance. The infrared spectra for water vapor strongly resembles that of carbon dioxide, and in fact the former is even more powerful at capturing IR radiation. The unscientific nature of the Keeling Curve reflects the author's attempt to instill fear, rather than communicate truth and knowledge. The Keeling Curve is blatantly dishonest [snip]because (1) it does not have a zero base and therefore is strongly skewed as to slope, and (2) does not include the dominant greenhouse gas, water vapor.
Simply making these two adjustments changes it from this:
to this:
 Moderator Response:
[RH] Please keep your images down to 500px in width.
Warnings and snips due to commenter not reading the SkS commenting policies.
-
RenaissanceMan at 21:39 PM on 17 January 2017Russian email hackers keep playing us for fools
Nigelj@1: "Let’s be clear the Clinton and climategate email hacks were theft of people’s private correspondence. The thieves can’t even claim a public interest defence, or whistle blower defence, because there was no wrongdoing found in the documents."
You mean that a Democratic operative at CNN can hand over debate questions to Hillary Clinton and that doesn't represent "wrongdoing"?
Oh please. Bernie Sanders can be ousted by the joint efforts of DNC operatives who want Hillary crowned, and no "wrongdoing" there?
And on and on..
"People I know still quote climategate as if it proves the IPCC wrong. "
Why your ongoing uproar if climategate documents showed no wrongdoing? In fact, it was a major embarrassment which showed inexcusable and indefensible bias by supposed "scientists" with a very profitable "research" axe to grind.
"I don’t like the thought of Trump attempting to appease Putin any more than the way Clinton antagonised him. Both can only create all sorts of obvious problems. It would be better to maintain a sincere, respectful, but slightly detached approach."
How did you like Obama appeasing Putin in 2012: "Tell Putin I'll have more flexibility after the election," Obama said to the Russian diplomat.
And then Hillary giggled as she and a different Russian diplomat hit the little red "Reset Button" she gave him. Democrat appeasement of Russians is just fine, isn't it. But when the other side does it.... ooooo baby. Danger Will Robinson.
Prev 419 420 421 422 423 424 425 426 427 428 429 430 431 432 433 434 Next


