


 Arguments


Recent Comments
Prev 421 422 423 424 425 426 427 428 429 430 431 432 433 434 435 436 Next
Comments 21401 to 21450:
-
JARWillis at 05:16 AM on 5 May 2017New publication: Does it matter if the consensus on anthropogenic global warming is 97% or 99.99%?
In spite of (or perhaps because of) being a complete amateur in this field - a British family doctor in fact - it seems to me that quibbling about the exact size of the majority of climate specialists who urge action to mitigate climate change is beside the point and merely playing into the hands of the denial industry.
It seems to me that the only question for serious consideration is whether or not we should act on the warnings being given by an overwhelming majority of climate scientists. Surely, since we are talking about a threat to the future of civilisation on this planet, sensible people would respond to warnings even if they came from a much smaller proportion of experts in the field than 97%. I would respond if it was 50%, or probably much less.
The thing we should be asking the deniers is how CERTAIN they are that they are right and that global climate science is wrong.Ask them to put a figure on it.Are they, let's say, 90% certain? They are not going to say 100% because we could write them off immediately if they said that because nothing in science is certain.
Perhaps they settle for being 95% certain they are right.
OK, we say, so you are urging us to accept a 5% risk that our civilisation is in peril and you say we should carry on with business as usual because that is OK.
Surely, this is check-mate. Or am I missing something? -
macquigg at 04:14 AM on 5 May 2017NY Times hired a hippie puncher to give climate obstructionists cover
Michael@34, I disagree with your assessment of the NY Times. They have been a great source of factual information on climate change, presented with excellent visualizations that non-scientists can understand. Here are two of my favorites: 1) 2016-hottest-year-on-record 2) how-much-warmer-was-your-city-in-2016
Tom@35, I like the piece at And Then There's Physics. It doesn't dwell on attacking Stephens, but offers the best counter argument I've seen so far. Maybe that could be the basis for an opposing op-ed in the NY Times.
John@36, I don't think conservatives will buy that climate change is a "pro-life" issue. Pro-life is about punishing women for having sex, not minimizing abortions, or anything to do with promoting life.
-
Daniel Bailey at 02:40 AM on 5 May 2017New publication: Does it matter if the consensus on anthropogenic global warming is 97% or 99.99%?
Science advances, one funeral at a time. As it ever has.
-
knaugle at 00:38 AM on 5 May 2017New publication: Does it matter if the consensus on anthropogenic global warming is 97% or 99.99%?
Most of the time when I look into this, at a purely amateur level, I find that there are maybe 80 really active, publishing climate scientists. From this list, I can count less than a handfull of scientists whom I know are critical of AGW. Roy Spencer, John Christy, and Judith Curry come to mind. Interestingly Curry has retired and so is no longer on my list. As is the case with Richard Lindzen and William Gray, and for that matter Christopher Moncton and Fred Singer (who aren't really climate scientists) it seems the most ardent "deniers" are getting really old and I'm not seeing their replacements. The eternal problem of being a contrarian is always that while you might be right, it is really hard to convince anyone.
-
John Hartz at 00:34 AM on 5 May 2017NY Times hired a hippie puncher to give climate obstructionists cover
Yesterday, Liz Spayd, the Public Editor of the NY Times, posted a rather insipid defense of the Times decision to hire to hire Bret Stephens. She also weakly defends his first op-ed. Needless to say, her article has attracted numerous comments (445) — including one fom me.
Bret Stephens Takes On Climate Change. Readers Unleash by Liz Spayd, New York Times, May 3, 2017
-
John Hartz at 00:24 AM on 5 May 2017NY Times hired a hippie puncher to give climate obstructionists cover
Two of the better critiques of the Stephens Affair...
The New York Times should not have hired climate change bullshitter Bret Stephens by David Roberts, Energy & Enviornment, Vox, May 1, 2017
Could making climate change a 'pro-life' issue bring conservatives on board? by Ben Rosen, Energy/Environment, Christian Science Monitor, May 2, 2017
-
Tom Curtis at 23:18 PM on 4 May 2017NY Times hired a hippie puncher to give climate obstructionists cover
macquigg @33, there have been a number of responses to Brett Stephen's opinion piece, some of which are listed by Greg Craven and some by And Then There's Physics. Dana's piece was an opinion piece for the Guardian, and others have also been in prominent forums. Had the NYT been interested in a debate, they would easilly have found a suitable columnist to counter Stephen's nonsense. That they chose not to is itself telling.
As an aside, it turns out that climate science is not the only area in which Stephen's thinks the role of intellectual argument devolves to that of trolling. Sarah Jones notes (in yet another OP in response to Stephens):
"At this point the case against the New York Times’s decision to give Bret Stephens an op-ed column is well-known. His comments on race—he has warned of “the disease of the Arab mind” and believes Black Lives Matter contains “thuggish elements”—are atrocious. He doubts the validity of campus rape statistics, and is a climate change skeptic. In an interview with Vox’s Jeff Stein, he insisted that it’s “not true” that one in seven Americans experience hunger. (He’s wrong.)"
-
HK at 21:50 PM on 4 May 2017SkS Analogy 2 - Ferrari Without Gas
gnmw:
The lapse rate is expected to decrease somewhat because surface warming leads to increased evaporation of water. When this water vapour condenses in the middle and upper troposphere it dumps its content of latent heat and causes extra warming there. This impact is expected to be strongest in the tropics and give rise to the so-called tropospheric hot spot.
Read more about that topic here. -
michael sweet at 21:07 PM on 4 May 2017NY Times hired a hippie puncher to give climate obstructionists cover
Macquigg,
There are many real scientists who would be willing to write your op-ed but the NYT will probalby not print them.
There is another op-ed from Bret Stephens today. I only read the title, but it appears to argue that if we take action to control climate change it may cause economic damage. Presumably he does not care about the damage that will certainly be caused by climate change if we do nothing.
Bret Stephens is simply a denier who has changed his tune because the data has proven his previous position incorrect. Now he says he thinks the climate is changing but his message is the same: take no action.
-
macquigg at 19:43 PM on 4 May 2017NY Times hired a hippie puncher to give climate obstructionists cover
The problem with Dana's article is that is too easily dismissed as unfair advocacy (see #20 above), and it is here in an obscure website, rather than in the NY Times. I would write the op-ed myself, but I have no expertise in climate science. Even if Stephens is as far beyond reason as you believe, his readers are not. Let's assume these readers are where I was a year ago. They accept that climate change is real, and it is us. The next step is to convince them it is bad, very likely really bad, more than just an increment in their summer electric bill. That is where my floating ball analogy might be helpful. We need to counter the argument that a 1 degree rise is no big deal, and even if that is the result of averaging larger changes, there will be almost as many cooler areas we can move to.
-
John Hartz at 13:45 PM on 4 May 2017NY Times hired a hippie puncher to give climate obstructionists cover
macquigg @31: You wrote:
So that's what I would do with Bret Stephens, especially since he has an influential forum, the NY Times. Let's engage him on this topic. Start with an op-ed counter to his April 28th piece.
Doesn't Dana's article (OP) qualify as such?
-
Bob Loblaw at 11:31 AM on 4 May 2017Evidence Squared #10: Debunking William Happer's carbon cycle myth
A definition of "pollutant" that I like is "the wrong thing in the wrong place at the wrong time".
Ozone is a good example. Important and beneficial in the stratosphere as a UV-blocker, but nasty stuff at ground level where it rapidly reacts with many things biological (such as lung tissue).
-
macquigg at 10:46 AM on 4 May 2017NY Times hired a hippie puncher to give climate obstructionists cover
I could be wrong about Stephens, and I know that some people are beyond reason. I have debated a self-proclaimed "atmospheric science" expert in a public forum az-2-forum, and I relied heavily on material from SkepticalScience.com to counter his arguments. I was seriously tempted to call him a crackpot, but I held off, and I think that was the most effective way to demonstrate his irrationality.
So that's what I would do with Bret Stephens, especially since he has an influential forum, the NY Times. Let's engage him on this topic. Start with an op-ed counter to his April 28th piece. Resist the temptation to call him dishonest. Acknowledge that there is plenty of uncertainty even after we accept the basic facts that the globe is getting warmer because of man-made CO2. Show why this uncertainty should be a call for action not delay. Use the airplane analogy.
As for further study, maybe some statistical simulations would help. We can't predict local climates, but if we run our best models with random inputs, and we see that in 98 out of 100 simulations, the results are disastrous in some part of the world - a drought in California, flooding in Missouri, etc., maybe that will help convince people who read the NY Times, that with near certainty, we have a serious problem in a few decades.
-
gnmw at 10:20 AM on 4 May 2017SkS Analogy 2 - Ferrari Without Gas
HK— Why would the lapse rate decrease?
-
Tom Curtis at 07:49 AM on 4 May 2017NY Times hired a hippie puncher to give climate obstructionists cover
macquiqq @22, that quote just looks like more denial to me. He is equating uncertainty in predicting climate (changes a century from now) with changes in weather (changes in a year).
Nor, despite his rhetoric, is he taking uncertainty seriously at all. Uncertainty cuts both ways. Temperatures may be cooler than the IPCC median projections, but they also be warmer. Indeed, it is more probable that they will be 50% greater than median than 50% less than the median increase. Consequently, we should be more cautious in the face of uncertainty - ie, do more to prevent the potential changes.
-
Tom Curtis at 07:41 AM on 4 May 2017NY Times hired a hippie puncher to give climate obstructionists cover
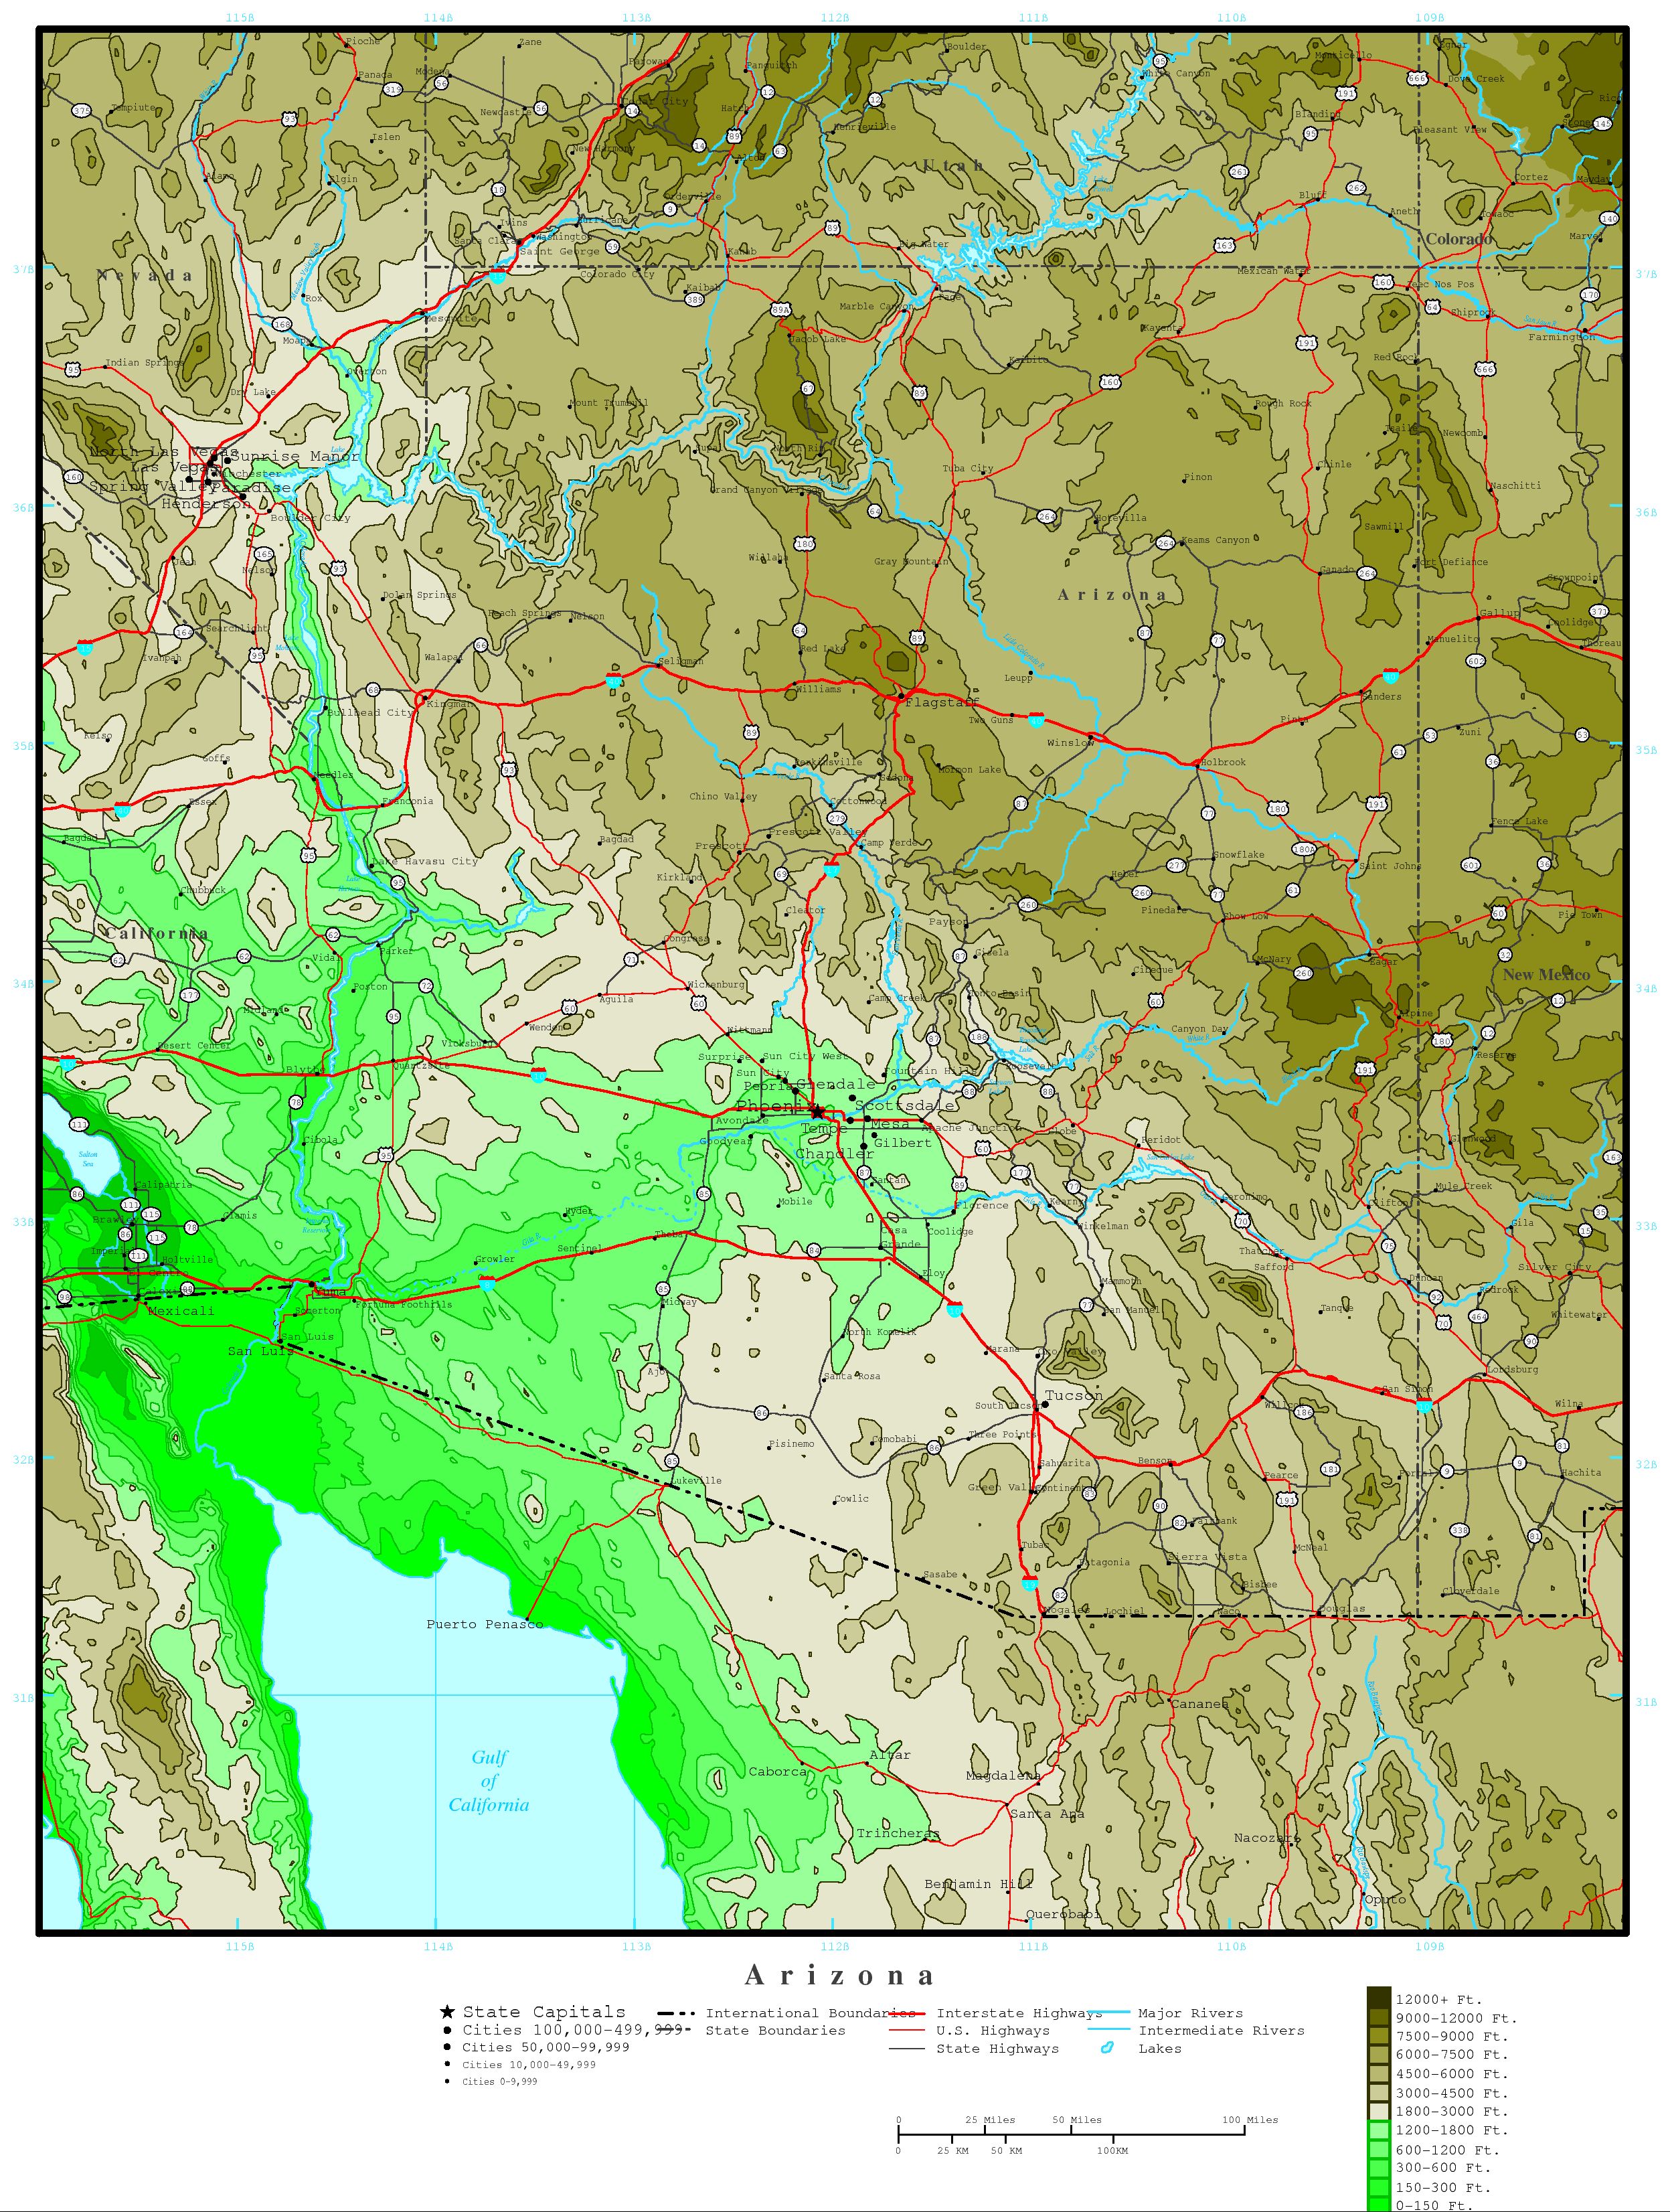
The temperature record for the Apache Powder Company, which according to Berkely Earth is the nearest station to Benson carrying a temperature record after 1973:

The BEST record for Tucson, Arizona - which according to them is the nearest major city:

With the qualification that both show annual temperatures, rather than summer temperatures, they are quite similar. In particular the increase in temperature since the 1960s is approximately the same in both cases. The variations from the trend seem to last longer in Benson, however, than in Tucson. Part of the reason for that may be that Tucson temperatures are stabilized by being more open to air from the Gulf of California and/or the Colorad River valley. I do note that warming in summer in Arizona has been less than for the other three seasons.
What that means for Benson in 80 years time with BAU is that like the rest of Arizona, it will be much hotter and much drier. It will likely continue to have more persistent short term variation. Any idea that Benson will retain a late twentieth century 30 year mean temperature or precipitation 80 years from now is unwarranted. Its changes in both will be very close to those for Arizona as a whole.
-
nigelj at 07:32 AM on 4 May 2017NY Times hired a hippie puncher to give climate obstructionists cover
Macquigg @22, I'm in agreement with many of your comments on agw, but a little mystified by your comments in this post on Stephens. You claim Stephens is taking a more reasonable position, but the material you quote Included:
"Seemingly tiny differences in terms of inputs can make dramatic differences in terms of results. We should be humble about what we can know a year into the future, never mind a century, and we should be refining our assumptions continuously. That calls for more"
This is just more delay and denislism. I have heard the same claim in different forms for 20 years and it subtly suggests we need far more research. Dont you see he will still be saying the same thing when sea level has risen 3 metres?
Sure modelling is complex and small things have big implications, but this doesn't make it just guesswork. He words this in a way to try to undermine peoples faith in the modelling. It's all just sophistry.
Climate models are doing just fine. Predictive ability is the best way to ascertain if modelling works. I know very little about climate modelling, but enough to know its based around clusters of differential equations that calculate atmospheric changes. Equations are still equations across all fields of science, they make predications and are tested by results of those predictions. The more important thing is that temperatures over the last 50 years are tracking close enough to models predictions which shows the models have value in terms of at least global scale changes.
I get your ping pong ball analogy by the way. I just think your wording was a little unfortunate, and created an impression that you felt 'all' climate modelling was hopeless, when I think you meant it's just hard to calculate what happens on a city by city basis? (I think that would actually always be pretty hard but scientists can only try I suppose).
Regarding Brett Stephens, I based my comments on what I have read, and I did read the links in the original article. I don't think its helpful calling people names or swearing, but if somebody makes certain pronouncements we are entitled to draw conclusions on their mental state and must tell it as we genuinely see things and sometimes this means being critical. Yes we should try and politely reason with people, and I do this most of the time. I think you are generally right to promote this as you generally have. The trouble is some people are just obviously beyond reason, and with them its a waste of time trying and you need to be a bit blunter.
-
scaddenp at 07:23 AM on 4 May 2017NY Times hired a hippie puncher to give climate obstructionists cover
What what I have read, the issues with local climate are not due to chaos (your floating ball) but with sub-scaling in GCMs and the difficulty predicting how warming will affect structural elements in the earth weather system (eg behaviour of jet streams - which influence local storm tracks - and particularly the ENSO system). Will the Hadley cells expand etc. Time and research is likely to improve prediction. Improving computer grunt will smaller cell size as well.
However, I think it is also useful to remember that you can say with confidence that practically all local climates will get warmer. Wetter or dryer is harder. Some places are easier to predict that others as well.
-
nigelj at 06:48 AM on 4 May 2017Evidence Squared #10: Debunking William Happer's carbon cycle myth
I think both analogies in the posts above are good. I think almost anything can become a pollutant, dependent on circumstances and quantities, etc. We currently have a big problem with cow urine introducing excessive nitrates into rivers, and in this instance its dependent on quantities.
But it might be better to say CO2 is a pollutant dependent on circumstances. When we exhale CO2 it becomes part of the natural carbon cycle, so doesn't raise atmospheric concentrations, where burning fossil fuels does increase concentrations,so it's reasonable to call it a pollutant if it originates with fossil fuels.
-
John Hartz at 06:28 AM on 4 May 2017NY Times hired a hippie puncher to give climate obstructionists cover
macquigg @25: You ask:
Will more research be helpful in predicting local climates?
I am by no means an expert on this matter, but, based on what I know about GCMs, they probably will never be refined to the point they can produce a forecast of what the climate of Benson, Arizona will be in the year 2100 under a given scenario of input variables. Some of the GCMs can currently produce forecasts for mult-state regions such as the Southeast US. Assuming that an adequate stream of funding is avaialble to do so, I suspect that some GCMs will be refined to make forecasts for smaller areas such as states.
A couple of follow-up questions for you:
What is the current population of Benson?
What is Benson's source of potable water?
-
Evan at 06:26 AM on 4 May 2017SkS Analogy 2 - Ferrari Without Gas
For those brave souls who have made it this far down the comment list, one more comment. Yes, the analogy may be interpreted as crude and does not hold up under all considerations of the actual greenhouse effects. The purpose was to draw attention to the fact that it takes more than just CO2 to cause warming. It also takes infrared radiation. If we try to draw too much from an analogy it can become confusing, and the purpose of these analogies is not to educate the well-educated commenters, but to educate people who may be new to the science of global warming.
That said, I am always open to modifying and improving these analogies, so thanks all for the many constructive comments. I will consider them all and will consider how we can improve this analogy and make it more effective.
-
macquigg at 05:46 AM on 4 May 2017NY Times hired a hippie puncher to give climate obstructionists cover
John@23, Daniel@24: Arizona as a whole is getting warmer, and Tucson is part of the region that is impacted by the drought we've seen for the last few years. Tucson gets its water from the Colorado River, and will be the first city to be cut off if the water levels fall a little further. The climate in Benson is much different. We have no problem with water, but if I understand climate science correctly, that could all change with a small shift in the jet stream, which could happen with the predicted global warming. My point in using Benson as an example is not to argue that global warming is good for Benson, but rather that the problem lies in the uncertainty, even with local climates that seem to be moving in good direction.
Will more research be helpful in predicting local climates? Or is this more like the floating balls in the river - no chance of ever predicting which ball will end up where.
-
Daniel Bailey at 02:58 AM on 4 May 2017NY Times hired a hippie puncher to give climate obstructionists cover
The state of Arizona as a whole has had significantly warmer summers:

Perceptions certainly do not overrule reality.
-
John Hartz at 02:37 AM on 4 May 2017NY Times hired a hippie puncher to give climate obstructionists cover
macquigg #20: You wrote:
I live in Benson Arizona, and it looks like the hot summers are getting a little cooler.
You could easily verify whether your impression is correct or not by analyzing the temperature records for Benson and/or nearby Tuscon.
-
macquigg at 01:12 AM on 4 May 2017NY Times hired a hippie puncher to give climate obstructionists cover
Tom @21, I was not aware of Stephens' prior writings on this topic, but if his first two op-eds in the NY Times (April 28 and May 1) are what he currently thinks, it looks like his position has changed. He now seems very reasonable: "The climate is an intensely complex system. Seemingly tiny differences in terms of inputs can make dramatic differences in terms of results. We should be humble about what we can know a year into the future, never mind a century, and we should be refining our assumptions continuously. That calls for more investment in science, not less."
A fair criticsim, which appears in the comments to the April 28 column, is that he is not treating the uncertainty with enough urgency. One of the commenters gave a perfect analogy: We would not get on a plane if technical experts told us there was a 10 to 20% chance of disaster. Let's work on refining that estimate and getting better models that will help us know the specifics of what is likely to happen.
-
BILLHURLEY13951 at 00:31 AM on 4 May 2017Evidence Squared #10: Debunking William Happer's carbon cycle myth
I think the analogy is easier than that. Water, like CO2, is natural and life-giving. But too much and you drown.
Not only do degrees/percentages play a part in the Climate Change issue, but in all environmental issues as well.
-
Tom Curtis at 22:14 PM on 3 May 2017NY Times hired a hippie puncher to give climate obstructionists cover
macquigg @20, I think you are being all together too generous to Bret Stephens. As recently as 2010 he was writing:
"So global warming is dead, nailed into its coffin one devastating disclosure, defection and re-evaluation at a time. Which means that pretty soon we're going to need another apocalyptic scare to take its place."
and reffering to environmentalists as making "quasi-totalitarian demands".
In 2011 he was writing:
"Consider the case of global warming, another system of doomsaying prophecy and faith in things unseen.
As with religion, it is presided over by a caste of spectacularly unattractive people pretending to an obscure form of knowledge that promises to make the seas retreat and the winds abate."
In 2015 he referred to global warming as:
"The hysteria generated by an imperceptible temperature rise of 1.7 degrees Fahrenheit since 1880—as if the trend is bound to continue forever, or is not a product of natural variation, or cannot be mitigated except by drastic policy interventions."
And finished, the article by writing:
"Here’s a climate prediction for the year 2115: Liberals will still be organizing campaigns against yet another mooted social or environmental crisis. Temperatures will be about the same."
On that evidence he has consistently considered global warming to be based on hyped and fabricated studies, with what actual warming exists being due to natural variation, a view he is sufficiently confident in as to predict effectively no temperature change over the coming century.
Three record annual temperatures in a row have made that view untenable for anybody who wants to pretend they are a serious commentator; but I have no doubt he was not convinced by the science (which has not changed over the two years) and hence that come the next La Nina he will revert back to what is essentially AGW denialism.
Further, it is plain from the articles that he is very happy to insult those pressing for action on AGW, and indeed insult working climate scientists who take no role in the policy debate as well. Given the liberality with which he insults, he would be a precious petal indeed if he took offense at the comments here.
In short, I think the evidence shows you are wrong in thinking Stephens is open to persuasion on any terms. He is prepared to run up and down the levels of denial as suits the circumstance, but nothing will persuade him that AGW represents a serious threat that merits any policy response.
-
macquigg at 21:45 PM on 3 May 2017NY Times hired a hippie puncher to give climate obstructionists cover
JH@8, glenn@10, macquigg@13, digby@17, glenn@19
I'm happy to see there is at least some agreement after my clarification, and I appreciate Digby's suggestion of using a different analogy, a person with a 4 degree fever. I think that analogy is too remote from climate science to be persuasive, however.
Analogy #1 Speed Kills was excellent, because it emphasizes the orders of magnitude increase in climate rate of change we are facing. I like my turbulent river analogy because I think it will work with people who are skeptics, like Stephens. It is not intended for people who are deniers, or completely ignorant of science and won't appreciate the computational difficulties in trying to predict local climate.
I know what won't work with Stephens, and that is this article and some of the comments. He will see these as name-calling, speculation over his evil motives, argument over insignificant details, and exaggeration of the certainty of "alarmist" predictions. If we want to engage with people like Stephens, and I think that is a worthy endeavor, we need to start from common ground. He accepts that the climate is warming and that it is the result of man-made CO2. That puts a huge distance between him and the idiots we see in political power and in the news. He just doesn't accept that the results of warming will be as bad as most climate scientists believe.
We need an analogy that will make sense to people who accept the basic science, but are still skeptical of the coming disaster. We cannot just say that any climate change is bad. I live in Benson Arizona, and it looks like the hot summers are getting a little cooler. I undersand that trend could reverse, however, and it is the uncertainty that has me worried.
-
HK at 19:10 PM on 3 May 2017Industrial-era ocean heat uptake has doubled since 1997
ConcernedCitizen:
Quote from Rob Honeycutts link in #7, from the first paragraph under the heading Sea-Air Heat Exchange:"Solar heating of the ocean on a global average is 168 watts per square meter."
This means that if direct solar heating was the oceans' only heat source, they couldn't lose any more heat than this to the atmosphere/space without cooling. Assuming an emissivity of 0.95, this gives a maximum surface temperature of 236 K (-37oC) in order to radiate 168 watts/m2. If heat loss by conduction/convection and evaporation was included, the heat loss by radiation and thus the surface temperature had to be even lower than this.
So, regardless of the details of what happens in the skin layer, the turbulent mixing and so on, this should once and for all end any claim that the oceans can't be heated by IR radiation from the atmosphere.
-
Glenn Tamblyn at 17:17 PM on 3 May 2017NY Times hired a hippie puncher to give climate obstructionists cover
Thanks for the clarification macquigg.
Yes predicting more local climate is harder but one aspect of climate change, globally, that I think is under-appreciated, is that possibly all local climates will change. Each may not look like a bad change although many will be.
But any change is still bad to some degree since it is a disruption. Our agriculture, infrastructure, design of our houses, medical services, many things, are built around the local climate. Potentially everything will need to change. -
nigelj at 12:17 PM on 3 May 2017NY Times hired a hippie puncher to give climate obstructionists cover
Charles S @16, yes I hear you, and quite true. Two or three years is too short to draw conclusions about the basic underlying global warming trend.
However its such a sharp increase, with nothing else like it in the graph above, so it makes me suspicios that something has fundamentally changed. Time will tell.
-
Digby Scorgie at 11:51 AM on 3 May 2017NY Times hired a hippie puncher to give climate obstructionists cover
macquigg @13
It also took me a long time to realize the significance of small changes in average global temperatures, but this was looking at it from a different perspective. From what I read initially I could distill the essence as follows:
Two degrees please; four degrees and you're dead.
This was likening the temperature change to someone with a fever — but I didn't know why the analogy was apt. Then I discovered that a drop of five degrees would put us back in an Ice Age. Later still I discovered that an increase of just two or three degrees would put us back over three million years on a rather different planet from the one we prefer today.
In other words, it doesn't take much of a change either way to result in drastic changes to the planet. (My degrees are all Celsius, by the way.)
-
Doug_C at 10:28 AM on 3 May 2017Climate contrarians want to endanger the EPA endangerment finding
Multiple lines of evidence supporting human forced climate change through the emissions of billions of tons of carbon dioxide while at the same time multiple lines of evidence of how the campaign to deny this is is almost entirely fabricated by the fossil fuel sector in its own interests.
The 2007 Supreme Court decision that should be forcing the EPA to strictly regulate human emissions of carbon dioxide got it right. The continued effort to overturn it is a clumsily put together attempt to deny reality that is all about keeping the fossil fuel sector alive as long as possible no matter the consequences.
-
Tom Curtis at 09:38 AM on 3 May 2017Evidence Squared #10: Debunking William Happer's carbon cycle myth
Bill Happer say's in the first video (1:12):
"There's this myth that's developed around carbon dioxide - that it's a pollutant - but you and I both exhale carbon dioxide with every breath. Each of us emits about 2 pounds of carbon dioxide a day, so are we polluting the planet?"
The obvious rebutal to that myth is to serve Happer with a nice large glass of urine, with some faeces floating in it. Each of us, of course, emits a significant quantity of urine and faeces every day (or at least we should). Further, both urine and faeces are fertilizers. I mention that because in the original broadcast, Happer goes on to mention that CO2 is "greening the planet". The analogy between urine and faeces, and CO2, in this argument, is therefore precise. We all still consider water with a quantity of urine and/or faeces in it polluted. We wouldn't want to swim in it, let alone drink it. Ergo, the reasons for thinking CO2 is not a pollutant given by Happer have literally no bearing on the case.
Indeed, if you break it down, Happer's argument is an appeal to ignorance. Only by being ignorant can the argument appear to make sense. For somebody supposed to be a science advisor to the President, that is shameful. For somebody science advisor to President Trump, what else would we expect?
-
Charles S at 08:37 AM on 3 May 2017New study: global warming keeps on keeping on
Oddly, this article ends up failing to answer one of the questions it sets out at the beginning, even though the paper it describes does answer that question. The answer to the question "[W]hat the chances are that global warming has sped up [in the last 3 years]?" is "pretty low", or rather:
No recent (post-1980) change-point was found in any of the five data sets, with three change points suitably capturing the climate signal, suggesting that the recent hot years are a continuation of the existing trend, augmented by noise. The 2016 value seems visually extreme, but does not yet provide statistical evidence for a trend change. Of course, future temperature development might provide evidence that an acceleration indeed happened around 2014, but the data up until now do not.
-
Charles S at 08:07 AM on 3 May 2017NY Times hired a hippie puncher to give climate obstructionists cover
nigelj: I think you are mistaken about interpreting the spike in the last 3 years as an increase in rate. Just as the 'hiatus' didn't tell us anything meaningful, there is as yet no sign that the last 3 years are anything other than an El Niño driven spike (indeed, the paper referenced in "Climate keeps on keeping on", (Rahmstorf, 2017) a few posts before this one, demonstrates that).
The increase in rate is inferred (and predicted) from the more than geometric increase in CO2 production predicted in RCP8.5, as discussed in the Skeptical Science article I linked to. A steady rate of doubling of CO2 drives a linear temperature increase, but if the time between CO2 doubling decreases over time, then the temperature increase will be more than linear.
joe: I think you are mistaking the amount of warming over the last century, which NASA lists, with the current estimated linear rate of warming per century. Cahill et al, 2015 confirmed that the rate of global warming changed in ~1970 (as is obvious from just looking at any plot of global average temperature over the last 135 years), so the rate from 1970 onward is the relavent rate, not the rate from 1916- 2016. Under RCP8.5, we aren't going back to the rates from 1916-1970 any time soon. That 1970-present rate is ~1.7C/century. -
John Hartz at 07:35 AM on 3 May 2017Climate contrarians want to endanger the EPA endangerment finding
Paul D: Conventional wisdom is that Us Den Jim Inhofe (R-OK) will retire in 2020 when his current term expires. Scott Pruitt reportedly covets that Senate seat. Pruitt is therefore unlikely to serve as EPA Administrator for four years.
-
nigelj at 06:41 AM on 3 May 2017Climate contrarians want to endanger the EPA endangerment finding
As you say the hotspot is not proof for or against human caused global warming, however I remembered reading this article on phys.org that the hotspot had actually been found:
phys.org/news/2015-05-climate-scientists-elusive-tropospheric-hot.html
-
nigelj at 06:12 AM on 3 May 2017NY Times hired a hippie puncher to give climate obstructionists cover
Joe @12
"Accelerating ? Yes if you include the el nino 2016 spike."
The trend is accelerating. We are almost certainly looking at three very hot years in a row from 2015 - 2017. This at least strongly suggests an acceleration is more than simply the effects of one el nino year. This is just obvious, I dont know how you cant see this.
"2015 was remarkable even in the context of the ongoing El Niño,” said GISS Director Gavin Schmidt. “Last year’s temperatures had an assist from El Niño, but it is the cumulative effect of the long-term trend that has resulted in the record warming that we are seeing.”
"Back to my original question - That projected rate of warming is 4x-5x the current rate of warming [in rcp8.5]. Is that even reasonable?"
I don't think reasonable is a term we generally apply to science. It's more a term applied to political policies or human behaviour. We don't ask whether quantum physics is a reasonable theory.
This is more a case of whether the science is valid on the basis of maths and physics. I have no reason to doubt the projections. You have to prove the projections wrong in specific and impeccable detail, not just make rhetorical style assertions.
-
HK at 05:48 AM on 3 May 2017Industrial-era ocean heat uptake has doubled since 1997
ConcernedCitizen:
If shortwave radiation directly from the sun was the oceans’ only heat source, most of the ocean surface would freeze over. Please explain why this doesn’t happen! -
Rob Honeycutt at 05:23 AM on 3 May 2017SkS Team - Marching for Science around the globe
Paul... I'd ding her on her choice of using a stencil. Notoriously unreadable typeface that one, stencil. But the sign, otherwise, is pretty clever.
-
Tom Curtis at 05:12 AM on 3 May 2017NY Times hired a hippie puncher to give climate obstructionists cover
joe @12, the IPCC AR5 projects warming of 2.0 +/- 0.4 C from the 1986-2005 average to the 2046-2065 average, and 3.7 +/- 0.7 C from the 1986-2005 average to the 2081-2100 average. That represents a warming rate of the 20 year average of 0.333 +/- 0.067 C/decade averaged from 1986-2005 to 2046-2065, and of 0.486 +/- 0.121 C/decade averaged from 2046-2065 to 2081-2100. For comparison, the trend from 1996-current is 0.189 +/- 0.089 C/decade (Berkeley Earth LOTI), ie, 56.8% of the average for the first trend period, and 39.9% of the projected trend for the later period. That is, the IPCC AR5 projects warming that is to 1.76 to 2.57 times the current warming rate. In other words, you overstate the increase in the warming rate by a factor or 2.
I notice you object to using the current warming trend due to the existence of "the el nino 2016 spike", but you don't object to the inclusion of the 2011/2012 La Nina at the end of the series (which was larger than the 2016 El Nino), nor in the inclusion of the 1997/98 El Nino at the start of the series. That smacks of special pleading to me. You only want included those features which reduce the measured current trend, but want excluded any that will increase it.
You also claim that the "...2017 temp trends [are] reverting to pre el nino levels...", but the 1996- End 2016 trend is 0.183 +/- 0.089 C/decade, ie, less than the trend incorporating the first few months of 2017. That should be no surprise given that the average of the first three months of 2017 was warmer than the annual average of 2016, and that without El Nino conditions (although El Nino conditions are a 50% chance of reforming later this year).
You should note that the 1996-current trend in UAH 6.0 is also warmer than the trend from 1996 to end 2016, contrary to your direct claim.
In any event, the issue you raise is, can temerature trends increase to match those of RCP 8.5 at the end of the century, ie, by nearly a factor of 2.6. Given that radiative forcing increases by nearly a factor of 4 in RCP 8.5 over the same period, I do not see how that is a problem.
-
Paul D at 05:01 AM on 3 May 2017Climate contrarians want to endanger the EPA endangerment finding
Hmm.
Maybe US legislation should insist that the head of the EPA should have a Science degree minimum (Political Science being a fake science degree).
The fact that Pruitt was appointed at all to the EPA whilst hundreds of other presidential appoinments remain empty, just sums up how much Trump et al hates the whole concept of the environment. -
macquigg at 05:00 AM on 3 May 2017NY Times hired a hippie puncher to give climate obstructionists cover
Glenn @10: I'm using "climate" to mean local climate, not some global average. I'm not referring to weather at all.
JH @8: I'm offering an analogy, not an assertion needing proof, like the analogies I've seen in other parts of this forum. It is intended to help explain our worries to skeptics like Bret Stephens, who may have the same misconception I had until about a year ago, that the benefits of warming in Northern states would offset the warming in states that are already too hot. I was never a denier of science, just not paying enough attention to worry about "global warming". Al Gore's argument didn't satisfy my skepticism.
The change for me came when I realized that the problem was not the average warming, but the unpredictable change to local climates, hot or cold, wet or dry, that we should expect from a small amount of warming.
Consider the alternative, a world where our models were perfect, and we could predict local climates ten or twenty years out. In that case, it might be possible to plan on moving my company from Arizona to Wisconsin. We could even have social programs to help poor people make the move.
I'm sorry that my analogy didn't help. It makes a lot of sense to me.
-
Paul D at 04:55 AM on 3 May 2017SkS Team - Marching for Science around the globe
Ahhh, that would make sense Rob.
Difficult to make out whether that is an h or an r!
Maybe a better critique is the choice of colour for that word!
-
Rob Honeycutt at 04:29 AM on 3 May 2017SkS Team - Marching for Science around the globe
Paul D... Maybe you need to zoom in a little or get new glasses. The sign says "proton" not "photon."
-
Paul D at 04:15 AM on 3 May 2017SkS Team - Marching for Science around the globe
Being a bit pedantic but in the Sarah in Michigan montage, she is carrying a placard that shows an illustration of an atom but the text talks about a photon.
Also a photon has no electric charge, so is neutral.
LOL
-
michael sweet at 03:12 AM on 3 May 2017Industrial-era ocean heat uptake has doubled since 1997
Concerned Citizen,
Sunlight heats the ocean. There for the ocean is hotter than the overlying atmosphere. According to the laws of Physics, heat is transferred from the warm ocean to the colder atmpshere.
When the atmosphere is warmed from AGW, heat flows more slowly out of the ocean. Since the inflow of heat from the sun is the same and heat is leaving the ocean slower, the ocean heats up. Slow circulation patterns transfer the heat through the entire ocean. It takes hundreds of years to reach equilibrium.
Scientists have measured an increase in temperature through the entire ocean. It is harder to measure in the deep ocean because of the small change so far and the difficulty of accurately measuring the temperature in the deep ocean.
If you do not understand the basics it will be impossible for you to convince anyone here that your argument is correct. There are references to all these facts at SkS. Use the search function.
-
Rob Honeycutt at 01:00 AM on 3 May 2017Industrial-era ocean heat uptake has doubled since 1997
ConcernedCitizen... Here's some good entry level college course materials on ocean-atmosphere coupling showing you're incorrect.
http://eesc.columbia.edu/courses/ees/climate/lectures/o_atm.html
And to claim that TCS and ECS are the same is, well, it's pretty much the height of hubris.
-
HK at 00:44 AM on 3 May 2017SkS Analogy 2 - Ferrari Without Gas
gnmw #14, in your last paragraph you say:
"…and most heat loss from the surface is by sensible heat and latent heat transport."According to NASAs energy budget chart, 79% of the heat loss from the surface is actually by radiation, but most of that is absorbed by the atmosphere. Convection/advection and latent heat is then responsible for most of the heat transport within the atmosphere. Maybe you were referring to net heat loss defined as surface radiation minus back radiation? In that case, sensible heat and latent heat account for about 1.8 more surface heat loss than radiation does.
Regarding the blanket analogy, I would say the outside of the blanket corresponds to the average altitude of heat loss to space (about 5 km), while your skin is the Earths surface. The average temperature (-18°C) at that altitude is sufficient for the heat loss there to balance the 240 w/m² of incoming radiation from the sun. The lapse rate then sets the temperature difference between that altitude and the surface.
If the amount of greenhouse gases increased enough to raise the heat loss altitude from 5 to 6 km, the surface temperature would increase by about 6.5°C if the lapse rate and the Earth’s albedo remained unchanged. In reality, both would decrease somewhat and produce a negative and positive feedback to the initial warming, respectively.
Prev 421 422 423 424 425 426 427 428 429 430 431 432 433 434 435 436 Next


