


 Arguments


Recent Comments
Prev 427 428 429 430 431 432 433 434 435 436 437 438 439 440 441 442 Next
Comments 21701 to 21750:
-
sailingfree at 22:32 PM on 8 December 2016From the eMail Bag: CO2 in the air and oceans
me@11
Not negative per the Middlebrook email. I am not referring to Red Barron's very interesting possibility.
-
sailingfree at 22:23 PM on 8 December 2016From the eMail Bag: CO2 in the air and oceans
Eager Jim@11, me @7
Thanks. So no negative feedback afterall.
-
Andy Skuce at 18:32 PM on 8 December 2016Justin Trudeau approves two big oil sands pipeline expansions
Saxifrage does breakdown the emissions from the projects as upstream (in Canada) and downstream (overseas in the case of export projects). So you can easily factor out the downstream emissions if you are just trying to calculate the Canadian emissions.
Promoters of LNG projects like to refer to incremental downstream emissions, because if gas replaces coal, the incremental emissions would be net negative. The implication is that net negative downstream emissions can be credited to Canada, whereas net positive emissions in export markets should not be.
A quibble with Saxifrage's calculation is that he basically assumes that all of the upstream emissions made to fill the pipeline will be new emissions that wouldn't have happened had the pipeline not been built. That could be true, but is not necessarily so. The counterfactual assumptions are not straightforward and are debatable.
I heard Premier Notley in a radio interview the other day claiming that no pipeline would increase emissions because the growth in oil sands production will happen, pipelines or not. This strains credulity, particularly because she also claims that pipelines will add thousands of new long term jobs. You just can't claim both. I'm planning a post on my blog covering this and other stretchings of reality.
In other news, Notley has agreed to debate Andrew Weaver on television. That should be interesting. Weaver has been very scathing lately about Alberta's Climate Leadership Plan. If I find out when this debate will happen, I will comment here.
-
MarkRagnar at 16:13 PM on 8 December 2016Justin Trudeau approves two big oil sands pipeline expansions
I have a quible with analyses like Saxifrage's: he counts the cost of burning Oil Sands oil, when most is destined for the export market. Gasoline imported from the middle east and burned in Canadian cars counts towards Canadian emissions. Nature doesn't care where the CO2 comes from, but counting fuel burned in export markets leads to double counting.
I echo Magma's sentiment, particularly with respect to the Pacific NW LNG project.
The analysis also doesn't relate the pipelines to each other; if all were to be approved, it would effect the capacity used of other pipelines. I cannot tell if these estimates account for the displacement of oil that would not be shipped via rail or truck if the pipelines were not built.
It should also be noted that Alberta government has also pledged a (admittedly ludicrously high) "legislated emissions limit on the oil sands of a maximum of 100Mt in any year with provisions for cogeneration and new upgrading capacity."
Tombe has stated that a ~$130/tonne price will be necessary; $50 is the Trudeau goverment's 2020 target. -
Tom Curtis at 11:01 AM on 8 December 2016Trump and the GOP may be trying to kneecap climate research
For completeness, I have analysed the relationship between CO2 forcing and the UAH TLT v6 beta5 elsewhere.
Further, with the moderators indulgence, I will respond to john warner's request that, "You might also tell the moderatorer you have never received a more thoughtful, intelligent, knowledgeable, insightful response."
Frankly, I would have used none of those adjectives in describing john warner's contribution to this debate. Rather, his analysis has been poor, relied too heavilly on cherry picked sources; and his discussion has been non-responsive and marked mostly by failure to acknowledge contrary evidence. Finally, his reasoning has been masked by his composition, which as previously remarked, resembles word salad. I find it difficult to believe clear logical thought underlies such poorly expressed arguments.
Moderator Response:[PS] Thank you for cooperation in putting your response to an appropriate thread.
-
Tom Curtis at 10:54 AM on 8 December 2016There's no correlation between CO2 and temperature
Elsewhere, I have noted that:
"Using the Law Dome combined CO2 data plus the BEST Land Ocean Temperature Index over the period of their overlap (1850-2013), we find a correlation between CO2 forcing (calculated as 5.35 x ln(CO2current/CO2initial)) of 0.900, an R-squared of 0.811, with a linear regression of 0.58 +/- 0.044 C/(W/m^2). ... Using just the raw Law Dome data (with no Cape Grim), however, we achieve a correlation of 0.711, and R-squared of 0.505, and a regression of 0.59 +/- 0.164 C/(W/m^2). Using forcings calculated from the Mauna Loa montly values from March 1958 to July 2016, the correlation is 0.854, the R-squared is 0.729, and the linear regression is 0.62 +/- 0.28 C/(W/m^2)."
My respondent, like victorag above, refused to accept the mathematical results based on their eyeballing of the timeseries of the CO2 concentration data plotted alongside the temperature data. They also insisted that the UAH TLT v6 was, despite being still in beta, the "gold standard of temperature records", a claim in stark contradiction to the evidence. Despite this, I thought it would be instructive to run the regressions over the UAH TLT v6 beta 5 vs the Mauna Loa monthly data. Before doing so, I converted the Mauna Loa data to anomaly values, both to eliminate the seasonal cycle and because the UAH data was also in anomaly values (and hence without a seasonal cycle).
Regressing temperature against CO2 forcing, we obtain a result of 0.43 +/- 0.06 C/(W/m^2) with a correlation of 0.556 and an R-squared of 0.309. That regressed value indicates a transient climate response of 1.59 +/- 0.22 C per doubling of CO2, a value well within error of the 2.29 +/- 1 C per doubling of CO2 from the Mauna Loa data (the highest value obtained). The shorter time span and greater perturbation of the satellite record by ENSO fluctuations, however, does reduce the proportion of the variation explained by the change in CO2 concentration (as shown by the smaller R-squared).
AGW deniers typically argue, in the face of this sort of data, that the correlation is a function of the temperature impact on the CO2 concentration, or growth in the CO2 concentration - ie, that the analysis has causation reversed. However, regressing CO2 concentration against temperature gives results of 49 +/- 7 ppmv/oC (Correlation: 0.552; R-squared: 0.305). On the surface, and given the trend increase of 0.41oC over the period analyzed, that would mean temperature accounts for just 19.9 ppmv of the trend 64.6 ppmv increase in CO2 concentration over that period. In contrast, based on the regression, CO2 forcing accounts for 0.404 of the 0.405oC trend temperature increase. In short, temperature explains CO2 concentration far worse than CO2 forcing explains temperature. It is likely that apparent forcing of CO2 concentration by temperature shown by the regression is an artifact of CO2 forcing causing the increase in temperature, particularly given that it is at least twice the value shown in other situations where we know change in temperature drives the increase in CO2, such as durring the glacial/interglacial cycle.
dCO2 concentration is even worse, showing a regression of 0.06 +/- 0.18 ppmv/oC (Correlation: 0.03; R-squared: 0.001). That is, the values are neither correlated, nor stastically significant, although it is possible better results might be obtained with suitably lagged values.
In summary, the evidence remains that there is a strong correlation between CO2 and/or CO2 forcing and temperature, and that correlation is primarilly driven by changes in CO2 concentration driving changes in the Earth's GMST.
-
RedBaron at 09:34 AM on 8 December 2016From the eMail Bag: CO2 in the air and oceans
Your confusion results from not clearly defining the carbon in the soils. Actually both are correct even though they may seem contradictory. The simple answer is this. There are two completely different biochemical pathways. The first we will call "labile carbon". This is the carbon resulting from the decay of organic plant and animal debris in the top O-horizon and the upper layers of the A-horizon of the soil. Bacteria, fungi, small arthropods, worms etc... do decay that material more rapidly as temperatures warm. This carbon mostly ends back into atmosphere as CO2, or CH4 in anaerobic conditions. The Roth C mathematical model is pretty effective at determining the tiny % that gets stored long term into the soil this way. It isn't much. This whole process therefore is considered a reinforcing feedback, rather than a stabilizing feedback.
The newly discovered LCP feeds an entirely different soil carbon pool which we can call the "stable carbon" fraction of the soil carbon pool. Instead of a near zero net, this carbon has an overwhelming tendency, under the right conditions, to even increase as temp or CO2 increases. Here is why. The C4 photosynthesis pathway is primarily your warm season grasses, rather than cool season grasses or trees. It is far more efficient, all else equal. So more root exudates to feed AMF. Glomalin has properties similar to "super glue" and while it does decay slowly, that decay is deep in the soil profile rather than on the surface. A far greater % converts to humic polymers that tightly bind to the mineral substrate. If anything, as it gets hotter and drier, the roots go deeper seeking ground water and even a greater % of that carbon ends up stable. Same with CO2 fertilization. For these types of plants, CO2 increases the carbon that follows this pathway. So you start with more and sequester a higher % of that more deep in the soil long term. This is a very different outcome from the decay of debris on the surface. One is a stabilizing feedback, the other a reinforcing feedback.
Remember, my premise was we should purposely trigger a stabilizing feedback, rather than the triggering of the reinforcing feedbacks we are accidentally triggering now. So obviously I do understand the reinforcing feedbacks are present now. It’s the main reason the “CO2 fertilization” effect isn’t really doing much for us. Whatever we gain is immediately offset by increased decay rate. But change the pathway to the LCP and CO2 fertilization actually helps to increase the rate of long term sequestration. -
nigelj at 07:52 AM on 8 December 2016From the eMail Bag: CO2 in the air and oceans
Red Baron @6, soil absorption of carbon intuitively sounds plausible to me and clearly you have some genuine expertise. However I'm sure I read an article recently that a warming climate actually causes increased microbial activity that actually results in soils releasing CO2? You would need to prove which factor dominates.
-
Jim Eager at 07:05 AM on 8 December 2016From the eMail Bag: CO2 in the air and oceans
sailingfree asked
Doesn't the evaporation - condensation - rain cycle transfer heat from the ocean to the atmosphere?
Exactly right, sf, sensible heat at the surface is converted into latent heat through evaporation. That heat is then transported upward by convection and released as sensible heat higher up in the atmosphere by condensation, so that part of Jeffrey Middlebrook's question is based on an incorrect understanding of atmospheric heat transport.
-
rdr95 at 06:16 AM on 8 December 2016Justin Trudeau approves two big oil sands pipeline expansions
Andy Skuce @18: "Let me say this, if Canada adopts a carbon price above $100, I promise to shut up about banning new pipelines for climate policy reasons."
I can't see any political way forward to a $100 price on carbon without those pipelines. It's a trade-off.
From John Ivison (http://news.nationalpost.com/full-comment/john-ivison-liberals-strategy-of-pipeline-approval-with-carbon-pricing-a-winner-with-voters-poll-suggests):
"But a more interesting statistic emerged when Abacus asked how people would feel if a carbon pricing plan that encouraged a shift toward greater use of clean energy was accompanied by a new pipeline to get Canada’s oil and gas to new markets.
The result is a potential game-changer: three out of four Canadians would support or accept this shift, including majorities in every region.
In Alberta, 92 per cent of respondents bought into the idea; in Saskatchewan, the number was 83 per cent. A large majority of Conservative voters was supportive (87 per cent) and 62 per cent of NDP voters said they could go along with this decision.
Even in Quebec, which has traditionally been hostile to pipelines, two out of three respondents said they would back a shift to renewables accompanied by a new pipeline."
-
Kiwiiano at 05:17 AM on 8 December 2016From the eMail Bag: CO2 in the air and oceans
The HUGE fish-hook with industrial production models is that while they may have spectacular and essential yields now, they are rapidly destroying the globe's soils. The FAO were predicting only 60 more harvests before they have been wiped out and even that figure's impact is illusionary...it won't be a case of 60 years and 'click' the light goes out, it will be decades of declining output and increasing starvation with all the social disruption that will (and already is) entail.
-
Tom Curtis at 02:40 AM on 8 December 2016Trump and the GOP may be trying to kneecap climate research
MA Rodger @31, the annual cycles for earlier verions of the UAH TLT were found in the "read me" files. The average for the UAH v 6 beta5 has a mean of -9.2 C, or 263.9 K. That is well below the 282.9 K (+8.77 C) quoted by the john warner. john warner's values are also well above the appoximately -13.5 C mean for the AMSU chanel 4 data that he cites elsewhere for the seasonal cycle. That makes it something of a mystery as to how he actually obtained the value. Given that he seems only to have been making a rhetorical point "For all there knowledge global warming believers have they can never answer the simplest questions" - a point that has no basis; the issue seems moot with regard to this discussion.
Moderator Response:[PS] To all commentators responding to John Warne.
This charade of a discussion is at an end. John Warner has unfortunately derailed this thread and offtopic discussion here stops now. John believes he can attack climate science with his superior science at any point.
If this is so strong, then I suggest that he use the "arguments" menu to pick something he believes he has a strong case against and present the science that challenges it on the relevant thread. No sloganeering. Produce data and/or paper in support and leave the rhetoric at the door. I strongly recommend that he reads the science he is attacking first rather than just assuming he knows it based on statements so far. IPCC WG1 is your friend.
Any discussion of surface versus satellite record goes here. Discussions about source of CO2 go here.
-
MA Rodger at 02:18 AM on 8 December 2016Trump and the GOP may be trying to kneecap climate research
Moderator @ 29,
There are of course two UAH TLT records as well as RSS TLT.
The v6.0beta5 (which is not yet released so shouldn't be in use) has an annual cycle with an average well below freezing so the annual averages will also be below freezing. I calculate Dec15 to Nov16 at -8.67ºC. (Note, the value presented by the commenter is only a couple of fat fingers away from this value.)
RSS TLT would have similar anomaly values. UAH TLTv5.6 has a lower average altitude (about 2km lower) so should have an average above freezing but the +8.77ºC could be a bit high. I've never seen its absolute values quoted for UAHv5.6.
-
RedBaron at 00:41 AM on 8 December 2016From the eMail Bag: CO2 in the air and oceans
Nick,
If you use vertical stacking and polycultures you can almost guarantee increased yields per acre. Productivity is a different issue, that is yields per man hour. No we generally have not succeeded yet in beating the industrial production models there. I would point out though....is that the problem it once was? Don't we have plenty of people capable and willing to work on this planet? It is not the old days where labor shortages were the main priority due to massive wars and famines and we were forced to import cheap labor just to keep up. (slaves from Africa, and Chinese laborers for the railroads...etc.... as examples from my country)
-
SirCharles at 00:35 AM on 8 December 2016Fake news tries to blame human-caused global warming on El Niño
-
Nick Palmer at 23:52 PM on 7 December 2016From the eMail Bag: CO2 in the air and oceans
Well done, RedBaron, for bringing up the restoration of natural levels of carbon in the soil as a powerful mitigation measure. Awareness of this seems to be growing. So far, I have not seen enough peer reviewed evidence that we could replace coventional agriculture and still get the same productivity while increasing soil carbon percentages long term but there is plenty of exciting relatively woo-free anecdotal evidence from such as Drs Christine Jones, Elaine Ingham and David Johnson.
-
barryaclem at 23:09 PM on 7 December 2016Scientists can't even predict weather
IMO a much more compelling arguments for laymen uses the example of tossing a coin.
Predicting the outcome of a single coin toss with better than fifty perc ent accuracy is impossible. However, predicting the outcome of a thousand coin tosses is trivially easy: very close to half of them will be heads.
The weather forecast involves a lot of random elements and is therefore more like predicting a single coin toss. Predicting climate change is much more like predicting a thousand or a milion coin tosses and is therefore more accurate.
-
sailingfree at 23:03 PM on 7 December 2016From the eMail Bag: CO2 in the air and oceans
Doesn't the evaporation - condensation - rain cycle transfer heat from the ocean to the atmosphere?
In his email, Middlebrook claims the opposite. "...with greater precipitation due to more atmospheric water vapor more atmospheric heat will be transferred to the oceans and terrestrial landscapes."
-
RedBaron at 17:45 PM on 7 December 2016From the eMail Bag: CO2 in the air and oceans
There are case studies, mostly from Australia and CSIRO and a few from USDA that indicate between 5–20 t COe /ha/year can be sequestered long term in the soil via the newly discovered “liquid carbon pathway”. Basically to simplify a very complex and exciting new line of research, the LCP goes like this: Photosynthesis to root exudates to mycorrhizal fungi to glomalin to humic polymers to mollic epipedon. This can apply to restoring both degraded grasslands/savannas and/or seasonally arid cropland, under the right conditions, management, and methods of course. If you do that math, conservatively one could sequester long term into the soil between 62% and 250% of current yearly emissions.
So the answer is potentially possible with a relatively high uncertainty. Since 250% is more than emissions, this stabilizing feedback could draw down CO2. That means yes it could work and we now know how to trigger it. Certainly the soil sink is large enough to hold all that carbon long enough to give the oceans a break and chance to catch up. Since it is a biological feedback that evolved over millions of years, it is unlikely to have an unacceptable risk level. We are after all simply restoring the lost ecosystem services on almost 1/2 the planet land surface that WE naively degraded with agriculture. The biggest risk being we might do it too well and slip back into a glaciation phase. But I suspect we would be quite capable of preventing that.
However, there are some nuances. Likely if we draw down CO2 too rapidly the oceans might become an emissions source too. Like a fizzing coke! That means while we probably can sequester that carbon from the atmosphere, it might not actually do as much to stop AGW as anticipated due to CO2 being replaced almost as fast as we draw it out. Another nuance is that the low end is 62%. That wouldn’t be enough. That means we must also drop emissions to at minimum 62% or less of what they are now by converting as much as possible to renewables like solar and wind etc…
Methane is not a problem. This will actually help the methane problem significantly due to restored methanotrophic activity. Yes, it’s true. Raised properly and as part of a healthy grassland biome, cows actually help lower atmospheric methane. The problem with methane isn’t the cow. Not their fault. It’s the feedlots and the vast overproduction of corn and soy used to supply those feedlots, thawing permafrost, dead zones in the ocean, fossil fuel well leakage etc….
Soil Microorganisms as Controllers of Atmospheric Trace Gases (H2, CO, CH4, OCS, N2O, and NO)
-
Eclectic at 15:00 PM on 7 December 2016Trump and the GOP may be trying to kneecap climate research
John warner, you seem to be unaware that UAH Lower Troposphere is not a measure of global surface temperatures. It has a limited overlap, and a rather poor correlation with: GMST.
Your computations are therefore not valid.
Nor have you taken into account ocean surface temperatures and total ocean heat content - all of which also have a rather poor correlation with UAH Lower Troposphere temperatures.
The end result is that you are wasting your time, and have produced GIGO.
Moderator Response:[RH] TLT has significant bleed from the stratosphere as well, and thus is biased low. If one is going to use satellite data TTT is a better product for the troposphere. But, as you note, none of the satellite data are representative of the surface temperature.
-
john warner at 14:23 PM on 7 December 2016Trump and the GOP may be trying to kneecap climate research
Tom Curtis @ 26 Scientific calculator, UAH Lower Troposphere, Mauna Loa CO2 annual
Tell moderator my regression conformed to reality.
Tom Curtis @ 27 No Problem. Moderator said you can't measure average annual global surface air temperature.
Tom I can talk to you. Tell moderator that I read and understood your regression at Tom Curtis 15. I have invested a lot of time convincing you that we can have a discussion. You might also tell the moderatorer you have never received a more thoughtful, intelligent, knowledgeable, insightful response.
The average annual global surface air temperature is 281.92oK. [mod. - Nope. That might be TLT, but it sure isn't a surface temperature reading @ 8.77°C]
Let's have a discussion. You choose the subject.
While your thinking of a subject consider that dana 1981 wrote an article saying the climate change denier don't know science. I am here on your home field to prove that the global warming theory is shallow and not scientific. My preference is for you to defend what you think is the strongest scientific argument for global warming. Let's find out who has the science on their side. If you like the way I think let's see what we agree upon.
Moderator Response:[RH] The moderators are perfectly capable of reading your comments. You don't need to ask Tom to tell us anything. You're skating just along the edge of moderation complaints, and per our policies, those are deleted. But continue...
[PS] Ok, the paper I pointed to (have you read it?) points to lack of practical usefulness in any measure of absolute surface temp given the error bars. (especially compared to anomaly methods). You would know that if you read resources people have provided you. So far you have only demonstrated you have an extremely poor grasp of even the basics of climate theory, a reluctance to improve your knowledge, and yet on that basis believe you know more than the experts. You have so far failed completely to overturn any of the science here. You have not stated as requested where you agree or disagree with Tom's response on your CO2 outgassing fantasy.
"You might also tell the moderatorer you have never received a more thoughtful, intelligent, knowledgeable, insightful response." ROFLMAO!
-
nigelj at 12:15 PM on 7 December 2016Trump and the GOP may be trying to kneecap climate research
John Warner, I have read all your posts, and broadly I disagree with your reasoning and conclusions. Much of what you say is hard to follow, and looks wrong to me, and Tom Curtis has much more in depth climate knowledge than me and has picked holes in the same things. I also cant see anything incorrect in what Tom has said, and his notes on the ice age cycles were illuminating and clear.
Tom has also shown you the respect to respond to specific issues you raised. Now its your turn to respond to his specific points especially in post 20, points 1-4.
You appear to believe CO2 is coming from the oceans or some other natural source. The oceans are acidifying (getting less alkaline) so are absorbing CO2, not emitting it (in a net sense over decadal time periods).
Volcanoes and the biosphere are ruled out as significant sources. Theres a ton of research on that and you havent even begun to falsify it. You would have to show in precise detail where its wrong, not just generalise or do your own alternative version..
There are many things that show increased CO2 comes from fossil fuels rather than other sources. The population of the earth has gone from 1 billion to about 7.5 billion in just the last 150 years, which represents a huge increase in fossil fuel use correlating rather well with increases in atmospheric CO2.
Sure warmer and warmer water absorbs less and less CO2 but so what? it has not reached saturation and when it does that would obviously present us with even more problems.
-
chriskoz at 11:42 AM on 7 December 2016From the eMail Bag: CO2 in the air and oceans
RedBaron, nigelj,
THere are no examples of such feedbacks. As you correctly asserted @2, the stabilising feedbacks act on a long timeframe of millenia. Ultimate known negative feedback of rock weathering acts on 100ky+ timeframe. Such timeframe is by definition irrelevant to humans and to human civilisations. Talking about "reinforcing" those feedbacks, while cranking the main control knob (CO2) to the overheat rate never seen in many milion years is just like joking. A sweet fairy tale, but the physics & the numbers tell you it's not a real tale.
-
chriskoz at 11:17 AM on 7 December 2016Fake news tries to blame human-caused global warming on El Niño
ELIofVA @7,
I divided this net sequestration by nature by the world's population to come up with 2.57 tons/person/year to achieve net zero co2 emissions.
You're rincorrect here. Nature (mainly oceans and biosphere) is currently sequestering human C from the atmosphere at the reate of about half of human's emission rate. If we lower the emmision by half, then the sequestration by nature will also adjust accordingly and will become about a half of new emission rate (1.3 tons/person/year accodring to your calculation): the situation we had ~40years ago. For the sequestering forces of nature to come "in ballance" with emitive forces og humans, thett human emissions must drop well below the current rate, below 5%, the lower the better. That's why scientists who know those number emphacise a complete (or at least ner complete) decarbonising of global economy is a must do to stabilise Earth's energy balance and climate.
The above is what we know for sure. On top of that are positive feedback that we know have happened in the past but we don't know enough to quantifi them, like e.g. warming ocean becoming carbon source in the long term. We know such feedback happened in glacial cyccle timeframe (ca 10ky) but we don't know why. In case of AGW timeframe presently, we just ignore the warming ocean CO2 feedback and hope that it does not happen in time the action be taken to bring emission rates to zero.
Very few (if any) negative feedbacks are known that would allow a "breathing space" i.e. increased carbon budget for humans to burn without climatice consequences. Your back-envelope calculation allowance certainly cannot be sustained (if the goal is Earth climate stabilisation), although in short term is better than doing nothing and burning as much coal as possible, as current president-elect wants to do.
-
nigelj at 10:07 AM on 7 December 2016Fires and drought cook Tennessee - a state represented by climate deniers
Michael Sweet @9, I agree the IPCC are conservative, partly because their reports have to be signed off by governments, and some of these have interests in playing down climate change. This conservatism should certainly be pointed out to school students.
I suppose the question is whether to teach about global warming in school, and also secondly whether to include both the mainstream and skeptical views. Whatever is done will have positives and also problems, as you point out some of the problems. However I believe ignorance is not bliss, and the basic mainstream science should be taught, and also some of the sceptical positions should be acknowledged.
If students feel they are getting too brainwashed into just the mainstream position this could have the unintended effect of making them sceptical and they will read nonsense in their own time uncritically. Better to show them the sceptical arguments at school and their weaknesses.
Of course I'm being idealistic. It would not be easy to get schools to do any of this correctly. But maybe it should be tried.
-
nigelj at 09:52 AM on 7 December 2016From the eMail Bag: CO2 in the air and oceans
Red Baron @3, that is a good thought but do you have any examples?
-
Tom Curtis at 09:23 AM on 7 December 2016Trump and the GOP may be trying to kneecap climate research
john warner @24, the Global Mean Surface Temperature from Jan 1979-Dec 2015 was 15.1oC with a margin of error or about +/- 1oC (I would have to email a member of the BEST team to obtain a precise value). The trend temperature increase over that period was 0.66oC. The time period was chosen to approximately match that of the satellite record but to avoid any contamination from the seasonal cycle. This is according to the Berkeley Earth Surface Temperature Land Ocean Temperature Index (BEST LOTI).
-
Tom Curtis at 09:12 AM on 7 December 2016Trump and the GOP may be trying to kneecap climate research
john warner @23, how did you obtain that regression? Specifically, what data did you use? Was the data used in monthly or annual values? Did you use an ordinary least squares linear regression as obtained from the linest function in Open Office and Excel?
Moderator Response:[PS] I rather doubt john warner has will or skill to engage in meaningful discussion of the science and so far has simply derailed this thread with offtopic "discussion". I have asked him to address specific points so that any further discussion to move to appropriate threads. Please dont chase after wild horses if/until john has more clearly identified his points of departure.
-
john warner at 08:40 AM on 7 December 2016Trump and the GOP may be trying to kneecap climate research
Tom Curtis at 20. Using my temperature data I say the earth's average annual global surface air temperature has increased .444oK since 1979. Can you make a statement like that from your data? The key to doing research is knowing what you are looking for. For all there knowledge global warming believers have they can never answer the simplest questions. What is the earth's average annual global air temperature? I am not going to give you the answer until you give yours.
Moderator Response:[PS] Sloganeering.
The impossibility of measuring global absolute surface temperature as been known for a long time and if you havent read Hansen and Lebedeff 1987 then it is time you did. Then you might actually understand why anomalies are used instead.
At this point you are not engaging in any meaningful conversation and instead are rambling from topic to topic. I would request that answer Tom Curtis' point, stating clearly where you agree and where you disagree before jumping off at another tangent. If you not are interested in engaging with points raised, then your time commenting here is over.
[RH] [edit] Here is a very good explanation of why it's better to use anomaly over absolute temperature. LINK It's a sure sign of a rookie who insists on using absolute temps.
-
RedBaron at 07:44 AM on 7 December 2016From the eMail Bag: CO2 in the air and oceans
@ nigelj
"This is too long term to benefit humanity."
Debatable. Obviously humans can effect the results. Rather than accidently triggering the reinforcing feedbacks (which is what we have done so far), there is always the option of purposely triggering the stabilizing feedbacks.
-
nigelj at 07:24 AM on 7 December 2016From the eMail Bag: CO2 in the air and oceans
As far as I'm aware one of the few remaining uncertainties about climate change is the exact nature of some of the positive and negative feedbacks. It does appear on the best evidence available that positive feedbacks outweigh negative feedbacks. Given periods of warming in the past last a long time this is evidence positive feedbacks dominate over negative ones.
It appears that positive feedbacks may be dominant in the short to medium term (we are already seeing positive feedbacks from the Arctic) but periods of warming do not seem to be permanent. Perhaps negative feedbacks like elements of the carbon cycle may kick in much longer term (over millenia). This is too long term to benefit humanity.
-
MA Rodger at 07:02 AM on 7 December 2016Trump and the GOP may be trying to kneecap climate research
john warner @23.
If you wonderful regression was anything more than the result of a curve-fitting exercise, you could, say, use it with HadCRUT4 (suitably re-based) to calculate CO2 levels back into the 1800s. Alternatively, you could use it with CO2 data obtained from ice cores to back-calculate a temperature record.
I have to say that the results of such calculations do suggest your regression is nothing but curve-fitting.
-
nigelj at 06:50 AM on 7 December 2016Fake news tries to blame human-caused global warming on El Niño
ELIofVA @7, I think you are totally correct about Vietnam, The Sandinistas, and Iraqs so called weapons of mass destruction. However this was all politicians not getting things right or not being honest, or just indulging in a twisted ideology. The media can only report what they say.
Fake news is different as it means the news itself becomes infiltrated with basic factual errors about routine news stories, and these are hard to spot. Its insidious and by the time its corrected nobody notices, and the fake news has spread like a virus and becomes accepted wisdom.
It also becomes hard to know what are genuine news organisations with some sort of regulatory standards over them , and what are pretend organisations that are unaccountable. The internet means anyone can call themselves a news organisation, but they may be operating from a country that has no control over them or regulatory requirements, yet the organisation effectively has global reach. Of course people should check the credentials of the website they are looking at, but many people dont.
Plus you get people like O'reiley on Fox news. Of course he isn't presenting the news as such, its his opinions and general commentary, so a different issue, however much of what he says seems totally unsupportable to me and very misleading. However this is the price we pay for free speech, so its a sort of paradox.
-
william5331 at 04:56 AM on 7 December 2016Fake news tries to blame human-caused global warming on El Niño
I apologize. This is a political comment and probably ad hominem but certainly not off topic. But then, the whole problem with not mitigating our carbon output is political. Any year 12 science student could lay out what we need to do. The politicians simply won't do it because they are in the pocket of vested fossil fuel interests.
Complaining about false news is all the flavor of the week but it is hardly surprising. The neigh sayers (mis-spelling intended) have had an example from the best. Would, for instance, anyone except a dyed-in-the-wool bible belt thumper consider O'Riley of Fox news a journalist. The America media has provided a constant diet of false news for decades.
We, the rational few, can but try our best but In the end it is economics that will carry the day. When, for instance, a truly affordable electric car is produced and the public realizes that they can drive about 6 times as far on a dollar's worth of electricity than on a dollar's worth of petrol, the speed of the shift will rival the shift from horses to cars. One hopes the economic factors will be in time to save us from ourselves.
If this year is a harbinger of things to come, we don't have all that much time.
-
john warner at 03:31 AM on 7 December 2016Trump and the GOP may be trying to kneecap climate research
KR @ 19 My regression was dCppm/yr = 1.70ppm/yr + 1.94ppm/oK * ToK
T is the temperature anomaly around the 1981 to 2010 baseline. For example if T is 0 the carbon dioxide increases 1.7ppm/yr. In 1998, an El Nino, year the temperature anomaly T is 0.5oK dC = 1.7ppm/yr + 0.97ppm/yr = 2.67ppm/yr
-
barneyfife303 at 03:21 AM on 7 December 2016From the eMail Bag: CO2 in the air and oceans
How does the Ocean fight acidification?
-
ELIofVA at 01:42 AM on 7 December 2016Fake news tries to blame human-caused global warming on El Niño
The problem of repeated lies gaining credibility in the political discussion has been with us for a long time. North Vietnam's attack on US Navy in the Gulf of Tonkin was a lie that resulted in an escalation of the war (Johnson). Nixon has a secret plan to end the war. Sandinista Nicaraugua has communist expansionist goals (Reagon). These are only a few examples of lies that had political weight. Suddahm Hussein had weapons of mass distruction and was involved with 911 attacks (GW Bush). In the US, we are threatened, not by terrorist, but by our polorization and our retreat to communities that support our biases. The internet has exasperated that trend. Of course, I have learned a lot that I believe is objective such as on this web site. If the human tendency is to avoid objective truths and their implications, then we will appropriately pass so the the world (never really threatened) can reevolve without us. Our only hope with respect to climate change is for the culture at large to recognize that we must limit our emissions to what can be sequestered to avoid adding to the carbon concentration in the atmosphere. This includes the recognition that that is the source of global warming. With that recognition, we can build an economy that understands that limit. We know every year exactly how much over net zero emissions we contribute to co2 buildup by comparing air samples, commonly measure in part per million. I want people to think of this as a debt. When we achieve net zero carbon emissions, we will no longer be adding to the debt. However, the carbon already emitted will continue to cause global warming (reduced ice reflection, increased dark blue ocean heat absorption, melting tundra adding methane GHG, et). To pay down the debt, we must emit less than can be sequestered by natural or other means. To pay back this carbon in atmosphere debt, we need to imagine an economy the is net sequestration of carbon (humans emit less than can be sequestered). Achieving the recognition that carbon buildup in the atmosphere is the source of the problem is a huge cultural we are looking for. For those that do recognize this, we need to measure our carbon emissions to see how we need to change. I used figures from IPCC 07 report, https://www.skepticalscience.com/human-co2-smaller-than-natural-emissions.htm posted on this website to determine net sequestration by nature and divided by world population. To share this fairly, I divided this net sequestration by nature by the world's population to come up with 2.57 tons/person/year to achieve net zero co2 emissions. With this understanding, we have a chance to structure support localling and globally to achieve this standard. Keeping it vauge works for the interest of procrastination and denial.
-
bvangerven at 00:28 AM on 7 December 2016Fake news tries to blame human-caused global warming on El Niño
I have a theory that natural evolution has stopped for mankind. Natural evolution makes sure that only the strongest and smartest individuals of a species survive, creating stronger and smarter offspring. Our civilization however makes it possible for everyone to survive, no matter how stupid they are. Take a primitive society. Any farmer who doesn’t observe the weather and the time of year will sow at the wrong moment and his crops will fail. Any hunter-gatherer who eats the wrong - poisonous - plants will die. Facts are rock-solid for such people. It is ironic that it is our scientifically advanced, highly technological society that allows people to blindly deny basic facts without being “punished” for it by nature.
-
john warner at 23:11 PM on 6 December 2016Trump and the GOP may be trying to kneecap climate research
Tom Curtis @ 15 I like to get to the heart of the matter and I don't feel like typing pages of notes to justifying my petty technical criticisms. I realize the incredible scientific inferences about reality from the summary statistics you report will easily survive my petty criticisms. I looked at how you calculated your independent variable and the scale on the x axis. Carbon dioxide concentration increased 1.7wpsm in 163 years. Carbon dioxide added 0.01 watt per square meter of radiative forcing every year and controlled 81.1% of the of the earth's air temperature variation for 163 years. And just one watt per square meter of infrared radiation absorbed by this gas can raise the earth's air temperature 0.58oK. None of these inferences conformed to reality. [mod. - Are you suggesting here that every PhD level researcher, every National Academies, and all the most prestigious scientific institutions around the world, all don't understand the basic science on climate change? It's a stunningly audacious statement!] My understanding of the global warming controversy is that the earth controls its own temperature [How? By what mechanism or process does this happen?] and there should not be a correlation between forcing factors and air temperature. That is why in comment 9 I showed how the earth mitigates a 23.5wpsm change in solar radiation power every year. In the comment at 17 I regressed change in carbon dioxide against air temperature and found that temperature explained 58% of the variation in carbon dioxide. But I also regressed air temperature against the change in carbon dioxide and also got an R2 of 58% but the regression results did conform to reality. Returning to your regression the challenge was to figure out how you could you get such a high correlation with annual air temperatures born of chaos with a de dimimus forcing factor and a carbon dioxide sensitivity coefficient 2.951 times higher than the theoretical scientific value. And the answer was obvious. A proxy measure for air temperature was being regressed against another proxy measure for air temperature. But since proxy measures are so bad, why the high correlation. When the ocean temperature is higher less atmospheric CO2 is sequestered from the CO2 created from burning fossil fuel and the parts per million increase for the year is higher than average. This would result in a higher annual increase in carbon dioxide radiative forcing for that year. If the ocean temperature is lower more atmospheric carbon dioxide is sequestered in the ocean and the parts per million increase in the air for the year is lower than average. The result is a decrease in radiative forcing for that year. The physical connection between the two variables could not be closer because the dependent variable is the Global Mean Surface Temperature and 70% of the GMST is sea surface temperatures measured by ship logs and recently by satellites. Finally, why is the sensitivity so high. In a linear regression if I enter the data for the independent variable by one decimal place to small the coefficient will be one decimal place to high. By entering a too low forcing factor for the independent variable you got a too high carbon dioxide sensitivity coefficient. As currently generated it has no scientific meaning. Whatever it is, it shows a relationship between carbon dioxide in the air and sea surface temperatures, which we already know. In order to have the moral force of science for public policy, a quantitative scientific study has to have a rigorous scientific explanation and the summary statistics have to conform to reality.
Moderator Response:[RH] These last two posts read as little more than indecipherable ramblings. Maybe Tom can make sense of it but this activity is very much trying the patience of moderators.
We encourage substantive discussion on climate matters. Perhaps you can endeavor to organize and present your thoughts in a more coherent manner so that people here can better understand the points you're trying to make.
-
john warner at 22:30 PM on 6 December 2016Trump and the GOP may be trying to kneecap climate research
Tom be patient with me. I have been working hard on your regression. I have pages of notes to justify my petty criticism of your mistakes. I only sent you those two comments to let you know I was interested. I apologize for not telling you the first note was a comment I sent to an Economist post commenter November 24, and I was not being critical of him. I was just saying I can get the facts. Neither of us knew anything about the annual temperature effect. And it was not until I finished my comment that I realized the magnitude of the annual temperature effect made carbon dioxide less believable. In the comment at 17 using temperatures I calculated that carbon dioxide only accounted for 24.17% of the current temperature trend of 0.0120K per year. Converting to air temperature equivalent radiative forcing to heat both the air and the surface as you introduced adds up to 0.7612wpsm per year. 0.0148wpsm per year divided by 0.7612wpsm per year equals 1.94%. You were trying to augment the carbon dioxide sensitivity coefficient with the heat coming out of the surface that you forgot to put in. Maybe you can give up on this one and credit the other 199.7852watts per square meter attributable to the other forcing factors with heating the surface. The second was a comment I sent to Dan Lashof at the National Resource Defense Council in November of 2012.
-
rugbyguy59 at 14:11 PM on 6 December 2016Oceans heating up faster now than in the past 10,000 years, says new study
jzk,
While the paper summary says the findings support the idea of a global MWP, this only means the data here is consistent with it. This isn't real evidence of a global anything because it is simply of one area. There are many valid studies in that list of "Studies supporting a MWP" on that other website of ill repute, which say their findings support the idea of a global MWP. However, those studies are not put together by anyone I'm aware of. When people do put all the data together (PAGES2K for example) there doesn't seem to be one. Even the MWP that seems to appear in the Northern Hemisphere studies is a pale shadow of what deniers want it to be.
When I look at the graph of OHC this study presents, it seems to be quite analogous to the same period in Marcott. Although the beginning of the lang slow cool down begins earlier. Granted I'm no scientist but that seems to me to not really support a global MWP or LIA as described by denialists. There is no sudden or pronounced warming or cooling in either period there is just the long term trend (Milankovitch Cycles?) plus noise.
-
nigelj at 08:24 AM on 6 December 2016Fake news tries to blame human-caused global warming on El Niño
JW Rebel @4, yes some news stories or other internet claims are pretty obviously fake, but during the election reputable looking organisations were saying Hilary Clinton had been arrested by the feds over the email issue. This has a little more credibility, and other fake news accusations were made about her financial situation that were subtle and sophisticated, and plausible sounding, and many people would get sucked in.
The internet has lifted it all to a completely new level as numerous organisations exist a mouse click away that have plausible sounding, pleasant names that hide hidden agendas. Or they sound like traditional news media but arent really, and just re-hash information. It is much harder for ordinary people to sort fact from fiction, and this is leading to some people saying truth is whatever you want it to be.
-
JWRebel at 07:54 AM on 6 December 2016Fake news tries to blame human-caused global warming on El Niño
There has always been a lot of fake news and propaganda. Most of it is easily discernible as a category all of its own, featuring Hillary Clinton's new pregnancy or extra-terrestial influences, or the enemy engaging in perversions and eating babies, etc. It only becomes a problem when the genres start to run. Well do I remember my children of 4-5 being confused by a televized royal wedding, confused by the fact that it was like a fairy tale but presented as news. With a little good will people quickly learn to distinguish — it's mainly the good will that is the problem.
On the bright side, Delingpole seems to embrace the fruits of climate science research, throwing around 'El Nina' and the 'decadal oscillation' as if they have become as familiar as the words we use for kitchen utensils.
-
nigelj at 07:38 AM on 6 December 2016Fake news tries to blame human-caused global warming on El Niño
I can see an increasing temperature trend in the graph above, and individual peaks from el nino. In fact squinting my eyes down it appears the el nino peaks are getting larger with time, with the 2015 peak being very high. This suggests the warming atmosphere may be altering el nino itself. I would be interested if there is evidence of that.
I read the shooting incident just an hour ago. This shows the real danger of the world view of the alternative right in America. The internet is providing an easy platorm for fake news that is enabling naturally paranoid people to join up. Its almost like society in America is developing a case of mass schizophrenia, in the same way you sometimes get outbursts of group hysteria.
-
knaugle at 05:14 AM on 6 December 2016Fires and drought cook Tennessee - a state represented by climate deniers
Topal #5
Actually the answer to your question is "mostly no". The fire was likely caused by a careless human, or a malicious one. Global warming could have contributed to making the conditions of the fire worse.
Besides real scientists rarely answer with an unqualified "Yes!" or "No!" to any question of contemporary science.
-
John Hartz at 05:01 AM on 6 December 2016Fake news tries to blame human-caused global warming on El Niño
For more details about the story ubrew addressed in his comment, see:
Son of Trump security adviser spread baseless 'pizza gate' conspiracy by Tai Kopan, CNN, Dec 5, 2016
-
ubrew12 at 03:58 AM on 6 December 2016Fake news tries to blame human-caused global warming on El Niño
Here in America, a man shot up a DC pizzeria. A fake news article said Hillary Clinton and her chief of staff, John Podesta, were running a child sex ring in the back. Gullible people were broadcasting this and death threats were being issued to the restaurants owners and workers. Ordinarily, this could be identified as a new National Security Threat, worthy of direct action by the incoming National Security Advisor, John Flynn. The only problem is: Flynn was one of those people rebroadcasting this fake news segment. So, this is the context for this latest, wildly fact-free cherry pick by the climate disinformation artists, who know their audience doesn't read, or even want to see, the 'fine print'.
-
Tom Curtis at 10:55 AM on 5 December 2016Trump and the GOP may be trying to kneecap climate research
John Warner @17, your style of writing verges on inchorence, making it difficult to determine your argument, when you even have one. A major contribution to that effect is your tendency to take up distinct arguments within the same paragraph; but to also scatter the discussion of any given argument across multiple, not necessarilly consecutive paragraphs. You appear, however, to be raising three major arguments, and a minor one:
- That I did not cite my sources of data (the minor point);
- That the TLT satellite temperature record, and the UAH version of that record in particular is, is the only temperature record that should be used for climate analysis;
- That in any event, discussion should focus on energy levels, rather than on temperature per se; and
- That any correlation between CO2 forcing and temperature is a consequence of outgassing of the ocean induced by the rise in global temperature.
If I have missed, or mistated an argument, please specify the argument clearly by explicitly stating the claim then in sequential paragraphs, with a separate paragraph for each line of evidence in favour of the claim, state the evidence for each claim; before then stating the next claim and so on. Your thoughts are not so brilliant that we should be required to wade through "word salad" to try and garner them.
Taking the identified points consecutively on the list above:
1) You claim, "Since you did not cite the sources I have to gather my own facts." In fact, I did better than cite sources, I provided active links to the data (except for Mauna Loa which I thought sufficiently well known to not require such a link). Consequently, you did not need to "gather your own facts" because I did not provide you with the appropriate citations. Further, you did not "gather your own data". The data you use was gathered by (mostly) NOAA and NASA and processed by Spencer and Christy. You merely cherry picked the data most suitable to your narrative, ignoring approximately 80% (by time) of available temperature data to do so.
2) Your preferred temperature data is not temperature data specically. Rather it is the microwave signal from Earth as detected by a series of different units from a series of different platforms. These platforms in turn have had decaying orbits and orbits not in tune with the day night cycle such that different locations are observed at different local times on consecutive orbits. On top of this, the quality of the instruments themselves are known to decay in space, and the altitude weighting profile of the observed signal changes with the altitude of the surface, and depending on wether the signal processed is over land or sea. On top of that, each data point represents an average of signals across a wide swathe so that all TLT data is "homogenized" automatically, despite the major objection to the instrument record mounted by AGW deniers being that homogenization.
Because of these difficulties, the processing of the microwave signal data required to generate a temperature record is far more extensive than that required for the instrumental records. The difficulty of the process has resulted in a number of major corrections over time, partly listed below:
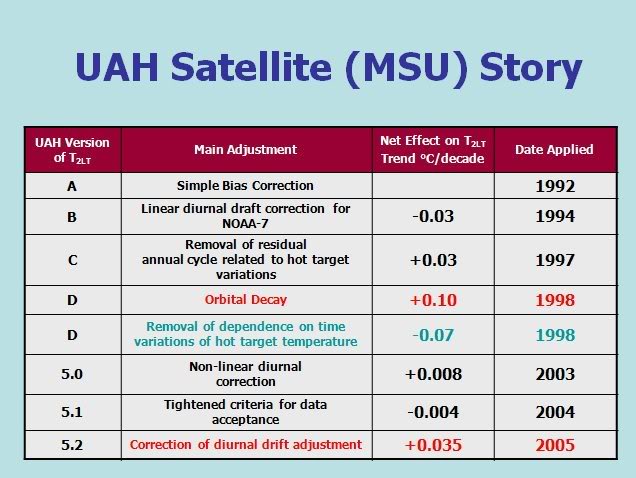
These corrections have continued, and Spencer and Christy are in the process of introducing a major new correction at the moment. Curiously at the same time as they are introducing a correction that will reduce the trend, the rival RSS product (which produces a different record from essentially the same data) is introducing a correction that increases the trend. Also at the same time, Spencer and Christy are ignoring a peer reviewed correction to their own product which would also increase the trend. It should be noted that (unlike the case with the instrumental record), the corrections are large relative to the "observed" trend. Worse, there are at least four independent analysis of the microwave data to determine a TLT temperature, all of which come up with different trends, with the differences being large relative to the observed trend.
In contrast, with the instrumental record, using partially overlaping data sets, 5 major institutional records using different techniques all come up with essentially the same result. One of those, the Berkeley Earth Surface Temperature project (BEST) was headed by people noted for their criticism of climate scientists, and funded by leading climate denier funders, the Koch brothers. It would rightly have been regarded as the denier's temperture record until the deniers repudiated the result (having earlier affirmed that the method was appropriate and adequate). Further, at least 4 independent private citizens have processed the data and also come up with essentially the same result.
The upshot is that we know fairly well what the instrument record tells us about GMST, whereas we do not know what the satellite temperature record tells us because we do not yet know the correct means of processing it. Therefore, if anything we should prefer the instrumental record. We certainly should not truncate 80% of the data because we refuse to use any record other just one satellite record.
[PS] Further details of satellite versus thermometers discussed here and a good place for any further discussion, before this goes too much further offtopic.
3) You write:
"Adding ocean and land absorption of heat diminishes the role of carbon dioxide when your consider air, land and oceah heat versus only air heat. You logically increase the role of natural heating forces."
However, when you get around to discussing it, you do not discuss the energy involved, but restrict the discussion to temperature trends (degrees K per year). You give rough energy conversion factors but no data.
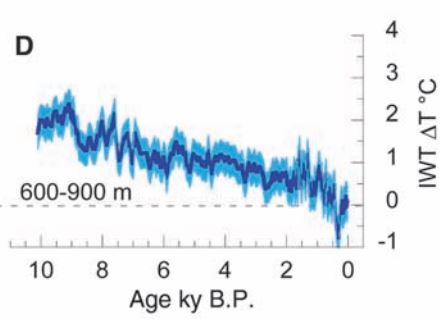
Instead, I the 0-700 Meter Ocean Heat Content data from the KNMI Climate Explorer, and regressed it against the CO2 forcing as determined from Mauna Loa. The result is a correlation of 0.917, and R-squared of 0.841, and a regression of 13.55 (+/- 0.445) x 10^22 Joules /(W/m^2). The 0-700 OHC data represents sufficient of the Earth's total surface heat content anomaly to be considered representative over the long term. That regressing the OHC against CO2 forcing provides as much support as does regressing surface temperatures means that your objection (for which you provide no relevant data) is merely a smoke screen.
4) Finally, with regard to cause and effect, it is a matter of simple physics that increasing CO2 concentration will increase surface temperature, and that increasing temperature will increase CO2 concentration in the atmosphere. The question is, what is the relative magnitude of each effect. If we look at the record over the recent glacials, we see (according to this graph) a change of 100 ppmv for a 10 C temperature increase:

That represents 10 ppmv/C meaning the 120 ppmv increase in CO2 since the preindustrial era, if caused by the temperature increase, must have required a 12 C increase in GMST to match it. That is somewhat exagerated. GMST are widely thought to have represented just 50% of the Vostok variation, which would reduce the required temperature increase to 6 C, but again that is way to much. Using your formula, dC=1.70+1.94*T, a 120 ppmv change in CO2 concentration requires a 61.85 C change in temperature to drive it. Taken seriously, if you actually think that is the relationship between CO2 concentration and temperature, you must think the Earth to be ice free and uninhabitable, with a GMST of 76 C.
Your formula is, of course, in error, having been taken from too small a data set. But a variety of estimates show that the rise in temperature can have contributed no more than 10% to the increase in CO2 concentration. That is consistent with the ten lines of evidence that show conclusively that the recent increase in CO2 concentration was driven by anthropogenic emissions. Disagreeing on this point is intellectually as unsuportable, given the evidence, as geocentrism.
From the fact that the vast majority of the increase in CO2 over the 20th century was anthropogenic in origin, it follows that the strong correlation between CO2 forcing and temperature, and the statistically significant regression demonstrate a major impact of CO2 on GMST.
Moderator Response:[PS] Also should note (amplified in Tom's last link) that rising ocean temperature releases CO2 over long term (with ocean mixing). In short term ocean is net absorber of CO2 not a source. See Tom's last link for evidence.
-
Trump and the GOP may be trying to kneecap climate research
john warner - You have shown a great love of very exact numbers, but have not IMO demonstrated an understanding of the science.
For but one example: "I statistically proved that the earth’s air temperature determines the growth rate of carbon dioxide in the air" - CO2 levels over the last half million years of Earths history varied between ~190 to ~280ppm over the glacial cycle, with a temperature response of perhaps 10-15ppm per degree C global temperature change. Yet over the last 100 years with about 1C in global temperature change there has been a rise in CO2 of over 100ppm, more than 6X the thermal response. And that is without looking at the isotopic evidence, increasing ocean CO2 (your claim would seem to require decreasing levels there as CO2 moved to the atmosphere), or our excellent knowledge of just how much carbon we've burned since the Industrial Revolution. Your assertion of temperatures forcing CO2 rise is simply incorrect - it's human action.
I would suggest that instead of pulling data from the most convenient internet sources and running a calculator, producing numbers with no attention to significant digits, that you instead look into the actual science behind our understanding of climage science - The Discovery of Global Warming by S. Weart would be an excellent starting point for you.
-
Eclectic at 09:51 AM on 5 December 2016Trump and the GOP may be trying to kneecap climate research
John warner, you would clarify things enormously
(a) if you specified which part of air temperature you are referring to. Stratosphere? Upper troposphere? Mid-troposphere?
(b) if you discussed how your idea of rising planetary temperature (as cause of CO2 rise by out-gassing from the oceans) does differ from the similar ideas of Murray Salby et alii. [Perhaps you are unaware that Salby's ideas have already been thoroughly debunked.]
(c) if you specified the actual mechanism/s by which the past century's rapid global warming occurs [in the alleged absence of CO2 greenhouse effect]. So far, you have failed to do so.
(d) if you indicated how the well-understood and well-measured greenhouse effect of CO2 comes (in your eyes) to be null and void.
There is a very real problem here - since the world is a real physical entity, and not an abstract mathematical construct. John warner, you need to need to address the physical realities.
Prev 427 428 429 430 431 432 433 434 435 436 437 438 439 440 441 442 Next


