


 Arguments


Recent Comments
Prev 441 442 443 444 445 446 447 448 449 450 451 452 453 454 455 456 Next
Comments 22401 to 22450:
-
william5331 at 13:57 PM on 25 February 2017As EPA head, Scott Pruitt must act on climate change
Pruitt can drag his feet for 4 years and if Trump gets elected again, for a further 4.
-
Increasing CO2 has little to no effect
Rudmop - I'm afraid your arguments, no matter how elegant, have two ma6jor problems. (a) They don't match the numbers calculated repeatedly by multiple experienced scientists since Arrhenius 1896, and (b) they are directly contradicted by experimental evidence that supports the consensus views, see Harries et al 2001 satellite spectral data and following papers for that - doubling CO2 will directly increase temps by about 1.1C, with feedback increases in H2O and others bringing it to roughly 3C per doubling.
Empirical evidence flatly contradicts your claims - you might want to reconsider your assertions.
-
Tom Curtis at 10:02 AM on 25 February 2017Increasing CO2 has little to no effect
The second piece of block text by Rudmop @238 is a response to my response to his first posting of his ideas on another thread. Briefly, my criticisms were that:
1) "The strength of the greenhouse effect of a given gas is a direct function of the difference in power radiated to space by that gas and the power radiated by the surface, and intercepted from going to space by that gas. As the power radiated to space is an inverse function of the temperature of the gas at the mean altitude of radiation to space, the vertical distribution of the concentration of relevant gases is a fundamental property without which no valid determination of relative greenhouse effect of different gases can be made."
2) "The energy trapping capability of each molecule is not simply a function of the sum of the energies at the absorption peaks in the spectra. It is also a function of the relative energy radiated at those wavelengths from the surface"
3) "You have not explained, and nor can I see what relevance rates of diffusion have on the result. In particular, concentration levels of CO2 (in particular) and to a lesser extent H2O are fairly stable so that rates of change in the concentration in still air (diffusion) have no bearing on spatial patterns of concentration, which you do not allow for in your equation in any event."
I note that Rudmop has changed his formula to take into account my second point.
He rejects my first point saying:
"Carbon dioxide molecules at this altitude, provided the density separation does not result in a near extinction, will actually be radiators of heat. At this altitude, there are more possible vector directions that point to space, than point back to the surface. So as excited carbon dioxide molecules spontaneously radiate photons, there will be a more favorable amount of heat loss than heat gain by the climate. These higher altitude molecules cannot hold on to any trapped energy for an indefinite amount of time. Nothing can do that. Everything radiates its heat to the colder gradient as a necessity of the 2nd law of thermodynamics. CO2 at the TOA is not going to collect more heat than it radiates."
What Rudmop neglects in this response is that emissivity equals absorptivity. It follows that if a given thickness of atmosphere has more radiation at a given wavelength impacting upon it then it will radiate due to its temperature, it will absorb more radiation than it emits. As the CO2 in the upper troposphere is colder than that in the lower troposphere, or at the surface, it will absorb more radiation than it emits, and therefore the upward IR radiation from that layer will be less than the upward IR radiation entering that layer.
The notion that a CO2 molecule "... cannot hold on to any trapped energy for an indefinite amount of time", while accurate, is irrelevant. Even at 85 km altitude (US standard atmosphere), an excited CO2 (or H2O) molecule will, on average, experience 380,000 (a million) collisions before it would typically have spontaneiously returned to a base energy state by emitting a photon. Within the troposphere the figure is closer to 5 billion collisions. Therefore absorbed radiation is rapidly transmitted to the rest of the atmosphere as heat, and stored by the whole atmospheric layer. The emissions from that layer, in turn, are almost exclusively from CO2 (or other greenhouse gases) that have entered an excited state due to collissions from with other molecules. That is why the emission fits the profile of thermal radiation (within the radiating wavelengths). And because the radiation is thermal, it is controlled by the temperature of the layer, not the rate of absorption of photons from lower layers in the atmosphere.
With regard to my third point, Rudmop now clarrifies by saying:
"As the greenhouse gas molecules trap heat, they must be able to transfer their heat to other molecules by making random collisions with the other molecules. The speed and efficiency at which they can do this will determine their “strength” as a greenhouse gas. Water vapor is lighter and moves more quickly than Carbon dioxide, if both are at the same temperature."
In fact, the relevant ratio here is the rate of natural reemission molecules in an excited state to the rate of collision. As noted above, that does not rise above about 1 in a 380,000 below the thermosphere, either for CO2 or H2O. Allowing that CO2 radiates before collisions 2.5 times as frequently as H2O, that only raises its non-thermal radiation to 0.0003% of the total (compared to 0.0001% for H2O) even in the upper mesosphere. In short, the difference is negligible for all practical purposes.
-
John Hartz at 05:43 AM on 25 February 2017Increasing CO2 has little to no effect
Rudmop: If you have not already done so, I highly recommend that you peruse The Science of Doom website. It is full of equations about key components of the Earth's climate system.
-
Rob Honeycutt at 03:20 AM on 25 February 2017Increasing CO2 has little to no effect
Rudmop... So, just to be clear, you are aware that observations contradict your assertions. Right?
-
Rudmop at 03:11 AM on 25 February 2017Increasing CO2 has little to no effect
That submittal date is 2017, sorry. I cannot read my post as I type on my phone. Need to wait until this evening when I can access my computer.
-
Rudmop at 03:08 AM on 25 February 2017Increasing CO2 has little to no effect
I have submitted it to a scientific journal on Feb 21, 2016. I am also ready for talks.. I probably am going about giving up a lot, but to date, no one has shown this in the literature, except me here on this discussion blog for climate scientists. I will be giving a presentation at Occidental college tomorrow on my model here. I. In my submission t have done the math and provided the equations, with my own variables. I prefer zeta and and kapparently for my coefients. I explain my calculations an the resonance absorption frequencies that cause an excited molecule in a state of super position. I appreciate the efforts of those scientists who have given me rational food for though for my presentation. My less egocentric psyche did warn me about the possibility of giving away my ideas, however if there is a Nobel prize to be given for this, I have only disclosed the part, it takes much more that I will not present here and show the proof. If that is the case that my model is worth a Nobel prize, this important part is the half of it. The other half will be in the book and the article.
-
Tom Curtis at 01:51 AM on 25 February 2017Increasing CO2 has little to no effect
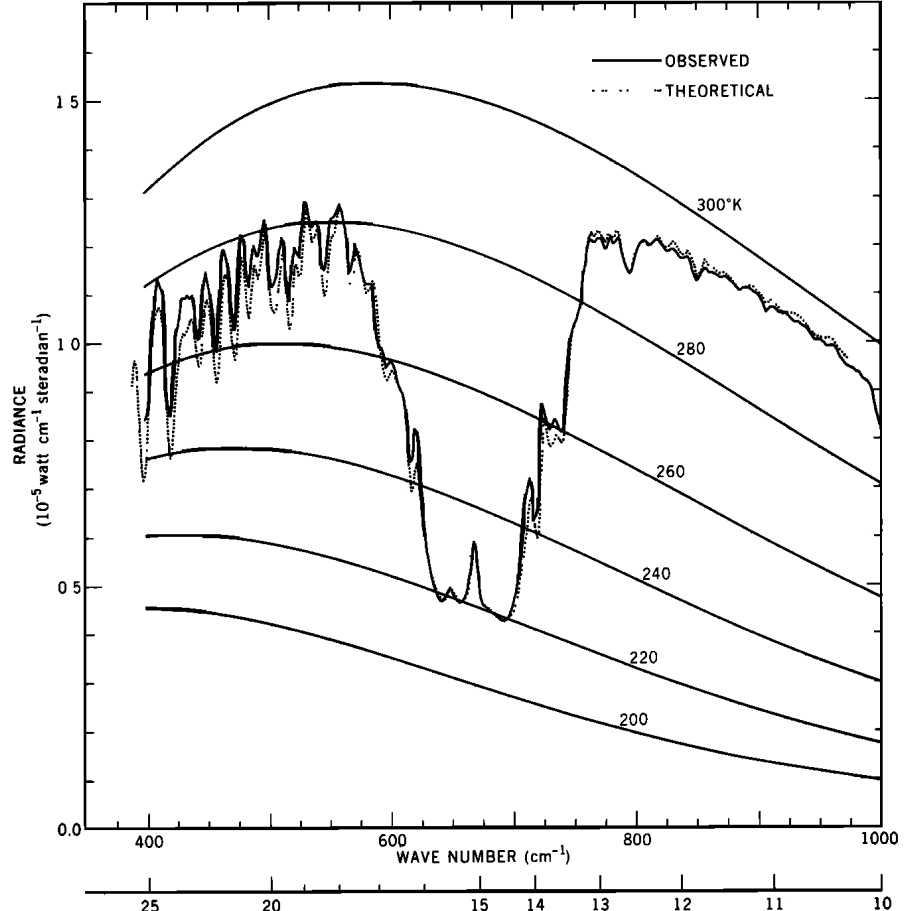
Further re Rudmop, here is a fuller version of the first comparison in my preceding post, with the data offset for easy comparison:
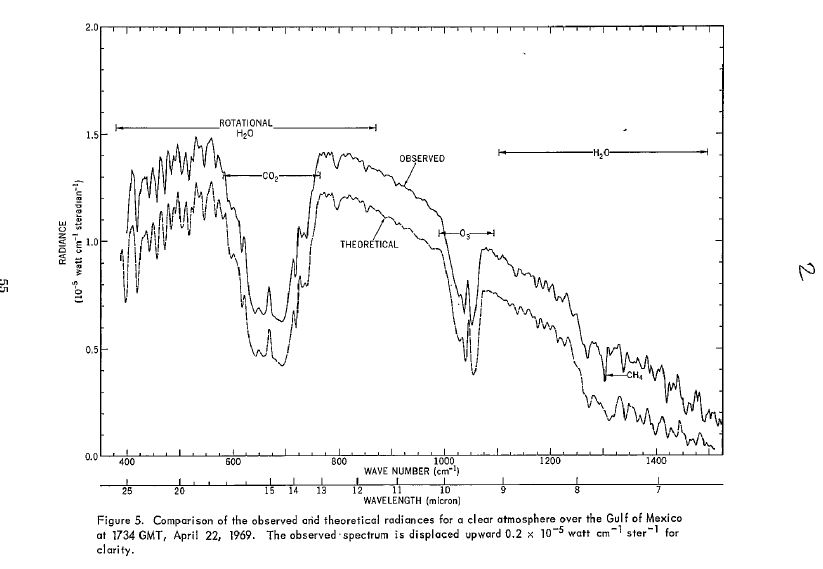
In reading such graphs, as a simple rule, a molecule traps an amount of energy per second cm-1 steradian-1 equal to the difference between the observed radiation at that wavenumber and the black body radiation of the surface. As can be seen, the 15 μ-meter wavelength (667 cm-1 wavenumber) is deep and distinct, unlike the neighbouring absorption by H2O.
Second, the effective altitude of radiation within the troposphere can be determined as approximately the difference between the radiation temperature and that of the black body at the surface, divided by the lapse rate. Thus the "shoulders" of the CO2 absorption band show absorption at about 12 km, while the neighbouring H2O shows absorption at an effective altitude of 6 km or less. That difference is the fundamental difference that makes CO2 absorption more effective per molecule than is H2O absorption.
Both of these features are features Rudmop claims are false.
-
Rob Honeycutt at 01:47 AM on 25 February 2017Increasing CO2 has little to no effect
Rudmop... "I trust that anyone who views this as a credible means to invalidate my model will know what that type of behavior clouds their scientific reputation. It is not how scientific discussions progress."
If you give us the math that shows your model, people here can evaluate it.
-
Rob Honeycutt at 01:45 AM on 25 February 2017Increasing CO2 has little to no effect
Rudmop... "I have provided a clear explanation of my model."
Not so much. You've written a rambling piece, that doesn't have any substantive math, and runs contrary to basic physics.
-
Rob Honeycutt at 01:43 AM on 25 February 2017Increasing CO2 has little to no effect
Rudmop... I'm curious. If you genuinely believe you have a model that substantively challenges the standard accepted model, why are you posting it here? If I had worked out such a thing I'd be submitting it to major scientific journals. And after that I'd be out shopping for the tux I'd need for my Nobel acceptance speech.
Yes, I know that sounds like a sarcastic comment, but that is the gist of what you're offering up. You're challenging basic physics which has been well understood and accepted for 150 years.
As a non-scientist I can already pick out several basic errors in your comment. But it seems counter-productive to go into those details being that the overall notion you're presenting is so utterly preposterous.
But you are correct to essentially suggest that all ideas should be entertained. So, for entertainment purposes... can you please paste in here your calculations? You know, something along the lines of this.
-
Rudmop at 01:42 AM on 25 February 2017Increasing CO2 has little to no effect
Sorry I don't have time for sarcastic retorts that attack my character, as well it is against the rules of the site which hats scientific discussion. I have provided a clear explanation of my model. There is an expectation that you will not use conflation as a means to invalidate it. It stands own as far as the science. So unless you can address where it fails, without using tactics of insults and conflation, I trust that anyone who views this as a credible means to invalidate my model will know what that type of behavior clouds their scientific reputation. It is not how scientific discussions progress. Good day.
-
Tom Curtis at 01:37 AM on 25 February 2017Increasing CO2 has little to no effect
Rudmop @241 states:
"My model does not violate any of the laws, and it serves as an alternative answer to a model that has failed on its predictions."
The models (plural) that Rudmop claims to have failed are the Line By Line (LBL), or lower resolution radiation models (or the modules within GCMs that serve the same function). It is they, not GCMs as a whole that determine relative contribution to the Total Greenhouse Effect of various gases. These models have produced such obviously failed predictions as this one from 1969:
Or these (all 134,862 of them) from 2008:

Here is the preceding data binned by surface temperature (a) and latitude (b):

In contrast to the LBL models, which predict easilly discriminable data for clear comparison with reality, Rudmop's model does not predict any observable quantity. Rather, it only predicts a quantity that cannot be directly observed. That is, its only prediction is not falsifiable by direct observation.
It can be known to be wrong, however, because the LBL radiation models with their copious directly observable predictions, which are falsifiable but unfalsified, also make predictions about the value which is the sole prediction of Rudmop's model.
It is no wonder he wants to take his model before an uninformed public rather than to a group of experts in the field. It is hard to hoodwink those who know what they are talking about.
-
MA Rodger at 01:07 AM on 25 February 2017Increasing CO2 has little to no effect
Rudmop @238.
So what you are saying is that the amount of radiation absorbed by CO2 and transferred to the atmosphere immediately surrounding it (thus its GHG function) can be usefully compared with the amount absorbed by water vapour. This Ratio(CO2:H2O), you say is the product of three factors:-Ratio(CO2:H2O) = A x B x C
where A = the average volume ratio of the two gases in the atmosphere, B = the ratio of the blackbody radiation occuring at the wavelengths absorbed by the two gases, and C = the number of collisions made by a molecule of each two gases and the energy thus transferred. You calculate Ratio((CO2:H2O) = 0.0086.
From this you conclude that if the global surface temperature is 32.8ºC above the blackbody temperature, the warming contribution of CO2 in the atmosphere is 32.8 x 0.0086 = 0.28ºC.
To this finding you add the caviat that clouds add a complication to a simplistic use of this ratio. You also mention the altitude profile of CO2 not being a factor (although I was unaware of there being such a profile of any significance – eg see Foucher et al 2011). You do fail to mention a whole bunch of other stuff which will prevent the use of such a simplistic analysis, stuff which all others have considered which is why they don't attempt what you are doing here.
@239, your comment "When we double the CO2 values, the temperature will rise .57 deg. C." is presumably describing the total CO2 warming resulting from a CO2 concentration of 550ppm relative to 0ppm. (Note the accepted extra primary warming from a doubling of CO2 (eg 275ppm to 550ppm) is currently given as 1ºC which is greatly different from your 0.28ºC fixed for all 275ppm rises.)
@241 you present what I consider a misguided appreciation of science along with your credentials which are an irrelevance. You say that you “understand a bit about the world” but I do wonder if your understanding is of a bit that isn't useful to this analysis you perform here. -
Rudmop at 00:09 AM on 25 February 2017Increasing CO2 has little to no effect
michael sweet,
In science, there is no benefit to be had by forcing the validity of a clearly presented model down the throat of other scientists. Science does not work by one scientist or a group of scientists forcing people to accept a clearly thought out model. My model is steeped in thermodynamics and KMT, as well as quantum mechanics. My model does not violate any of the laws, and it serves as an alternative answer to a model that has failed on its predictions. What is unique about it, is that it considers the climate soup we wallow in on the surface. It considers the direct and frequent measurements we take globally and precisely on our weather stations. My model has no need to consider downwelling and upwelling IR photons, because it uses the results of their influence on the climate to calculate the effect of CO2 as a greenhouse gas. So there is no need for me to give you two reasons or a hundred reasons of why I need to convince you to accept anything. I trust that you are a scientifically literate person. I trust if you know and understand the laws of Thermodynamics and Quantum Mechanics. You will be able to convince yourself of the validity of any scientific model that any scientist presents. When the science illiterates try to force their beliefs and views to force others to adopt these views, then they will lose any credibility they had hoped of having. True scientists don’t have beliefs and don’t have to force others to believe. True scientists also understand the potential of presenting a false model and expecting other scientists to dignify their credibility. As a scientist, all I have is a successful patent on a cleaner that is unique like no other, a science degree in Biology with a chemistry minor and a Master of Arts in Secondary Education. I am credentialed in the Life Sciences, Chemistry, Physics, the Geosciences and I have taught school for 26 years in subjects ranging from 7th grade life science to High School Advanced Placement Chemistry and Physics; Currently I teach Aerospace Engineering, 8th grade Physical Science, Physics and Advanced Placement Physics. Besides researching and learning the Standard Model of Particle Physics, and the probable working of Quantum mechanics, I enjoy reading science Journals that arrive from AAPT and ACS, of which I am a member. As well, I like to turn nuts and bolts in my free time. I enjoy fixing stuff when it breaks, like the plumbing, air conditioner and the mechanical stuff on my hybrid car. I’m simply saying besides being a professional in my field, I understand a bit about the world. -
deivis_bluz at 00:08 AM on 25 February 2017As EPA head, Scott Pruitt must act on climate change
So scientists don't debate objective "reality". We put light first and then give it a name (sound). So we don't feel changing body and consider changing scenery as reality. We consider changing thoughts and senses as proof. Our lives are so imbalanced by impressions and so stressed that we want more objects i.e. measurements. And this want is the cause of disturbance that we call climate change. The cause and solution of disturbance is not CO2. I think doubts of Scott Pruit will improve our understanding of causes and solutions of climate change.
-
blatz at 23:39 PM on 24 February 2017As EPA head, Scott Pruitt must act on climate change
Everything you have said here is spot on. However I think Pruitt, and like minded people, sidestep the whole issue by attempting the argument that these things should be handled at the state level. I believe this is a new sort of denial tactic. Any attempt to convince Pruitt to change his ways must also include a solid argument on why climate change can't be affected at the state level. Seems obvious to us, but not to them. Just my opinion. Keep up the good work!
-
michael sweet at 20:39 PM on 24 February 2017Increasing CO2 has little to no effect
Rudmop,
Can you suggest to me two reasons why I should accept the conclusion of a random guy on the internet instead of the conclusions of scientists who have worked on this problem for over 100 years? Have you tried getting your model peer reviewed so that you can see what professionals think of your work? Have you compared your model to the professional models available on the internet that Tom Curtis linked for you? Professional scientists say that the upper atmosphere is the key location for the greenhouse effect but you claim that it is not important. Seems to me like one side has a gross error. Are you claiming all the scientists in the world are incorrect but you are correct?
-
Rudmop at 18:06 PM on 24 February 2017Increasing CO2 has little to no effect
From my model, the temperature rise is .0007 deg. C/ppmv CO2. When we double the CO2 values, the temperature will rise .57 deg. C.
-
Rudmop at 17:49 PM on 24 February 2017Increasing CO2 has little to no effect
The following is a brief presentation of my model for calculating the daily heating contribution of carbon dioxide. There are 3 features of the model:
1) Concentration Coefficient: (ppmv) of CO2 compared to (ppmv) water vapor. Using the Ideal Gas Law, the dry composition of N2, O2, Ar and CO2, the local temperature, pressure and absolute humidity values this ratio varies. On average it is 0.05
2) Heat Absorption Coefficient: the absorption spectrum of carbon dioxide compared to the absorption spectrum of water vapor. This includes all heat radiated from the surface of the earth and heat radiated during the exothermic phase changes of water, including solidification, condensation, and deposition. These wavelengths include 19.9, 2.9 and 2.6 micrometers respectively. Both carbon dioxide and water vapor have peak absorption wavelengths near these wavelengths, as well the blackbody radiation given off by the earth has a very minute amount of this of both the 2.9 and 2.6 micrometer wavelengths. Recalculating the total absorption spectrum peaks and the energy under the curve for these peaks, I arrived at a total absorption energy of 3.0 x 10^-19 J/molecule of carbon dioxide in an excited state and 1.1 x 10^-18 J/molecule of water in an excited state. The Heat Absorption Coefficient becomes 0.27 for carbon dioxide compared to water.
3) Diffusion of Heat Coefficient: the rate that carbon dioxide transfers its heat compare to the rate that water vapor transfers its heat. Using Graham’s Law of effusion and the molar masses of Carbon dioxide and water, this coefficient is 0.64. As the greenhouse gas molecules trap heat, they must be able to transfer their heat to other molecules by making random collisions with the other molecules. The speed and efficiency at which they can do this will determine their “strength” as a greenhouse gas. Water vapor is lighter and moves more quickly than Carbon dioxide, if both are at the same temperature.
4) The total coefficient for the capacity of carbon dioxide to absorb and transfer heat compared to water is then 0.05 x 0.27 x 0.64 = .0086
When we look at the difference between the global average temperature and the blackbody temperature we arrive at 32.8 degrees C. So on an average humidity day, between 50 N. Latitude and 50 S. Latitude, the difference between the blackbody high, low, and average and the daily high, low and average will be 32.8 degrees C. Carbon Dioxide will account for .0086 x 32.8 degrees or .28 deg. C. This experiment is occurring daily, and it is an alternative to calculating the differences in Top of Atmosphere (TOA) and surface IR radiance. The issue with calculating this difference is that water vapor is continually undergoing exothermic phase changes that give off near IR and mid IR in the absorption ranges for both water vapor and carbon dioxide. Near the surface, the water vapor and carbon dioxide molecules will absorb and re-emit these frequencies. The problem is that liquid water droplets in clouds can absorb the 15 micrometer waves and thus stop the wave from traveling from the surface to the TOA. It would be very difficult to measure the radiance of this and calculate how what CO2 absorbed and what water droplets in the clouds absorbed or surface water absorbed as down welling radiation is absorbed by the surface water.The argument that CO2 is more concentrated at higher altitudes cannot be used to support more heat being trapped here. There will be very upwelling in the little peak wavelengths that carbon dioxide absorbs, and almost no downwelling peak wavelengths. Carbon dioxide molecules at this altitude, provided the density separation does not result in a near extinction, will actually be radiators of heat. At this altitude, there are more possible vector directions that point to space, than point back to the surface. So as excited carbon dioxide molecules spontaneously radiate photons, there will be a more favorable amount of heat loss than heat gain by the climate. These higher altitude molecules cannot hold on to any trapped energy for an indefinite amount of time. Nothing can do that. Everything radiates its heat to the colder gradient as a necessity of the 2nd law of thermodynamics. CO2 at the TOA is not going to collect more heat than it radiates.
In summary, water is more efficient at trapping heat than carbon dioxide, by a factor of nearly 120 to one. The reason is that there are more molecules of water vapor to collide with the other 992,000 ppmv of non-greenhouse gases, and they can absorb more heat than CO2, and they can move faster than CO2 in order to transfer their heat to the other non-greenhouse molecules. It is painfully obvious that water vapor is most significant greenhouse molecule. Besides that, water must give off heat when it freezes, or condenses or undergoes deposition. When we get massive snowstorms, or rain storms or large areas of Arctic winter time freezing, then we must get rid of heat from the environment. If the rate of condensation in a cloud is equal to the rate of evaporation, then the droplets of water will never get large enough to fall from the sky; Hail stones would not fall from the sky in the summer if heat was not escaping the climate. Waves at the surface of the ocean break and create droplets of mist that come back down and rejoin with the ocean. It took energy to break the hydrogen bonds in order to create the mist. When the mist returns to the surface of the water, it reforms hydrogen bonds and photon of ER are given of in the 79 micrometer range. There is nothing to capture these photons and so the earth cools that way. Water is the great climate regulator and CO2 is responsible for a small fraction of the heating. Experiments measuring downwelling against upwelling of the peak wavelengths of carbon dioxide are not able to distinguish where the wavelengths were absorbed. Liquid water also absorbs these peak 15 micrometer waves that CO2 absorbs. Therefore we cannot attribute the absence of these 15 micrometer waves as a result of CO2 blocking the upwelling radiation totally out. Liquid water blocks some. A better way to measure the effects that CO2 has on trapping heat, is to measure use the final coefficient as described in my model. -
barry1487 at 16:55 PM on 24 February 2017It's cosmic rays
From the article you linked:
The CLOUD result adds another significant measurement in understanding the climate. But it does not rule out a role for cosmic radiation, not does it offer a quick fix for global warming.
-
barry1487 at 16:46 PM on 24 February 2017It's cosmic rays
Thanks for the reply PS.
If the quote is not at the source linked, then an additional link should be added to lead interested readers in the right direction.
I read the paper. It's discussing a sub-component of cloud formation. These remarks are in the concluding paragraphs:
The Intergovernmental Panel on Climate Change (IPCC) considers that the increased amount of aerosol in the atmosphere from human activities constitutes the largest present uncertainty in climate radiative forcing2 and projected climate change this century. The results reported here show that the uncertainty is even greater than previously thought, because extremely low amine emissions—which have substantial anthropogenic sources and have not hitherto been considered by the IPCC—have a large influence on the nucleation of sulphuric acid particles.
The study is focussed on amines in cloud nucleation. It does not quantify whether low concentrations are abundant or not, but it does point out significant uncertainty regarding their influence.
I'm not sure that this paper corroborates the general contentions made here about GCR/cloud formation after reading the whole paper for comprehension.
-
Rudmop at 15:12 PM on 24 February 2017Trump can save his presidency with a great deal to save the climate
I humbly submit that my post was not off topic, because if we are proposing legislation on regulating "pollution that causes global warming" then perhaps there should know the value for the daily heating that carbon dioxide contributes. When I cut and pasted my slides into the post, it was all reformatted. I should have taken a bit more care to correct that; however, they are just line breaks and so if that was confused with rambling, I am dumbfounded. But I have it figured out thanks to the humble response of Mr. Curtis and I thank him for enlightening me on the findings. I will respond to his comments/questions in a more appropriate post.
-
barry1487 at 13:30 PM on 24 February 2017It's cosmic rays
Reviewing some of the papers linked in the advanced version of this article, I could not find the quote attributed. Quoting the article:
In the CERN CLOUD experiments, Almeida et al. (2013) found
"ionising radiation such as the cosmic radiation that bombards the atmosphere from space has negligible influence on the formation rates of these particular aerosols [that form clouds]"
That quote appears nowhere in the paper at the link provided (which is the full version of the paper). Rather, the paper concludes that there are significant uncertainties regarding the matter assessed.
If I've read it right, it would be well to correct the OP.
Moderator Response:[PS] Looks to me like the quote came from the press release accompanying the paper. However the abstract "The ion-induced contribution is generally small, reflecting the high stability of sulphuric acid–dimethylamine clusters and indicating that galactic cosmic rays exert only a small influence on their formation, except at low overall formation rates." hardly contradicts that.
-
Ravenken at 11:35 AM on 24 February 2017Trump can save his presidency with a great deal to save the climate
I'm sorry but this is just wishful thinking... trump does not know how to care about other people and instead is relying on his 'advisors' for policy decisions which, and I am not saying this off-handedly, include Putin and his vast oil reserves... Putin needs demand as high as possible to drive up the price so I would be VERY surprised to see any real initiative that would make a dent in the market make it through to US law. Sure it's possible but doing so is a way of admiting to climate change and that's a big no-no.
-
Wol at 09:39 AM on 24 February 2017Trump can save his presidency with a great deal to save the climate
This article comes perilously close to offending the rules on political topics!
It will be interesting to see what the new administration's energy/climate policies are in practice, given the incoherent approach so far.
-
nigelj at 08:15 AM on 24 February 2017As EPA head, Scott Pruitt must act on climate change
Very well stated in all respects.
"IN May, Scott Pruitt wrote an article suggesting that protecting the environment and its people are examples of government overreach."
Scott's claims are purely his opinion that he has failed to substantiate. He is wrong anyway. Read a standard economics textbook, and economists have found that markets don't solve certain critical problems, especially long term problems and environmental problems, so only government can fill the gap with appropriate laws etc.
I think there's a time for debate, and a time to accept that certain things are well established on the basis of science and evidence. We debate things them move on. If we debated things forever, we would still be living in caves.
The climate denialists are stuck like a vinyl record in a groove, repeating the same old tired debunked nonsense over and over. Perhaps they all have OCD (obsessive compulsive disorder).
-
nigelj at 07:16 AM on 24 February 2017Climate Change – What We Knew and When We Knew It
There is another important issue. Assume we do nothing, or close to nothing about climate change, and it proves to be serious, possibly more rapid than expected etc, and this is entirely possible.
The blame game will start, and the division and hatred could be on a scale that humanity has never expereinced before. It will drive liberals and conservatives to war, and different generation to war, and I mean the real type of war, where people get killed.
All the more reason to solve the problem, before it escalates out of control.
-
nigelj at 07:00 AM on 24 February 2017Climate Change – What We Knew and When We Knew It
How to deal with climate change? In my opinion, it requires a range of things, with no one simple answer.
The best way of at least changing behaviour is arguably a carbon tax, as others above argue, for reasons that it solves several problems. It is a disincentive for using fossil fuels, the polluter pays, and the income stream can be used for renewables or subsidies.
Cap and Trade is just too susceptible to dubious practices, in my view. Forced regulatory controls on fossil fuel companies is technically ideal, but would be so divisive it probaly isn't going to happen.
Regarding the best renewable energy, I dont think you can rule anything out as it depends on individual countries. Some suit wind, some may have to resort to nuclear.
It's all expensive, but various authorities have suggested 1-2% of gdp per year, which is not impossible by any means.
Carbon sinks like soils could be very useful, but require considerable global changes in farming techniques and this would be unlikely to happen overnight, yet it would be absurd to dismiss something like this either. It just seems commonsense that you would combine renewable energy, with promoting various carbon sinks. However somebody has to decide what split you have between the two.
But will it all happen? Because of slow progress, a rapid transition to renewables is now needed, and electric cars etc. It's technically possible in my view, but is a massive undertaking, and difficult in slow moving democratic governments, and with people so uncertain about the whole thing and all the denialist propoganda. And it needs to happen across many countries.
You almost need a war time "command and control" economy, and that would be resisted for ideological reasons. So humanity has a big headache, because while an answer is theoretically plausible, it is complex to implement and the politics are daunting.
-
chriskoz at 06:53 AM on 24 February 2017Trump can save his presidency with a great deal to save the climate
Tom Curtis@3,
You know beter than me that Rudmop@2 post is 100% off topic here (in addition to its presentation being so incoherent that it's essentially gish-galloping rubish) - I'm surprised it wasn't deleted yet.
If you want to show us some substence of that incoherent nonsense and respond to it (thanks for your effort), I suggest you go straight into the appropriare threads (e.g. about climate models reliability) rather than dragging that off topic discussion here.
-
Rob Honeycutt at 06:52 AM on 24 February 2017Elevator Pitches - Chapter 01 - Ancient Sunlight
FWL... I did work with an editor. As for the Kindle version, I'm not sure what's going on there. I've seen that same complaint elsewhere. When I downloaded it, it looked perfectly fine. Amazon's customer service was decidedly unhelpful and unknowledgeable.
-
FWL at 06:21 AM on 24 February 2017Elevator Pitches - Chapter 01 - Ancient Sunlight
Good idea - in theory, this can be useful. But in practice, to drive the message home, form matters. I recommend that you team up with an editor. There are already numerous grammatical errors and typos in this one posted image alone. The Kindle version is rendered like it's 1985. Clarity in style, wording & presentation is key, especially if you label this as an 'elevator pitch'.
-
william5331 at 04:19 AM on 24 February 2017Trump can save his presidency with a great deal to save the climate
Give up on trying to convince Trump about climate change. Instead get the memes into his head about how much money America is wasting buying oil overseas and how that money comes back to buy up America and make Americans tenants in their own country and how some of it goes to support the terrs. Emphasize, how renewables can be used to charge electric cars from Tesla, an all American company and all the money saved can be used for the rebuild, getting Americans back to work and making Trump the Hero of the day. We need to put the EMphasis on the right syLAble.
-
MA Rodger at 01:06 AM on 24 February 2017CO2 lags temperature
Adri Norse Fire @558.
You will appreciate that I am only able to interpret your written words. @532 you appear quite definite saying “The question is whether we have the highest concentration of atmospheric CO2 in 800,000 years, without going further, why the current temperature is 1.5 ° lower than the medieval warm period?“ I did point out that the value “1.5 ° lower” was not properly defined as the units of degree were absent. But if you have modified your position to be now arguing that “500 to 1000 years ago, temperatures were warmer than today,” that is fine. However do note you are wrong to say that such a statement is “valid for (your) initial question.” It is not.
Also it is wrong to cite Broecker (2001) in the manner that you do. Broecker do reference Huang et al (1997) in the manner you quote and Huang et al do set out that data supporting their findings. Indeed, Huang et al do provide a significant portion of the evidence for a global MWP presented by Broecker. However Broecker (2001) concludes “The case for a global Medieval Warm Period admittedly remains inconclusive.” And the graphic you provided @532 which attempts to use Broecker (2001) to support itself is, as explained @543, utter garbage.
Your defence of the second graphic you presented @532 doesn't explain why the Dye 3 temperature profile developed by Dahl-Jensen et al (2009) is omitted. Nor does it explain the second trace on the graphic you presented. Nor does it provide any resolution to the case for a global MWP. As set out @543, that graphic is also utter garbage.
The data presented in the third graphic @532 ends at 1935. I thought mention of the global warming 1935-to-date establshed by the global thermometer record would prevent your use of the 1935 end-point of that graphic to support your unsupported assertions. I can but repeat that you are wrong to do so.
And the fourth you now agree is garbage.
Your final point in this particular list @558 seems to be saying that someone can misuse data if it comes from a legitimate source. That is very wrong. You do require to show use of legitimate data by “those who did it,” with “it” being the proper use of NASA data to predict "a new short cold period ... between 2030 and 2050." The best of luck with that fool's errand!!
But I should make plain that this discussion of individual data sets (and the garbage) is not the proper way to develop a case for asserting that “500 to 1000 years ago, temperatures were warmer than today.” Always the first step should be to assess the present state of the science on the subject. Although it is a few years old now IPCC AR5 is surely the place to start, particularly Chapter 5 - Section 5.3.5 or perhaps more helpfully the Technical Summary Section TS.2.2.1. You will quickly see that you will have quite a job on your hands asserting that “500 to 1000 years ago, temperatures were warmer than today.”
Your additional web-links @558 add nothing to this situation. They concern the future, not the past. And in this, Zharkova et al (2015) is solely talking about the sun not our climate. The garbage you link to in the English-speaking press is entirely wrong in suggesting there is a prediction of climate within this work. Indeed, does not your German link say “Kein Effekt auf globale Erwärmung “?
And if you think Abdussamatov (2013) is worth quoting (as your Forbes link does), do note the scientific response since publication – he has gained the attentions of nothing but a tiny pile of denialists. And that is because Abdussamatov (2013) spouts garbage. -
bvangerven at 23:59 PM on 23 February 2017Climate Change – What We Knew and When We Knew It
@11
Hi,
In some of your links the costs are discussed (f.i. How Nuclear Power Can Stop Global Warming) and it appears that the costs are substantial.
In some of your links (f.i. How to cut greenhouse gasses and minimize global warming) it is proposed to put a tax on carbon e.g. exactly what I propose: let the polluters pay.
For the projects that can fund themselves (e.g. that generate a higher profit than the cost, like FARMING A CLIMATE CHANGE SOLUTION) I doubt that they can be deployed on a large enough scale to lead to a substantial decrease in atmospheric CO2.
My statement is: the heart of the problem is financial, not that scientific/technical solutions are lacking. Any undertaking that wants to replace the entire energy infrastructure of the planet (largely based on fossil fuels) with a new one (based on renewables or nuclear power) is bound to cost enormous amounts of money.
You seem to believe that we can solve the problem without tackling the polluters. Even if this were possible this is a slippery slope. It is a power struggle. If we start from the viewpoint that the polluters don’t have to pay up for the damage they are causing, we will end up giving them extra subsidies to maintain the status quo.
Far-fetched ? It is what is happening in Europe at this very moment. CO2 emission rights are given to companies based on how high their estimated CO2 emissions were in the past. Instead of leveling the playing field – a sound principle of the free market – the opposite is happening. New companies that want to produce in a clean way are put at a disadvantage!
And of course: the political will to change is lacking – because the support of the population for action is lacking – and this is because fossil fuel companies keep on funding climate change denial – and that is because they still believe they will get away with it.
I believe we need to fight that fight. Only if fossil fuel companies get the message: “you will be held accountable, no matter what”, they will be inclined to change their course.
-
Tom Curtis at 19:07 PM on 23 February 2017Trump can save his presidency with a great deal to save the climate
Rudmop @2, in order of importance:
1) The strength of the greenhouse effect of a given gas is a direct function of the difference in power radiated to space by that gas and the power radiated by the surface, and intercepted from going to space by that gas. As the power radiated to space is an inverse function of the temperature of the gas at the mean altitude of radiation to space, the vertical distribution of the concentration of relevant gases is a fundamental property without which no valid determination of relative greenhouse effect of different gases can be made. This is particularly the case when comparing the effect of CO2 to H2O, because of their very different concentration profiles:

From an altitude of 10 Km, on average, CO2 has a higher concentration than water vapour. The closer you approach the poles, the lower the altitude at which this is the case. Unless your model introduces the vertical structure of the atmosphere, it will be GIGO for the stated purpose. In particular, your failure to take into account the vertical concentration structure and mean altitude of radiation to space means you "concentration coefficient" is completely incorrect as regards impact on the greenhouse effect.
2) The energy trapping capability of each molecule is not simply a function of the sum of the energies at the absorption peaks in the spectra. It is also a function of the relative energy radiated at those wavelengths from the surface:

As you can see above, there is virtually zero energy radiated at 1.3 μm, 1.8 μm and 2.6 μm, so those bands should be heavilly discounted for H2O. Likewise the 2.7 μm and 4.3 μm bands of CO2 are of minimal importance. In contrast, the 14.9 μm CO2 band and 20 μm H2O band are of fundamental importance as they occur near the peak of outgoing IR radiation from the surface.
The additional factor is the rate at which the energy is reradiated from those bands, which is a function of temperature, which in turn is a function of altitude. The energy "trapped" per second is the energy absorbed minus the energy reradiated. The colder the temperature of the gas, the lower is the energy reradiated and hence the greater the energy trapped. This, of course, just restates point (1).
Your failure to include a weighting for energy available to be absorbed at each wavelength, and energy released by each gas at each wavelength means your calculated ratio for the "heating coefficient" is wrong in methodology, and completely incorrect in result.
3) You have not explained, and nor can I see what relevance rates of diffusion have on the result. In particular, concentration levels of CO2 (in particular) and to a lesser extent H2O are fairly stable so that rates of change in the concentration in still air (diffusion) have no bearing on spatial patterns of concentration, which you do not allow for in your equation in any event.
In sum, you have either not justified, or are explicitly incorrect with regard to the major assumptions of your model. To be frank, you would be far better of using existing radiation models such as the Modtran model used by the University of Chigago to calculate the relative impact on Outgoing Longwave Radiation (ie, the power emitted at 70 km, looking down) of removing CO2, water or clouds.
Alternatively, you can simply look up the results of such determinations using a full Global Circulation Model, such as by Schmidt et al (2010). They have determined that CO2 is responsible for about 20% of the total greenhouse effect, with water vapour and clouds being responsible for 75% and the other 5% being the responsibility of minor greenhouse gases. That is a far cry from you determination that CO2 is responsible for just 1.15%.
Moderator Response:[PS] Can we please have further comments in an appropriate place.
-
Rudmop at 17:52 PM on 23 February 2017Trump can save his presidency with a great deal to save the climate
I have been working on a climate model that is able to determine carbon dioxide's contribution to the daily temperature that we achieve compared to the temperature that we would be as a black body. Here is a cut and paste of my slides that I will be presenting this weekend.
Heat Trapping Capability of Carbon Dioxide
Based upon an Ideal condition:
•The period of time between the daily high and daily low is tied with stable atmospheric
conditions where any volume of surface air is identical to an adjacent volume.
•The sunlight received at the surface provides enough energy on a sunny day for the surface to
convert an abundance of infra-red photons, which will be radiated from the surface of the
earth, and these photons will be equal to or greater than required to excite all the water vapor
and all the carbon dioxide molecules in a volume of atmospheric gases, from the surface to the
troposphere, resulting in the maximum daily temperature.
•As the molecules reach an average kinetic energy some will reach an excited state of superposition; they will randomly collide with other molecules in the atmosphere and transfer their absorbed energy to these molecules.
•The amount of heat held in by the greenhouse gases can be determined by the minimum temperature achieved before dawn, if the local weather is stable, and not influenced by incoming or outgoing fronts.
•current climate model to predict the heating caused by carbon dioxide necessarily relies on a doubling of carbon dioxide. This method seems arbitrary and it does not allow for accurate predictions of future temperature rise as a function of carbon dioxide concentration.
Basis for the Model
•This model has been developed by determining the ratios of three physical heat trapping properties between water vapor molecules and carbon dioxide molecules.
•the Infra-red absorption spectrum of water vapor and carbon dioxide
•the ratio of effusion rates between water vapor molecules and carbon dioxide molecules
•the molar concentration ratio of water vapor and carbon dioxide (variable and dependent of absolute humidity)
•The model also uses the difference between the average blackbody
temperature of the earth and the global average temperature of the earth.
•Calculated using Wein’s Displacement Law
•Average blackbody temperature is -180 C and this would happen if there were
no greenhouse gases. Global average is 14.8 0 C.
•This difference is always 32.8 0 C.
Heating Coefficient between Water vapor and CO2
•Adding up the peak absorption energies of water vapor shows that a water molecule can absorb 3.72 x 10⁻³³J. The energies are calculated from the peak absorption wavelengths: (1.3 μm, 1.8 μm, 2.6 μm, 6.0 μmand 20 μm)
•Adding up the peak absorption energies of carbon dioxide shows that a molecule of CO2can absorb 1.33 x 10⁻³³J . The energies are calculated from the peak absorption wavelengths:(2.7 μm, 4.3 μmand 14.9 μm)
•The heating coefficient between water vapor and CO2is 2.8
DETERMINATION OF DIFFUSION RATES BETWEEN WATER AND CARBON DIOXIDE
•Molar mass of water and CO2is 18g/moland 44 g/molrespectively
•Use Graham’s Law of Effusion to find the diffusion rate
•Water diffuses 1.56 times faster than CO2.
CONCENTRATION COEFFICIENT FOR WATER VAPOR AND CARBON DIOXIDE
•Water vapor can range from 4000 parts per million by volume to 12,000 parts per million by volume.
•Carbon dioxide stay steady throughout the year at 404 ppmv
•This coefficient can vary from a value of 9.9 to 30.
Total Coefficient for heat capturing ability of water compared to carbon dioxide.
•1.56 x 2.8 x 19.95 = 87
Average Value that Carbon dioxide contributes to daily
heating above blackbody temperature is:
32.8/87 = 0.38degrees Celsius.
That is .00093 0C/ppmv
Moderator Response:[PS] This is totally offtopic. PLease use the search function to find an appropriate place to comment (and pay attention to the comments policy). Perhaps the "Increasing CO2 has little effect myth"
-
RedBaron at 13:25 PM on 23 February 2017Climate Change – What We Knew and When We Knew It
@7 bvangerven,
You asked, "What needs to be done to bring the climate crisis under control ?"
There are at least 6 published ways:
Another:
Restoring The Climate White Paper
Another, this one from the IPCC, 9 years old and still not acted on:
How to cut greenhouse gasses and minimize global warming
Another one:
FARMING A CLIMATE CHANGE SOLUTION
Another one:
How Nuclear Power Can Stop Global Warming
Another:
Commonland - 4 returns from landscape restoration
I even did one myself which draws a little from all of the above.
Can we reverse global warming?
Believe me I am nowhere near a “best climate scientist”. But I can read what the best scientists and engineers out there are publishing. We can do this and at a profit. Not the scientists fault. Many scientists have proposed plans from all sorts of fields with workable ways to solve AGW. It’s almost ridiculous how many great economically sound ways there are to solve this. What lacks is the will, not the means.
You then asked, "For me, the most essential question in the climate debate is: who is going to pay for this ?"
Which is a fair question, if it would be prohibitively expensive. Doesn't need to be though. Most those above plans yield net increases in profits rather than costs. You should be asking why won't the powers that be allow me to earn a profit while fixing the climate. That's a far more rational question. A question I really can't answer. I have a few educated guesses, but this website is not the place for speculation.
-
nigelj at 07:29 AM on 23 February 2017Climate Change – What We Knew and When We Knew It
Great little video. Should be required viewing in school science classes.
-
nigelj at 07:08 AM on 23 February 2017Trump can save his presidency with a great deal to save the climate
A revenue neutral carbon tax could indeed appeal to a people with divergent world views, at least in theory. It could indeed form a good deal between democrats and republicans, and lift Trumps ratings, in theory. The trouble is climate denial is virtually a prerequisite for Republican Party politicians, and this is very embedded now. That's a big thing that would have to change.Trump needs their support to pass various bills related to the economy, so can't afford to alienate them too much.
A revenue neutral carbon tax seems like a very desirable, rational approach, in that it drives behaviour, and also provides a revenue stream and one that can be very targeted. The trouble is the Trump Administration is driven more by convictions, than rationality or evidence, by my observation. Again how likely is that to change? They seem more focused on imagined short term problems, (heavy emphasis on the word imagined), and conspiracy theories. It's in their DNA.
-
Rob Honeycutt at 07:05 AM on 23 February 2017CO2 lags temperature
Adri... Let's look at that logic from another angle. Okay?
You go to a doctor because you have some condition that you'd like to have examined by an expert. You go to that person because you know they have years of training in their field. They are the expert and you are not. Right?
The same applies to climate science. The people who do the research are experts in their fields. They are people who've spent their entire professional career studying the subject matter. They have a very deep understanding of the subject matter which other people don't have.
When you go to the doctor, and that doctor gives you their professional opinion, do you say, "Well, you need me here to challenge your expertise. I can find many things on the internet that disagree with your diagnosis! How can I trust that your diagnosis is correct?"
No. You don't. If the diagnosis bothers you for some reason, you might go ask a second professional for their opinion. But that's about it.
But you are here suggesting that you have the capacity to actually challenge the overwhelmingly agreed consensus of professionals related to man-made climate change.
Most scientists in other fields would say they don't have the expertise in climate science to challenge the consensus position. They don't just blindly accept the science. If they're curious they will spend time trying to learn why there is such a broad and overwhelming consensus. But they certainly don't try to blindly challenge the science without first fully informing themselves on the topic by reading the relevant scientific research. And they certainly aren't going to trust blogs to inform them.
-
scaddenp at 06:57 AM on 23 February 2017CO2 lags temperature
>So no statement of any documentary on science is true?
Of course not, but it cannot be assumed that this is what the science actually does say especially if the documentary has a point to make other than informing about science in a disinterested way. They are not a source on which to found an opinion without checking actual science first.>I have no reason to distrust more of one man whose base is in Antarctica, than what you tell me.
Since I dont know documentary you refer to, nor the wording or context of the statement, so it is hard to comment, but someone stating opinions at variance to rest of the scientific community should be fact checked. What was the documentary so we can evaluate your source perhaps? You still havent explained your process for evaluating one source of information (eg something you heard on a documentary) versus another (say the IPCC reports)."You can see that Tom Curtis himself confirms it (That there are a lot of non-scientific staff)."
Seriously?? You can distrust the IPCC because their administrators arent scientists? That is what you are trying to imply? All the actual writers and reviewers of the science of climate change are scientists as Tom said or did your brain just censor that information because it would destroy your case?But I have seen that in the scientific community the subject is far from being consensual,
Your evidence for this please?That the share of CO2 produced by human emissions causes current global warming,
That is NOT an assumption! That is conclusion of the studies. Predicted by science long before global warming even noticiable. Just in case we have problem with assumption in google translate, an assumption is that which is deemed to be true at commencement of a study. For climate science, that would be laws of physics and chemistry. You would us and yourself a favour if you actually read the IPCC chapter of attribution instead of you making assumptions about how the science was actually done.
-
Adri Norse Fire at 04:20 AM on 23 February 2017CO2 lags temperature
Why do we have to converse in English? I'm tired of cutting and pasting into the google translator and then I have to interpret what you mean. I guess it's my fault because this is a web in English.
Tom Curtis
You have described very well the improved method that used PAGES 2000, but that does not imply that it is a truly impartial reconstruction because as I said to have more markers in some continents than in others, in doing the average the global reconstruction has a better representation of certain parts of the world than others and the final reconstruction is biased. When you have many more proxies in some areas than in others, the average of the continents is partial in not having a similar number of proxies in the different areas. In other words the final result will approximate more faithfully to some means than others and therefore will condition the global average. To have a really faithful chart, they should have many more proxies in Africa, for example. But as you say, the PAGES 2000 chart is more reliable than that of Loehle and McCulloch. But back to the beginning, what about my appreciation on the PAGES 2000 chart?
MA Rodger
It is true what you say about the first chart, but the paper it refers to also says: ''From an analysis of 6000 continental borehole thermal records to ammonia the world (14), Huang et al. Conclude that 500 to 1000 years ago, temperatures were warmer than today, '' Which is valid for my initial question.
The second chart has probably been made by the man shown below, '' Nasif Nahle '' from the three sources he quotes. But the temperature of the chart is at least exactly the same as that of Dahl-Jensen's study and in that study it also says: '' The last 10 ky BP. The CO is 2.5 K warmer than the present temperature, and at 5 ka the temperature slowly cools toward the cold temperatures found around 2 ka. (C) The last 2000 years. The medieval warming (1000 A.D.) is 1 K warmer than the present temperature, and the LIA is seen to have two minimums at 1500 and 1850 A.D. The LIA is followed by a temperature rise culminating around 1930 A.D. Temperature cools between 1940 and 1995. ''
If you have a good eye you will see that the third graph shows that the peak temperature is 0.7 no to 0.5 therefore there does not seem to be much difference between today and the Medieval Warm Period according to that chart.
And as for the last chart, I agree with you that it is a slop. But it seems that you have missed one of the first graphics I put. The CO2 graph for 800,000 years. Maybe you should dissect it too, do not misunderstand me, I still like the dissections you do.
It is true as you say that NASA has not made these findings public, but those who did it, have been using the data provided by NASA, as you can see here: https://solarscience.msfc.nasa.gov/SunspotCycle.shtml
Rob Honeycutt
Very good. You really are right, but I'm not starting from scratch. Obviously I am not an expert and I recognize that I do not defend very well in the details, but I think I know something more than the average about science.
You already have your answer, but you must admit that it is good for you as a scientist (if you are) to have someone come forward to rebut your arguments. If something is really scientific it must be susceptible of being falsified or refuted, right? Science advances through essay and error. I'm doing you a favor, then.
scaddenp
So no statement of any documentary on science is true? First of all, I did not say that this is how "science works", of course not, I mean that is how science is taught to the public. And Jane Goddall teaches science through the media, as much as David Attenborough. I have no reason to distrust more of one man whose base is in Antarctica, than what you tell me.
<Hmm, so it would appear you have again unskeptically accepted a comment from what source ??> You can see that Tom Curtis himself confirms it (That there are a lot of non-scientific staff).
You build on this subject in a supposed consensus that does not exist, perhaps in public and political opinion itself. But I have seen that in the scientific community the subject is far from being consensual, although the majority supports the anthropogenic global warming. It's not like I said before, like the law of gravity.
<You claim climate science is based on untested assumptions. Which would these be?> That the share of CO2 produced by human emissions causes current global warming, for example.
<You? Or are your biases too powerful?> Haha, well I am not angry and as you have been able to check now, the graphics I put are not very good, but neither are the rubbish to which Mr. MA Rodgers alluded.
Tom Curtis
Again, thank you for the information. And yes, I immediately noticed that appreciation.
-------------------------------------------
And I want to add something, you do not seem very convinced about the solar theory to which I alluded and is normal if you are not familiar with it. I just want to say that I do not know your age, I will be alive between 2030 and 2050 but I guess those who live with me will be able to see it firsthand.
And for MA Rodgers, I have just remembered the names of leading Russian scientists who have come to similar conclusions on this subject, Mr. Abdusamatov and Mrs. Zharkova.
http://www.wetter.at/wetter/welt-wetter/Sonne-extrem-ruhig-Kommt-Mini-Eiszeit/241375001
http://www.express.co.uk/news/science/723481/Earth-ICE-AGE-big-freeze-solar-activity
http://www.dailymail.co.uk/sciencetech/article-3156594/Is-mini-ICE-AGE-way-Scientists-warn-sun-sleep-2020-cause-temperatures-plummet.html
http://www.forbes.com/sites/larrybell/2014/01/21/miss-global-warming-yet-if-not-just-wait-and-you-might/#c2e266161996
https://www.omicsgroup.org/journals/grand-minimum-of-the-total-solar-irradiance-leads-to-the-little-ice-age-2329-6755.1000113.pdf
https://www.youtube.com/watch?v=7sh_nlz43Pc
I do not know why but it seems that there is an error in the server of Nature about the article of the Mrs. Zharkova, perhaps a ray? Just write it on google and try to have it if you can. Best regards.
-
poorrichard at 03:49 AM on 23 February 2017CO2 lags temperature
The argument against CO2 caused global warming is flawed. It is "apples and oranges" The time period cited is thousands of years ago. We were not relavent then as agents of climate change then. In the past 200 years, We have become exponentialy more effective in causing climate change up to the present. These changes are linked to CO2 changes.
Before this period, CO2 was not much effective as a cause of climate change.
Thank You - Poor rochard
-
Rob Honeycutt at 03:00 AM on 23 February 2017CO2 lags temperature
Being that the previous commenter is using a name that doesn't appear before this, I have no clue who it is. But it does seem that whatever I've said struck a nerve, even if the commenter doesn't refer specifically to anything I've said.
-
Raenrfm at 01:52 AM on 23 February 2017CO2 lags temperature
@Rob Honeycutt - I find it quite arrogant that you assume that every tidbit of information on this website is accurate while others only produce incorrect data. This for me is the crux of the whole issue, the "us" vs. "them" mentality. The very fact that legitimate scientists are labeled as "deniers" (substitute heretic if you like) if they do not tow the company line, offends me, as it should any true person of science. When you enter into a scientific discovery with a bias, that should set off alarm bells.
When postulating a theory, it is the primary goal of the scientist postulating that theory that they make all attempts to disprove it, and allow others to make the same attempts and to not "fall in love" with it (please search for Dr. Richard Feynman and his lectures on the evolution of the oil drop experiment in calculating the charge of an electron and how credential bias delayed the calculation of it's true value). It's called transparency. The validity of an argument does not depend on whether it is peer reviewed or not either, we throw that idea around like it is the true litmus test of an idea. If it is the truth, it will survive all efforts to destroy it. In fact Einstein was offended that his papers needed to be peer reviewed. Peer review to me is censorship. If the goal is the truth, peer review is unecessary because it's quite possible that those peer gatekeepers are inadequite to fully understand new or "radical" concepts, like when Einstien and Rosen postulated that gravity was a wave. I feel it hobbles us as a species. True science is also not gouverned by concensus either (that single flawed paper that everyone clings to). We used to all agree that the world was flat remember?
I have a degree in physics, I understand how to read papers and understand how data is represented and mis-represented. Graphs are never or rarely presented with error bars which in itself smacks as unscientific. I will patently ignore any data set that does not have a full disclosure on the error analysis and indicate it clearly, yet the general public is led to believe that what they are seeing is gospel and not open to debate.
I do not know you Rob, as you do not know me, and I have no issue with your point of view, other than it should be stated that it is a point of view and not a definitive statement of the truth, because neither of us has earned the right to say what the truth is, and a great many people with greater qualifications than ours haven't earned that right either. The truth is or it isn't, it does not require concensus or cheerleaders.
Moderator Response:[JH] Sloganeering snipped.
-
Factualies at 01:24 AM on 23 February 2017Climate Change – What We Knew and When We Knew It
It was easy to see Hitler and the Nazis as evil people, go to war, and justify killing them to save millions from their ovens. So why don't we look at the people in power, both corporate and governmental, who are knowingly setting policies and making decisions that are turning the planet into a giant oven that will kill billions (of our species and others) and do the same? This is life and death and happening faster that we want to accept. For all it's intelligence, our species is incredibly stupid. We study the laws of nature, then knowingly defy them; we study history, then knowingly deny it. Perhaps in the long run, this may be bad for us, but good for the Earth.
-
shoyemore at 01:04 AM on 23 February 2017Climate Change – What We Knew and When We Knew It
Richard Muller has a record of conflict with climate scientists and for many, many years he was a soulmate of deniers like Anthony Watts. In the end, he stood up to be counted when he was confronted with the evidence.
Whatever about the past, he is very, very good in this video, quite the star in fact.
-
bvangerven at 00:47 AM on 23 February 2017Climate Change – What We Knew and When We Knew It
What needs to be done to bring the climate crisis under control ? Those who are responsible must be forced to pay the bill. It is a simple as that. For me, the most essential question in the climate debate is: who is going to pay for this ? Fossil fuel companies keep on funding climate change denial for this reason: they think they will get away with it in the end. They will cash the profits and the population will be presented the bill: climate adaptation, mitigation, geo-engineering. Or even worse: we will all pay in the shape of an unprecedented disaster, we will all participate in a gigantic lottery with only losers.
If only …
If only it is possible to make a damage claim against the fossil fuel industry, backed up by the scientific evidence that has been around for about 30 years. If only fossil fuel companies could be made to understand: you, the polluters are going to pay no matter what. And the longer you delay climate actions, the higher the bill will be. The alternative: to start collaborating NOW in a plan to evolve towards a carbon neutral society as soon as possible.
-
deivis_bluz at 00:35 AM on 23 February 2017Climate Change – What We Knew and When We Knew It
But scientists do one major mistake. They consider objects (measurements) as separate from each other. Scientists create an independent observer with thoughts and assume there is common view. In fact this world is just measurements or sounds. Everything in this world is just thoughts (measurements). The number of measurements in the substance increase so the substance starts heating up. All our measurements are based on this planet (meter, kilogram, second) and not related with our senses (periodic table of elements). We don't align our activities (waves) with the sun and moon so our minds get disturbed and disturb environment. Without aligning our clock and calendar with sun and moon and our activities with the cardinal directions i.e. movement of our planet we can not solve climate and extreme weather.
Prev 441 442 443 444 445 446 447 448 449 450 451 452 453 454 455 456 Next


