


 Arguments


Recent Comments
Prev 444 445 446 447 448 449 450 451 452 453 454 455 456 457 458 459 Next
Comments 22551 to 22600:
-
ergodicity at 09:48 AM on 14 February 2017Climate's changed before
Thanks all for the replies!
Tom Curtis Where does your statistics of "the direct contribution to the Earth's energy balance from cosmic rays is 0.0000032 W/m^2." come from? Is that stat during a weakened magnetic field or at full strength.
Rob: Thanks for mentioning the LaChamp anomaly: I have never heard of this and am excited to read about it more. But your statement "there was zero response in the climate system." is false.
https://phys.org/news/2012-10-extremely-reversal-geomagnetic-field-climate.html Clearly states, The reversed field was 75% weaker whereas the strength dropped to only 5% of the current strength during the transition. This resulted in greater radiation reaching the Earth, causing greater production of beryllium 10 and higher levels of carbon 14.[2 Detectable higher levels of carbon, even if negligible as to global warming, is not zero response.
Scaddenp: Knudsen et al 2009 is interesting. That also seems to indicate that the weakening magnetic field has some effect on climate: " In addition to supporting the notion that variations in the geomagnetic field may have influenced Earth's climate in the past, our study also provides some degree of support for the controversial link between GCR particles, cloud formation, and climate."
Again, I am not at all trying to refute the man made global warming effect. I am only trying to determine what effect the weakening magnetic field has on global warming. All links to any studies/articles/information on this subjuct would be greatly appreciated!
Thanks all for comments!
-
Tom Curtis at 09:18 AM on 14 February 2017Volcanoes emit more CO2 than humans
RedBaron @281, if the primary regulator of atmospheric CO2 is the biosphere, as you claim, covering vast swathes of that biosphere with land ice would reduce the fixing of CO2 into soil, and hence result in an increase in atmospheric CO2 durring glacials. Instead we see the reverse.
Although it is not yet entirely clear what drives the synchronous changes of pCO2 and GMST, the evidence strongly suggests the deep ocean has a major role. That role must be at least modulated by change in surface vegetation, which were extensive, even in the tropics. Specifically, the Sahara was not a desert (and much of the Australian outback was greened as well); but much land now covered with tropical rainforest was covered with grassland. The greening of the Sahara, however, survived several millenia past the start of the Holocene - so its contribution to pCO2 was minimal relative to the glacial/interglacial cycle. And total carbon sequestration in rain forest, per meter squared, exceeds that on grassland in every review I have seen, which would make that change, again, counter cyclical.
-
Tom Curtis at 08:59 AM on 14 February 2017Climate's changed before
ergodicity @539, the direct contribution to the Earth's energy balance from cosmic rays is 0.0000032 W/m^2. The direct contribution from the solar wind, in the absence of Van Allen belts would be 0.00035 W/m^2. Both are so negligible that their presence or absence would make no discirnible difference to the Global Mean Surface Temperature in the event of a collapse of the Earth's magnetic field.
The only way they could be significant would be through secondary effects, as proposed by Svensmark in "The Chilling Stars", but that hypothesis was always overblown given that it ignored the abundance of Cloud Condensation Nuclei generated by natural, earth bound events. Worse for that hypothesis, the LaChamp anomaly all but kills the hypothesis, as noted by Rob Honeycutt above.
(Data and sources here. I apologize for the formating. Blogger has decided to mess with the column widths on the table, but it appears with proper formating in the editing window, so I do not know how to fix it.)
Moderator Response:[PS] For context, doubling CO2 would add an extra 3.7W/m^2. Further discussions about GCR should take place on this article.
-
nigelj at 08:30 AM on 14 February 2017This is why conservative media outlets like the Daily Mail are 'unreliable'
The Daily Mail is clearly unreliable. They published inaccurate nonsense, and only half the relevent information about the issue. Conservative media too often seem comfortable with "lies by omission".
Plenty of conservative media also seem to see theories like free trade, or multiculturalism, or climate science as "Big Lies" but they are never able to show who is lying, or what the lies specifically are.
-
scaddenp at 08:12 AM on 14 February 2017Climate's changed before
The Viewzone article is a rather breathless take on Knudsen et al 2009 but the it is correct in that the supposed effect is from effects of GCR on cloud formation (which still lacks supporting evidence - see IPCC AR4 for papers that have examined this in detail). The amount of extra radiation (GCR) reaching the surface could not directly cause any measurable temperature change.
-
Rob Honeycutt at 07:39 AM on 14 February 2017Climate's changed before
ergodicity... Again, the earth's poles have flipped in the past, like during what's called the LaChamp anomaly, and there was zero response in the climate system.
-
ergodicity at 06:41 AM on 14 February 2017Climate's changed before
scaddenp Thanks for replying. I believe you misunderstood me. The theory I spoke of was of a polar shift: https://www.scientificamerican.com/article/earth-s-impending-magnetic-flip/
My question, not theory, not challenge to man made global warming, was, what is the effect of the magnetic field weakening http://www.livescience.com/46694-magnetic-field-weakens.html
on global warming. Are there any studies coorelating the polar flip, weakening magnetic field and global warming. http://viewzone.com/magnetic.weather.html
It seems logical that as the field weakens, more radiation get in and an increase in the surface temperature occurs. I am a firm believer that man made global warming exists, but so does natural global warming (there was a glacier here in Kentucky 20k years age), and I believe the magnetic field weakening is the trifecta that we are experiancing.
Thanks for reading!
-
nigelj at 05:52 AM on 14 February 2017Whistleblower: ‘I knew people would misuse this.’ They did - to attack climate science
Red Baron @7, I read the same thing somewhere that the data is actually machine readable. My initial reaction to this whole issue was that perhaps some minor procedural mistakes were made, but it appears even that may not be the case.
I think Bates is an angry, disgrunted former employee looking to score points. There's plenty of evidence he had conflcits with his employer. His emotional involvement could mean he has jumped to conclusions. Like with so many similar scandals, we will probably never really get to the bottom of it as he will become totally defensive, and will close up.
-
nigelj at 05:38 AM on 14 February 20172017 SkS Weekly Climate Change & Global Warming Digest #6
Tom Curtis, my understanding is the arctic is warming quite rapidly from the feedback of less ice cover etc. Could this partly explain why the global surface temperatures are warming slightly more rapidly, than higher up in the atmosphere (UAH)?
-
RedBaron at 04:23 AM on 14 February 2017Whistleblower: ‘I knew people would misuse this.’ They did - to attack climate science
I have been struggling to understand the real controversy John Bates brings to the table, rather than the hoax reported in the media. John claims he knew it would be misused. OK. So the proper use? The best I have been able to ascertain is this:
John Bates claim was that the archiving of the data wasn’t complete until six months after the paper appeared, and there was no format statement for the DATA, making it not in machine readable form, and it used a 90% rather than 95% confidence standard.
That is completely different than “all DATA from NOAA is worthless or tampered”.
In fact even the data in that controversial paper would have value, because although late to archive, it is there now. And although a format statement wasn’t made, The Data is in ascii format, which actually is machine readable, it simply lacked a format statement to that effect. And a 90% vs a 95% standard is simply a matter of recalculating the conclusions made from the data to the new higher standard. The actual measurements were not tampered with at all. So it is timing and format rather than fudged data.
How close am I? Did I understand the real issue brought up by Dr Bates? Or is there more? Thanks for your help.
-
RedBaron at 04:02 AM on 14 February 2017Volcanoes emit more CO2 than humans
@Tom 280,
That would make sense Tom, simply because the primary regulator of atmospheric gasses is the biosphere. When glaciation events were the main way the biological function was reduced by covering a significantly large area of land with ice, then the geological emissions would exceed natural uptake. The trend reverses till enough ice melts to allow the natural uptake to reign supreme again. So one would expect this. It would bracket the atmospheric CO2 in a range. This is what we see for the last 800k years.
This would support the idea that the degrading biosphere and ecological systems caused by mankind are what has allowed fossil fuel emissions to force the atmosphere to exceed that bracketed range. (very roughly ~170 - 320 ppm +/-) The biological stabilizing feedback function has been degraded simulataneously with increased emissions. Either alone is probably not enough to upset the balance. But both together obvious is since we are watching it happen.
-
John Hartz at 02:36 AM on 14 February 20172017 SkS Weekly Climate Change & Global Warming Digest #6
knox kp & Tom Curtis: More about what's happening in the Arctic this winter season...
Records are shattering left and right across the Arctic, much like the ever-dwindling sea ice that once covered the entire Arctic Ocean.
First, the facts. January sea ice area has never been so small. In November, the coverage fell short of average by an area the size of the eastern half of the United States. Northeast Greenland had its warmest February day ever (by almost four degrees). The current heat wave brought Friday’s temperatures near the North Pole to 50 degrees above average, which is like New York City having a January day in the mid-80s.
This kind of unprecedented weather leaves even seasoned researchers scratching their heads.
“We’re still trying to figure out what is happening here,” Mark Serreze, a senior research scientist with the Colorado-based Snow and Ice Data Center, told KUAC. “The sea ice is so low there in part because it’s just been so darn warm in the Arctic this winter.”
Once-in-a-decade heatwave melting the Arctic ... for the third time this year. Why? by Charlie Wood, Christian Science Monitor, Feb 11, 2017
-
chriskoz at 21:37 PM on 13 February 20172017 SkS Weekly Climate Change & Global Warming Digest #6
Poorly written poster. In:
...administration must accept this fact and work to fight against it.
"it" refers to "this fact". That's the only resonable meaning here, as is. Which is what current administration is doing: fighting against the fact of climate change, i.e. inventing an alternative reality where inconvenient facts are altered, then silencing the media who are trying to remind us of real facts.
Of course the author meant "fight against the threat of climate change" but failed to express it adequately.
-
knox kp at 15:29 PM on 13 February 20172017 SkS Weekly Climate Change & Global Warming Digest #6
Thanks so much!
-
Tom Curtis at 13:02 PM on 13 February 2017Volcanoes emit more CO2 than humans
Tony Spencer @278, the estimates of geological CO2 emissions are certainly in ferment at the moment. One factor is that we know that over the long term, CO2 concentrations are essentially stable. Specifically, the CO2 concentration either at glacial maximums, or interglacial peaks have not varied by more than a few ppmv relative to other glacial maximums or interglacials respectively, for 800,000 years. It follows that natural emissions are essentially in balance with natural uptake of CO2. As it stands, however, where estimates of CO2 uptake used to exceed estimates of emissions by about 50%, they are not dwarfed by them. That means there is a problem with one set of figures, or the other, or both. My suspicion is that currently the vulcanoligists are over counting, but assume the estimate of natural uptake is too low. It would remain the case that total geological contribution to atmospheric CO2 increase is essentially zero.
-
Tony Spencer at 12:22 PM on 13 February 2017Volcanoes emit more CO2 than humans
No relation to Roy btw!
-
Tony Spencer at 12:22 PM on 13 February 2017Volcanoes emit more CO2 than humans
i came across Wylie's article the other day. Interesting. The other point he covered was diffuse CO2, that is invisible, i.e. not associated with steam plumes, part of the reason for upping the estimates, but more importantly that some we thought extinct are invisibly emitting CO2 adding perhaps another 50%, which would take CO2 to ~1 billion tons a year, 10 times what we thought 20 years ago, and therefore now around 3%, three times what was said at the beginning of the thread.
it occurred to me that as this gas was bubbling through the magma, the diffusion would seperate the C12 from C13 and that, depending on time, variation etc, could distort the ratio that we use for measuring anthropogenic emissions from fossil fuels, in the same direction, meaning we would overestimate anthropogenic by up to that amount.
Still small in the scheme of things but not insignificant, with obvious effects in rare of AGW and 2100 levels.
just a thought.
-
Tom Curtis at 11:33 AM on 13 February 2017CO2 limits will make little difference
bnielsen @8, in the past, when I have seen claims that "x is a net carbon sink", they have almost always been based on counting natural sinks, but not natural emissions. Indeed, the CSIRO shows Australian net biosphere fluxes to represent just 62% of Australia's fossil fuel emissions (not counting those from exported coal and oil).
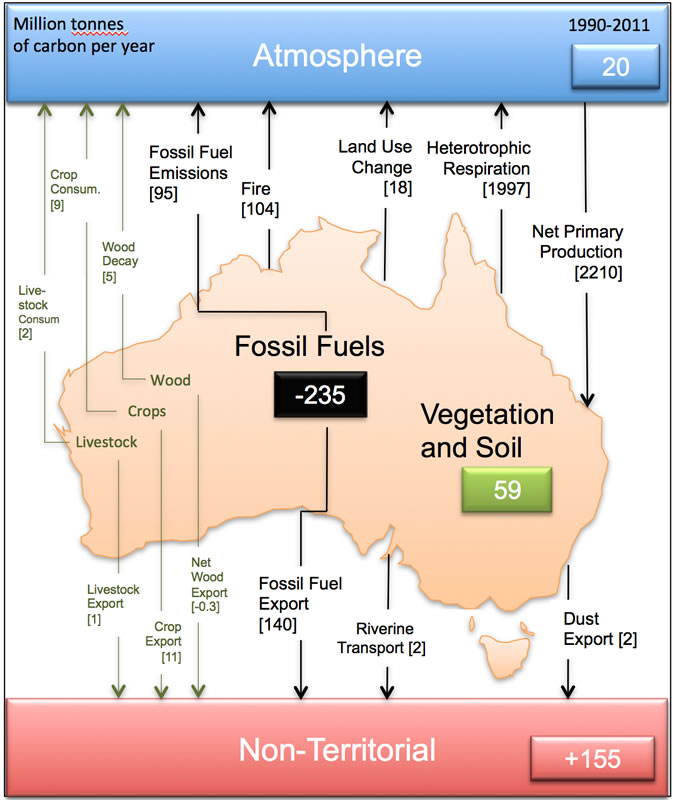
I am disinclined, therefore, to accept your assertion without a reliable reference to back it up.
-
scaddenp at 11:25 AM on 13 February 2017Climate's changed before
ergodicity - this is a pretty weird idea since past magetic pole reversals arent associated with any climate change. Can you give us a link to where this theory myth is being expounded least the Sks team need to add it to the list of skeptic myths. It is strange how people might expect some unknown mechanism to be causing warming while ignoring that the amout of radiation at the earth surface is measurably increasing, and in the spectrum and intensity of that predicted by the GHE.
-
bnielsen at 11:21 AM on 13 February 2017CO2 limits will make little difference
I have no issue with the physics, but having worked in government projects related to projects around CO2 reduction, I have a few problems with the "skewed" messages. First and foremost is - where are the NET emissions figures? Australia is often a net carbon SINK, yet the emisisons figures given are all related to production! Surely a scientific basis for effective carbon reduction should focus efforts on countries with a net carbon production? This leads to the issue of focus - almost entirely on energy production, when food production is far more damaging to both air, land and water. Worse, in the latter case, often the product is exported, so the producer country keeps the pollution while another country gets the benefit! So New Zealand has massive methane production from agriculture, but 92% of the product is exported! So why is not the consumption country being the one with the carbon tally, since they enjoy the benefit?
-
Tom Curtis at 10:34 AM on 13 February 20172017 SkS Weekly Climate Change & Global Warming Digest #6
knox kp @1, I am not well read in this area, but climate models appear to indicate that there is no tipping point associated with the Arctic becoming sea ice free in summer. Certainly that is the conclusion of Winton (2006), Eisenman and Wetlaufer (2008), and Teitsche et al (2011). In Winton (2006), however, one of two models showed a tipping point when the Arctic was sea ice free earlier in the season, which was also shown by Eisenman and Wetlaufer (2008). Eisenman and Wetlaufer indicate that this is because, in September, the time of the summer sea ice minimum, solar radiation is already very low, and indeed, of similar value to the March "winter" sea ice maximum. In essence, as sea ice free conditions occur earlier in the year, you get low albedo conditions with stronger radiation. At some point, requiring sea ice free conditions earlier than June according to Eisenman and Wetlaufer, sufficient radiation is absorbed over the summer that the sea ice does not refreeze on the following winter, at which point reduction to the same global mean surface temperature will not restore sea ice (although at some point below it, it will).
I note again that I am not well read on this topic, so other papers may have different results - but these are the three papers I have read, and all agree on the basic point - sea ice free conditions in September do not represent a tipping point.
-
nigelj at 10:15 AM on 13 February 2017Correcting Warren Meyer on Forbes
One Planet Only Forever, just adding to clarify my main repsonse directly above, we should obviously be trying to make it better for poor people, but with direct anbd genuine assistance of some sort, or higher minimum wage laws. Tariffs are not the way.
-
nigelj at 10:02 AM on 13 February 2017Correcting Warren Meyer on Forbes
One Planet Only forever @16 &17,
Some good points.
Yes I agree your higher level objective or ethic should be front and centre. But read what I said, I already said it's a good simplifying goal, (and so obviously should be upfront).
But the point is we need to consider is how we persuade people to adopt it, because it cannot happen at the point of a gun.
In fact my country has a resource management act based around the idea of sustainablity, so we are half way there. Sadly it comes under a lot of attack.
The rest of what you say makes sense.
I personally think the use of the word "catastrophic" has been unwise. It plays into the hands of people who can then claim things like "hysteria, scarmongering, chicken little etc". Don't get me wrong, climate change is likely to be catastrophic in at least some regards, to those who have a bit of knowldege of earth systems, but sadly academics are not always experts in communication. I think the term very serious is accurate enough, and the better term.
It's easy enough to get peoples attention without massive hyperbole. A few photos of shrinking glaciers is enough. I actually think most people do accept the science of climate change and that conesquences are serious. Polls tend to show this. The problem is everyone is kind of frozen in indecision and fear about what to do, and of course you have vested interests saying do nothing. In all fairness, humanity has never faced such a large and intractable problem before, or not many.
But theres now no escaping we are altering a lot of things, partly due to the population explosion, and the only way forward is resource management on a global scale. This is challenging on several obvious levels.
Donald Trump may have some fine objectives, to end poverty in America for example, and of course I hope he does well, and I try to take people at face value in good faith, "but" his detailed words and actions to date are very inconsistent to his objectives. Even if he "brings back" a few manufacturing jobs with his tariffs scheme, it's hard to see how that would help people in services industries on very low wages. My country tried tariffs in the 1970s, and although they pushed up some wages, they caused a vast range of other problems.
And part of Trumps plan seems to be to "End Poverty" by sacrificing the environment. This does not make a lot of sense. You can't cure one problem by causing another problem.
It all looks more like a transfer of wealth and power to the corporate sector. A few poor people might be slightly better off,in the process, at the most, but the net result will be lower overall wealth for America as a whole long term, and mostly a win for the business sector in the short term. His protectionist thinking works short term, but not so much in the long term, imho.
But obviously I hope I'm wrong, and it all works out well for everyone.
-
ergodicity at 09:36 AM on 13 February 2017Climate's changed before
Has anyone done a study on this possibility? There is a theory that the magnetic field is weakening because earth is in a period of magnetic poles shifting. What is its effect on global warming?
-
One Planet Only Forever at 09:08 AM on 13 February 2017Correcting Warren Meyer on Forbes
nigelj@15, If Donald Trump truly honours his Inauguration Speech claim that he will end poverty in the USA. And he does it in a lasting way that does not harm the short-term future for people outside of the USA or harm or create challenges for future generations in any way. Then on that issue Donald Trump's leadership actions would not be the antithesis of my objective.
I would love to see Team Trump, and all other leaders, succeed in legitimately honouring that Promise. However, I believe it is likely that Team Trump will only make-up more ultimately unsustainable perceptions of Winning on that issue. Making up appealing claims appears to be their only proven talent.
-
One Planet Only Forever at 08:54 AM on 13 February 2017Correcting Warren Meyer on Forbes
nigelj@15, I understand that I am referring to a higher level objective or ethic. I am fairly certain that root of the problem is that the higher level objective is mainly missing from consideration in what is going on. And because it relates to so many aspects of human activity commenting about it really has no limit.
I am attempting to distill it into a climate science limited presentation and submit it as an OP for SkS to consider posting.
My comments to date are exercises in trying to present the point, limiting it to climate science. But providing supporting points of evidence comes from a massive variety of issues. Trying to create the comments and getting feedback has been helpful. I am not a fan of brevity. Use of terms always needs definition of the term, so I find I try to present descriptions rather than using terms. I also type comments as I think of things (more things come to mind as the comment develops) then review and edit to a degree. That leads to longer statements potentially out of sequence that I find as difficult to follow as they are difficult to reorganize and break down into smaller statements then tighten up without becoming more open to misinterpretation.
My current best concise presentation of my thinking is the need to focus on a scale for evaluating human actions that is "Helpful through Harmful" with the objective basis for positioning actions being "Advancing all of humanity to a better future". Other scales can be useful for differentiating thoughts and perspectives, but the “Helpful through Harmful” would govern over the other scales which would be personal preference or ideological scales.
Another way to say that is that actions that are on the Helpful side of the scale are valuable to humanity regardless of where they sit on any other evaluation scale (regardless of their popularity or profitability). And actions that are “harmful” are just harmful no matter where they are on any other scale, with no consideration of credit for a benefit someone may perceive they get. And any action that is in no way harmful but is also not helpful would be at the lower limit of acceptable personal entertainment.
Establishing the higher order valuable objective of human activity is essential (and it applies locally and globally). It cannot be allowed to be considered to be just a matter of personal opinion or preference. And there must be no “Balancing of Harm with Help”. Without that clear truly deserving objective basis for measurement and setting limits on acceptability (and I am open to considering stronger clearer more valuable objectives), claims could be made that misleading marketing is "Helpful" (to the people it provides an advantage to). And people could claim that investigating or explaining the unacceptability of a developed popular and profitable activity is "Harmful" (to the people who do not want to give up their developed perceptions of prosperity and opportunity).
Claims that reducing future challenges would be “too costly for people today” would clearly end up on the Harmful side. No amount of current perception of value having to be “given up” would justify a likely risk of future challenges being created. Businesses mitigate Risk. And the best way they do that, form their perspective, is set things up so that others will suffer the consequences or the evaluation of damage will be limited like the Horizon Disaster where only a living person who could directly prove how their life was financially affected could claim “Harm” and get the current shareholders to lose wealth (note that many shareholders benefited from the riskier more profitable approach to things that ultimately caused the Horizon Dister but were no longer shareholders when “payment for damages was required”). The fact that future generations cannot possibly continue to benefit from burning fossil fuels is an additional negative point about that activity, as are all the other non-climate related impacts of the activities related to extracting and burning fossil fuels.
Of course the current challenge is undoing all of the damaging popular and profitable developments. That ultimately would happen quicker if leaders could be removed from positions of influence if it can be shown that they failed to be well aware and best understand what is going on (something that voters and shareholders should expect of their leaders) and apply that understanding to improve the future for all of humanity (the only worthy actions of a leader regardless of the potential popularity or profitability of other interests or objectives).
A more difficult argument to make using what I have presented is claiming that exaggeration or misleading marketing is helpful if it raises awareness of an issue leading to the greater potential for people to realize the importance of changing their attitudes and actions to help improve the future for all of humanity. In the case of climate science, some people presenting the potential worst case future has developed a “Harmful” result, the creation of the CAGW argument as the excuse to discredit any and all climate science information.
Nigel, I may have done it again.
-
Jim Hunt at 07:42 AM on 13 February 2017Mail on Sunday launches the first salvo in the latest war against climate scientists
David Rose's second salvo appeared in the Mail on Sunday today. There was even less substance to it than in his first article, and hidden away an alleged "correction" to his first "whistleblower" article.
http://GreatWhiteCon.info/2017/02/david-roses-climatic-alternative-facts-and-deceptions/
I don’t see an accurate graph in Mr. Rose’s profuse apology. I see no mention of “World leaders not duped, Mail readers conned again”.
-
nigelj at 06:14 AM on 13 February 2017Correcting Warren Meyer on Forbes
One Planet Only Forever @14
I meant by climate change not being a cost problem, that a transition to renewables is affordable. The Stern Report calculated it will cost 1% of a countries gdp per year. I should have been more specific. I think this is also what Chriskoz meant.
But I agree with your post entirely. I totally understand where you are coming from on costs, and all the rest of your views on humanity. But with respect, I just think your writing style is rather convoluted sometimes, and others may struggle. There must be a simpler, shorter, or more ordered way of saying it, although granted these issues can only be simplified to a certain extent. But you have some great ideas.
You are really talking about "cheats" who cheat the legislative rules, or who simply act unethically, or selfishly.Your insight here is to note that the more they get away with it, the more emboldened they become (and Trump might be a prime example). And the more power they get, the more they get to control the rules.
The only solution ultimately are government rules and boundaries on economic behaviour, and trying to get the balance right between firm rules, but not overly punative or petty or complex rules. The latest Economist Magazine discusses this challenge in terms of the big Dodd-Frank finance regulation legislation in the USA. Of course the challenge is convincing politicians to have a strong but fair regulatory framework, and set of boundaries, and convincing the population to support political parties that stand up for the same things. It's easier said than done given vested interests opposing these very same things.
We had the exact same charities issue in New Zealand. Personally I think they absolutely must be allowed to speak out on political or social issues etc ( and the same applies to government agencies), but I would accept some upper limit and 10 -20% would seem reasonable. Given they are tax payer funded, or get tax breaks, there should be some upper limit I guess for obvious reasons.
But when conservative parties try to shut down all rights of charities or other groups to speak out, or protest, by threatening to withdraw funding or tax concessions, this is absolutely wrong. Of course we are seeing something similar now in America under Trump, on climate issues, and a whole range of others as well.
I get the last paragraph. I would say capitalism promotes winning, and this can be healthy. But winning promotes cheating and abuse of power, and the winners often control the rule book, and then have a record of making it easy for their associates to abuse power as well.
The public ultimately also weild power at election times and sometimes throw out leaders who abuse power. It sort of balances but only sometimes.
It appears that underlying your discussion is a premise a that we as a species should be planning what we do using criteria of how this affects future generations. This appeals to me 1) because it just seems right and 2) it has the virtue of a simple goal and 3) because it propogates the species within a stable world and has forward looking economic value. I also think it is affordable for us to do anyway. Something a simple as fisheries quotas and conservation does not mean we stop all fishing, for example.
However your views on considering future generation as a prime goal, is ultimately a statement of belief or morality, although in my view a good one. In environmental terms it is the sustainablity concept. How do you get people to subscribe to such a view? Start a political party?
But as with many things in life, we could at least start with protesting against the antithesis or opposite of your ideas, which is Donald Trump.
-
One Planet Only Forever at 04:30 AM on 13 February 2017Correcting Warren Meyer on Forbes
nigelj@13, Climate Change is a cost problem, and so much more. The future costs and challenges are faced by "others", not by the ones hoping to benefit.
And I think that the challenge of the science of climate change may be a tipping point regarding the development of broad based understanding of the tragic history of human failure to improve the future for all of humanity.
Exposing the unacceptable actions and the unacceptable excuses made-up to impress easily made-up minds (minds easily tempted to be greedier or less tolerant), will have a powerful effect far beyond climate change. There is a massive amount of undeservingly popular and profitable activity in the global economy rewarding undeserving winners.
It is clear that games of popularity and profitability have failed to improve the future for all of humanity. Part of the proof is that many people still suffer through short existences on this amazing planet even though measures of wealth have increased more rapidly than population (regionally and globally). The less helpful and more harmful a person can get away with being, the more of a competitive advantage they have, the more likely it is they will Win.
I understand this because the charitable acts I participate in and support are efforts to deal with the damaging results of the games people play. Almost all the other helpful charitable acts face similar challenges.
And it is frustrating that the combined charitable activity cannot 'fix' all of the damage, meaning that effort that could have been directed toward improving the future had to be directed at trying to 'fix or reduce' the damage done by Winners who did not care about advancing all of humanity to a better future.
A particularly galling case of damaging leadership was when the Conservative Government in Canada chose to impose an investigation into charities that had determined that it would be helpful to promote public awareness campaigns to raise awareness of what causes the problems they are trying to address (the smae government declared that government funded scientists could not publically discuss their science - they had to get passed through the Government's message control filter). The Conservative Government of Canada declared that such 'education of the public' was 'political'. And charities were legally not allowed to spend more than 10% of their money on political action (a measure that had been put in place to block attempts by groups like the Conservative Party from getting more funding or political advertising through "a charity").
It is undeniable that unacceptable developed perceptions of prosperity and opportunity can be very difficult to overcome, particularly if popularity and profitability are considered to be legitimate measures of who and what actions are "Winners". It is even more difficult when deliberately unhelpful/harmful people have Won control of leadership (in pursuits of business or politics or media or sports or ....)
-
knox kp at 03:30 AM on 13 February 20172017 SkS Weekly Climate Change & Global Warming Digest #6
Sorry if this question is a bit convoluted - I came to ask a question about the current state of the arctic - from my layman's POV sometime in early Nov. the dome of cold air that was on top of the world fell off and landed on Eurasia, where they experienced weather -20 C below normal for weeks while in the arctic it was almost the opposite with temps upwards of +20 C above normal - temps as I write are 32-34 C above normal in the arctic and most of Eurasia is still under the influence of that cold weather that arrived in late fall of 2016 - as the remnants of this dome get warmed up with the coming of spring and summer and the arctic already far warmer than normal will see the sun and what's left of the ice starts a melt, so we're seemingly very close to that ice-free arctic summer - will it ever be as cold in the arctic as it once was? - is that dome of cold air falling on Russian and Europe a climate tipping point event?
-
pwl at 01:33 AM on 13 February 2017CO2 lags temperature
Tom Curtis@524
Thank you for your reply.
Do you know, I think the best way to solve this whole pro IPCC / anti IPCC Carbon emissions debate and headache would be to just remove all the CO2 from the Earth's atmosphere.
Once we've done that, there'd be no need for anyone to get all worked up and it wouldn't do that much harm would it. Clearly CO2 is really at the root cause of this whole problem and the sooner we uproot it and get rid of it all, the better. (snip)
Moderator Response:[RH] Before you continue to post, I would highly suggest reading the SkS commenting policies. Please keep your posts to the point and written so that they contribute to a positive, learning conversation.
Edit: Followup post deleted for moderation complaint. Also, this snipped post has a sarcastic tone not present in Chris Colose's piece. ...Please move on.
-
Tom Curtis at 23:30 PM on 12 February 2017CO2 lags temperature
pwl @523, the very first IPCC report says of the relationship between CO2 and temperature changes between glacial and interglacial, "Variations in carbon dioxide and methane in Ice Age cycles are also very important factors, they served to modify and perhaps to amplify the other forcing factors." So, from the very first IPCC report, the idea that CO2 was a feedback in the glacial cycles already exists.
In fact, I can trace the idea further back than that, to at least 1980 when Saltzman and Moritz describe the action of CO2 in a climate model, saying, "Another positive feedback included is due to longwave emissivity changes associated with CO, changes that, in turn, are postulated to arise in response to the variations of mean Ocean temperature Θ."
The point is that popular presentations, particularly "skepical" presentations often exclude nuance that is found in the scientific literature and IPCC reports. This may give the appearance that the IPCC is responding to "some bright wag" when popularizers of climate science are merely drawing attention to something that has been in the IPCC account all along. What has changed is the popular presentation, and that in the face of a misunderstanding that would already have been cleared up from reading the scientific literature or IPCC. Indeed, it is not unusual to be presented with stunning "new" arguments that merely rehash in an imprecise way a part of a debate that occurred in the scientific literature decades (and in some instances over a century) ago.
-
pwl at 23:01 PM on 12 February 2017CO2 lags temperature
MICHAEL SWEET,
My thanks for your rapid and courteous reply Sir.
So basically before the ice core data was interpreted by some as noting that the former IPCC solidly supported claim of "CO2 CAUSES causes global warming" was put in jeopardy, it was felt unnecessary to say "cause and effect."
And then after some bright wag noted that the ice core data suggested other than what the IPCC had claimed up to a certain date, it was felt necessary to explain it as "cause and effect." And adding into the mix that at the end of the ice age CO2 used to be a forcer and an effector but now it's semi retired back to being a forcer.
Well that seems perfectly and confusingly acceptable to me. There again when I do jigsaw puzzles I usually use a pair of scissors and a hammer too.
By the way, I thought we were still in an Ice Age - albeit an inter-glacial one?
I take it that the CO2 retires from being a feedback during an inter-glacial, shall I?
Moderator Response:[RH] Use of all caps is not allowed on SkS (starts to read like yelling).
-
michael sweet at 22:10 PM on 12 February 2017CO2 lags temperature
PWL,
The video attached to the OP directly addresses your questions. It will be the best way for you to become more scientific.
The short answer to your question is that at the end of the last Ice Age changes in the Earth's orbit started warming. the warming released CO2 into the air. That CO2 caused more warming in a feedback loop. THus CO2 was both a feedback and a cause of the warming as the ice age ended.
The situation is different today. Humans are releasing huge amounts of CO2 into the amosphere. The CO2 we are releasing is the forcing causing the temperature to rise. Humans affect the climate in other ways, for example, farming changes how much light is reflected back to space from land, but CO2 is the most important driver of climate.
At the end of the ice age CO2 was both a forcing and a feedback. Today CO2 is the primary forcing of climate change.
The more you read the more you will know. Keep asking questions about the things you do not understand.
-
pwl at 19:42 PM on 12 February 2017CO2 lags temperature
Your article justifying the IPCC initial panic on Ice Core data which gave rise to concern along the lines of "which came first, the chicken or the egg," or being less frivolous and keeping within the goal posts of "which came first, CO2 or Warming," is nicely handled in describing it much as the God Particle, it being all over the place at one and the same time: "In other words, increasing CO2 levels become both the cause and effect of further warming."
You then further state, "This positive feedback is necessary to trigger the shifts between glacials and interglacials as the effect of orbital changes is too weak to cause such variation." I read this as justification of CO2 being the major influencer as the cause of warming rather than not being a cause - one assumes this is what you are leading us to believe?
Please correct me and educate me where I am undoubtedly wrong but I thought the Gospel according to the IPCC was that, "In the climate system, CO2 concentration is a forcing, whereas for example, water vapour concentration is a feedback?
So what exactly is this "positive feedback" or did you mean “positive feedback forcing,” or should I just shut up and admit that I’m not a scientist?
Yours cordially,
A Bear with demonstrably little grey matter. -
nigelj at 12:43 PM on 12 February 2017What do gorilla suits and blowfish fallacies have to do with climate change?
The following would be a characteristic of climate science denial, but does not seem to be in your generally excellent list. Unless it's a missrepresenation of a sort. Claims that "CO2 is great because we want a warmer world, or it makes plants grow".
It's turning the argument right around. I have seen similar claims were made for Tobacco early on. It is Orwellian.
Perhaps we could call it the Chameleon (those lizards that change colour)?
-
nigelj at 08:06 AM on 12 February 2017What do gorilla suits and blowfish fallacies have to do with climate change?
Tom Curtis @9, I posted a detailed response, but it either disappeared into cyberspace, or was possibly deleted as getting too off topic.
I do need to clarify I had already read that study, and accept that study entirely, and wasn't suggesting some false equivalence between Trump and Clinton.
Getting back to the article, it's a good list of the standard tricks. I do feel alternative truths is the new climate scepticism, and the latest rhetorical trick.
I think we go through cycles regarding how we trust the "authorities" or the "elite". In the 1950's authoritarianism was dominant, and trust appeared quite high, then the counter culture questioned the conventional wisdom in the 1960's, as is well documented. I think we switched back to trust in the elites in the 1980's, and now may be going through a period of distrust. Brexit and Trump are clear evidence of falling trust in the conventional wisdom and elites (in my opinion mostly unjustified, but not entirely unjustified).
There thus appears to be a cyclical nature to this trust thing. It's easy to see it going much further back through history as well.
This distrust can also have positive and negative virtues, depending on whether it examines things rationally or not. Its like healthy scepticism, versus scepticism that is irrational, and uncritical of itself. The outcome at this point is distrust of elites, and dissemination of alternative truths. I think this cycle will end, and the sooner the better.
Moderator Response:[JH] The most recent set of Coal Miner's posts were deleted because they were off-topic, policitical, sloganeering. The responses by you and Tom Curtis were also deleted because they were also off-topic. Let's keep the discussion focused on what is presented in the OP.
-
perseus at 00:08 AM on 12 February 2017What do gorilla suits and blowfish fallacies have to do with climate change?
I note Wikipedia has banned the use of Daily Mail references as 'unreliable'. No doubt David Rose's contributions in the Mail influenced this decision!
This is particularily amusing as the UK Prime Minister has just appointed the Mail's Political Editor as her spokesperson! You couldn't make it up.....
http://www.thecanary.co/2017/02/10/astonishing-move-theresa-may-going-give-us-daily-mail-government/
Moderator Response:[JH] Link activated.
-
Tom Curtis at 14:42 PM on 11 February 2017What do gorilla suits and blowfish fallacies have to do with climate change?
nigelj @8, Politifact Donald Trump/Hilary Cinton/Bernie Sanders Scorecards:
True: 4%/25%/13%
Mostly True: 12%/26%/38%
Half True: 14%/24%/22%
Mostly False: 19%/14%/17%
False: 33%/10%/11%
Pants on Fire: 17%/2%/0%
Bernie Sanders had a reputation for honesty, but Hilary Clinton was in fact more honest on average than he. She did, however, make a very few real whoppers. The fact is that Hillary was not particularly dishonest for a politician. Her reputation in that regard was scrupulously built up by Republican propoganda.
Trump, of course, is in a league of his own. So much so that I, at least, was surprised to find that 4% of this statements are true.
Here are John Kasich's (similar to Hillary's) and Ted Cruz's records as well, to complete the list of those who made it late into the primaries.
-
nigelj at 13:38 PM on 11 February 2017What do gorilla suits and blowfish fallacies have to do with climate change?
Coal Miner @7, Hilary Clinton did invite the email problem on herself. I think she was rather brave and took a risk standing for president with that problem around her neck. I do wonder if it was wise.
However that doesn't alter the fact it was blown out of proportion.
I havent't seem any evidence of any real problem with obamas birth certificate. I don't care where he was born, provided his adult life was in America. Your laws seem a bit overly restrictive. Europe isn't nearly as restrictive.
It's easy to tell who is blatantly lying. Trump lies almost when ever he opens his mouth. It's been proven so many times now beyond any doubt. Hilary Clinton wasn't too great either.
Other American presidents seemed to have a great deal more integrity, or at least were a bit more careful what they said!
But fake news and alternative truth isn't good, whatever the complex causes of this growing phenomenon. It will cause confusion and bad policy decisions. Garbage in, garbage out.
it's far better to trust mainstream science. It's not always perfect, but it's a thousand times preferable to gut instincts, emotive beliefs, or pseudo science.
-
nigelj at 13:23 PM on 11 February 2017Repeal without replace: a dangerous GOP strategy on Obamacare and climate
Coal Miner @65, if small countries can easily change over to renewables, then so can single states in America, one would think.
Hydro "is" renewable energy. To summarise NZ is 80% renewable, with hydro, geothermal and wind. The other 20% is mostly gas.
At this stage wind power only makes up a small fraction, but that is because we have got hydro power, and had it for some time, and dams don't really wear out. Wind power is already fully competitive on costs.
Granted there are costs in replacing generators with renewables, but economists like the Stern Report have found these amount to 1% of gdp per year. That's very affordable. Plenty of this will just be replacing fossil fuels plants that need replacement anyway.
It's interersting watching the Trump Admistration in chaos in just two weeks. Never seen anything like that before.
-
Rob Honeycutt at 12:42 PM on 11 February 2017Repeal without replace: a dangerous GOP strategy on Obamacare and climate
Personally, I think the EIA figures for EV's are overly conservative. Once the price of batteries comes in line (as is happening) then EV's with range equal to a ICEV will be cost about the same. Then, why would anyone buy an ICEV?
Currently, a full charge on a Tesla is about $12, compared to filling your gas tank for $40-$50.
Projections, like the EIA does, have to be based on data. But markets often don't conform to what data will tell you. There are about 250 million cars in the United States and they're, on average, about 10 years old. About 16 million cars are sold annually right now. That means, at current rates, it takes about 15 years to replace the entire fleet.
Once the economics of EV's click into the right range, the change over will happen very fast.
My suggestion: Don't be that guy who buys a gas guzzling SUV right before the market shifts. The resale value on that vehicle will be $0.
-
Rob Honeycutt at 12:30 PM on 11 February 2017Repeal without replace: a dangerous GOP strategy on Obamacare and climate
You need a car that will cover more than 300 miles in a day?
-
Coal Miner at 11:51 AM on 11 February 2017What do gorilla suits and blowfish fallacies have to do with climate change?
5, 6 -
They both did it to themselves. That's politics I guess - if you provide ammo, your enemies will use it on you. Doubt we'll ever know the truth about either issue. It's hard to tell who is telling the truth today.
-
Coal Miner at 11:45 AM on 11 February 2017Repeal without replace: a dangerous GOP strategy on Obamacare and climate
58 -
Should be pretty easy to switch to RE in a small country like NZ. 80% of electricity, mostly from Hydro; but only 40% overall energy from RE; but that is better than the 6% or so RE in the US.
64 -
We're slowly going to RE, mostly in electrical production. If EVs can reduce cost of gas, I'll be happy, but when that happens fewer people buy EVs. EVs are almost insignificant now - maybe 1% of sales, with the EIA projecting 6% of sales by 2040. Hybrids topped out at 3.2% of sales and are now about 2% of sales due to low gas prices. If you can use one and can afford it, great. I need a car that will cover longer distances than EVs. Hybrids are not a solution to carbon, and EVs are only if the source is not adding carbon.
I'm hoping a workable and economical solution will be found soon to start removing CO2 from the atmosphere. Here's a top of the head proposal: Build desalinazion plants (nuke powered perhaps) along the ocean coasts of dry areas with decent soil. Water the land and grow plants to absorb CO2 - perhaps trees.
-
nigelj at 11:29 AM on 11 February 2017What do gorilla suits and blowfish fallacies have to do with climate change?
Digby Scorgie @5, yes the emails were a giant blowfish, permeating the campaign and media and distracting from everything really important. The woman was a bit slack with her computer systems, but it was never the big issue it was claimed to be. Obamas birth certificate was also a blowfish.
-
nigelj at 11:17 AM on 11 February 2017Correcting Warren Meyer on Forbes
Chriskoz @11, one correction to my comment immediately above. I meant to say climate change is not "only" a social problem. Clearly it is a social issue in that those who currently benefit from buring the most fossil fuels are not those going to be most affected. And it's a self interest family weath issue that is perceived to be an insulator.
But it's also the things I said related to politics and so on. This is why humanity is struggling with the climate issue, its complex and muti facetted. What's needed is some circuit breaker that cuts through all this.
-
John Hartz at 10:53 AM on 11 February 2017Repeal without replace: a dangerous GOP strategy on Obamacare and climate
@ Coal Miner #60: Something for you to chew on:
The world could reach peak oil and coal in as little as three years—not because either is close to running out, but because of the falling cost of solar power and electric cars and stronger climate policy.
A new report from the Grantham Institute at Imperial College London and the Carbon Tracker Initiative analyzed how much demand for solar and EVs could impact demand for fossil fuels, and how quickly that could happen. Researchers modeled various levels of climate policy and energy demand, and the low and dropping costs of low-carbon technology.
"We've been aware through our research here at Imperial about the very dramatic cost reductions in solar photovoltaics and also lithium ion batteries…and about the potential for photovoltaics and electric vehicles to cause disruption in the energy market if their costs reach particular tipping points," says Ajay Ghambir, a research fellow at the Grantham Institute. "What we wanted to do was get underneath some of the hype and try and think about what some of the consequences would be of very fast take-up of these technologies, driven by their cost-competitiveness, on the energy system."
The World Could Reach Peak Coal and Oil in Three Years Thanks to Cheap Renewables by Adele Peters, Coexist, Feb 7, 2017
-
nigelj at 10:43 AM on 11 February 2017Correcting Warren Meyer on Forbes
Chriskoz @11, just another thing, people like Trump who don't care about climate change have enough money, and probably gamble that their children, and their childrens children will be insulated by inherited money. But of course it's a gamble, because ultimately nobody will be able to escape the negative affects.
Climate change is not really a cost problem, but I'm not sure it is a social problem. I would say climate change is not basically even a science denial problem, with the vast majority.
Climate change is an ideological problem about community versus individual rights, and it is a problem of political will that is tied to campaign donations, and a problem of psychological addiction to fossil fuels that subconsciously distorts our thinking.
-
Tom Curtis at 10:31 AM on 11 February 2017Repeal without replace: a dangerous GOP strategy on Obamacare and climate
Coal Miner @54, diesel can be produced from electricity, water and CO2. So can jet fuel. Given that, solving the standing energy problem (as has been demonstrated by those cities) defacto solves the problem for transport. There may be some time to commercialization of those processes, but the transport problem (particularly air transport) is well recognized as the most intractable problem to solve. (That is part of the reason why we should be converting to renewable supplies of standing energy far more rapidly then we are currently doing.)
Interestingly, one of the problems with renewable energy is that you have to overbuild capacity so that the variable supply will be sufficient in periods of low wind/overcast conditions. The excess energy produced in the periods of oversupply is effectively free, and can readilly be harnessed to create fuels, desalinate water, or in other processes that are not time critical, and will be economic (or significantly more so) given the supply of very cheap energy (if variable).
(This will be my last reply to Coal Miner to avoid dogpiling.)
Prev 444 445 446 447 448 449 450 451 452 453 454 455 456 457 458 459 Next


