


 Arguments


Recent Comments
Prev 460 461 462 463 464 465 466 467 468 469 470 471 472 473 474 475 Next
Comments 23351 to 23400:
-
BILLHURLEY13951 at 01:50 AM on 14 December 2016On climate change, angels and demons are battling over Trump’s soul
I really think our side doesn't appreciate the importance of 'paradigm' in human understanding.
What appears ignorance, often is just the polite reaction of someone who doesn't get the big picture and you're telling him/her the details without explaining the big picture first. The big picture is simple - 7 billion people now with most of them using 35 times the natural resources unsustainably.
IE Evil people are not the cause. That turns heads among "trumpistas"
-
mark48 at 01:38 AM on 14 December 2016On climate change, angels and demons are battling over Trump’s soul
Don't get played by Trump. He is the current (!) producer of a reality TV show and he has been running his transition like The Apprentice. The NY Times editorial staff made a big deal out of his 'I have an open mind' comments, but read the actual transcript of the Times interview. He would make a ridiculous climate denier comment, then finish with 'but I have an open mind'. He used Al Gore to distract attention from his cabinet picks, and probably DiCaprio, except DiCaprio did manage to emphasize the jobs potential of clean energy. Trump's cabinet nominations and the DOE questionnaire trying uncover 'climate moles' in the DOE say everything. We grasp at Trump's gratuitous comments in hopes that it isn't as bad as it seems, but it is. Elections have consequences and far too many Americans did not bother to vote. Trump lost the popular vote and was elected by about a quarter of the eligible voters. Over the next 4-8 years we will be conducting a grand climate experiment, 'the will of the people'. 'Belief in climate change is optional, but participation is mandatory' (Jim Beever, SWF Regional Planning Council).
-
Tom Curtis at 00:51 AM on 14 December 2016There's no correlation between CO2 and temperature
john warner @150, are you explicitly stating that your snipped post @146 answers my question at the end of my post @149. In other words, you are explicitly stating that (in my words), "There is an external source of energy which provides the energy allowing the atmosphere to radiate at 199.8 W/m^2 at approximately 6 Km altitude, but the additional emission at the surface is the result of a continuous energy supply to the atmosphere by gravity".
Is that correct?
-
Tom Curtis at 16:35 PM on 13 December 2016There's no correlation between CO2 and temperature
john warner, given your tendency to ignore rebutals, and just switch topics, the moderators have directed you to stick to the topic @142 until you have acknowledged your errors therein, or proved your views on that topic to be correct. (See Moderator's comment @146, and @147. Particularly the statement that:
"I propose John first address the pressure and temperature violation of thermodynamics. Any comments outside of that will be struck until John addresses this one."
)
In light of that, you claim @142 that the ideal gas law states:
P = CDT (1)
where P is pressure, C is a constant, D is density, and T is temperature.
The ideal gas law is normaly given as:
PV = nRT (2)
where P is pressure, V is volume, n is the number of molecules of the substance (in moles), R is the gas constant, and T is the temperature.
Rearranging (2), we get
P = (Rn/V)T (3)
If we then multiply n/V by the molar mass of the substance (M(s)), relying on the fact that M(s) * n equals the mass of the substance, we then get
P = R/M(s) * DT (4)
Substituting with one, we then find that so long as C = R/M(s), your formula is correct. R = 8.3144598 J/(K mol). The molar mass of dry air is 0.02897 Kg / mol. Ergo, in the case of dry air, C= 287.0024 J /(Kg K)
Inserting, that and checking units, we find that the right hand of the equation has units of Joules/meter^3, which reduces to units of (kg x m^2)/(m^3 x sec^2). That cancels to units of kg/(m x sec^2) In the meantime, the left hand has units of pascals, or kgs/(m x sec^2). The two are identical, thereby validating the equation.
Comparing to your exposition @142, I first notice a slight difference in the value of C (about 2%), which is possibly due to rounding errors in the calculation. I also notice @148 that you use correct units for C. It follows that your presentation of the ideal gas law, although ideosyncratic, is valid.
You proceed by saying:
"How much did the Gravity induced increase in Temperature increase the the radiation emitted by the surface temperature? 154.8wpsm. 199.8wpsm +158.4wpsm=358.2wpsm."
That is ambiguous to me. Are you saying that:
1) Gravity induces a temperture difference in the atmosphere between an altitude of approximately 6 kms and the surface, such that additional energy must be supplied from some other source (ie, not from gravity) to maintain that equilibrium temperature difference (and hence difference in emmitted radiation); or
2) There is an external source of energy which provides the energy allowing the atmosphere to radiate at 199.8 W/m^2 at approximately 6 Km altitude, but the additional emission at the surface is the result of a continuous energy supply to the atmosphere by gravity?
(1) is, of course, the standard theory of the greenhouse effect; while (2) is arrant nonsense.
(PS inline @147, I looked carefully at the post suggested, and Postma's article and I cannot find where he is suggesting the theory such as john warner appears to be expounding above. While we have encountered that theory several times on SkS, it has always to my knowledge, been in comments and lacks a specific article debunking it. Hence, for want of a better location I am continuing to discuss it here.)
-
john warner at 14:09 PM on 13 December 2016There's no correlation between CO2 and temperature
Michael sweet @ 147
101325 Nm-2 = 287.052 Nm-2m3/kgoK * 1.25203 kgm-3 * 281.930oK
Nm/kgoK
J/kgoK
If you know that a pascal is defined as a Newton per square meter and simplify the expression to a Newton meter which is a Joule you can see that the individual gas constant for air in Standard International Units is 286.9 J/kgoK.
http://www.engineeringtoolbox.com/individual-universal-gas-constant-d_588.html
Would you repost my snipped comment so I can defend it.
Moderator Response:[RH] Please respond to Tom's comments below. This needs to be acknowledged and resolved before moving forward.
-
Stardustoz at 11:32 AM on 13 December 20162016 SkS Weekly Climate Change & Global Warming Digest #50
FYI - I've noticed your social media share tab has not been working correctly the last couple of days. It' s not linking the article of interest or providing a shortcut to the more popular social media options (such as Facebook or Twitter for example).
-
John Hartz at 06:09 AM on 13 December 2016On climate change, angels and demons are battling over Trump’s soul
Supplementing the information contained in Dana's article...
The heads of Donald Trump’s transition teams for Nasa, the Environmental Protection Agency, the Department of the Interior and the Department of Energy, as well as his nominees to lead the EPA and the Department of the Interior, all question the science of human-caused climate change, in a signal of the president-elect’s determination to embark upon an aggressively pro-fossil fuels agenda.
Trump has assembled a transition team in which at least nine senior members deny basic scientific understanding that the planet is warming due to the burning of carbon and other human activity. These include the transition heads of all the key agencies responsible for either monitoring or dealing with climate change. None of these transition heads have any background in climate science.
Trump's transition: sceptics guide every agency dealing with climate change by Oliver Milman, Guardian, Dec 12, 2016
-
michael sweet at 03:12 AM on 13 December 2016There's no correlation between CO2 and temperature
John Warner,
At 142 you claim that according to the ideal gas equation P = CDT where C is the ideal gas constant (normally abbreviated as R), D is density and T is temperature. If that were the case, since all gases have different densities, all gases would have different pressures at the same temperature and volume. All my High School students learn that at the same temperature and volume different gasses have the same pressure. Your equation is falsified by my college textbook (Brown and LeMay: Chemistry the Central Science 11th edition page 407).
I cannot find your value of 287.052 Pam3/kgoK for R anywhere on the Internet. It appears that you made this up. What are these units anyway?
As MA Rodger explained, while pressure and temperature are related, you cannot draw power with gravity as the source. That violates the First Law of Thermodynamics.
Your "calculation" using Boltzamn's law (struck by the moderator) was similarly in error.
Since you have demonstrated that you cannot calculate values from first principles, you must start to reference your material to accepted sources. You need to start asking questions about how the atmosphere works. People here are happy to help you understand. Everything you explain just makes others doubt you more.
Moderator Response:[RH] Though it's dubious to believe it would be fruitful, perhaps it would be good to take John's errors one at a time. The list is large and growing, thus the potential for advancing the conversation is diminishing.
I propose John first address the pressure and temperature violation of thermodynamics. Any comments outside of that will be struck until John addresses this one.
[PS] John has bad habit of simply ignoring inconvenient response and then changing to a different tack. He not responded to errors pointed about source of CO2, meaning of correlation, calculation errors and now a monumental misunderstanding of thermodynamics. Furthermore he is repeatedly ignoring moderator instructions to find suitable thread.
I agree that John should respond here to either acknowledge the errors or defend his position and any other response should be deleted. This vaguely resembles Postma's nonsense so perhaps further followup beyond this should go to here.
-
john warner at 01:35 AM on 13 December 2016There's no correlation between CO2 and temperature
From the Stefan-Boltzmann Law if we know the temperature we can calculated the rate at which the air is cooling itself. The total air at all altitudes combined radiates to space at the rate of 199.8 W/m2. That is the only energy that needs to be replaced to maintain all of the temperatures of the temperature gradient.
[snip]
Moderator Response:[RH] John, before you go any further here, you're going to have to directly and clearly address the shortcomings that have been pointed out so far.
-
Tom Curtis at 00:51 AM on 13 December 2016There's no correlation between CO2 and temperature
john warner @142, if you look at the diagram @140, you will notice that the 169.9 W/m^2 from atmosphere, and the 29.9 W/m^2 from clouds are labels for arrows leading upwards. That is, they are the upward IR flux from the atmosphere at the Top Of the Atmosphere (TOA). While it is true that the IR flux from a layer of the atmosphere sufficiently thin so as to absorb essentially none or the IR photons emitted from the layer is equal in both the upward and downward direction, that is not true of the atmosphere as a whole. It follows that upward IR flux at the TOA from atmospheric emission does not inform us regarding the downward IR flux from atmospheric emission at the surface. Ditto for clouds. Reading the chart as it it does is nonsense.
That is most easilly seen with clouds. Clouds are essentially opaque to IR radiation except for all but the thinest clouds. Thus, for a cloud of thickness T (units of meters), the upward emission comes almost exclusively from the cloud top, while the downward emission comes almost exclusively from the cloud bottom. Because of the lapse rate in atmospheric temperatures, that means the downward transmission will have a brightness temperature approximately T x 0.0065 K greater than the upward emission from the cloud top. As the upward arrow in the diagram is radiation to space, if there is high cloud overlying low cloud the difference in brigtness temperature of the upward emission will be a function of the altitude difference between the cloud top of the upper cloud and the cloud bottom of the lower cloud, multiplied by the lapse rate.
Atmosperic emission is not quite so clear cut, but in general, the thicker lower atmosphere results in a shorter free path length for downward emission than for upward emission. That means IR radiation emitted from the atmosphere and reaching the surface comes from much closer to the ground than IR radiation emitted from the atmosphere and reaching space. Dragging numbers at random from a diagram while ignoring context (such as the arrows) does not change this. Invoking an unphysical theory to "explain" a discrepancy that only exists because you have completely, and bizarrely, misread the graph does not change it either.
-
john warner at 00:38 AM on 13 December 2016There's no correlation between CO2 and temperature
Correction: john warner @ 142
101325 Pa = 287.052 Pam3/kgoK * 1.25203 kg/m3 * 281.93oK.
-
MA Rodger at 22:04 PM on 12 December 2016There's no correlation between CO2 and temperature
john warner @142.
There are monumental flaws in the argument you present but I will confine myself to just the one monumental flaw. It is true that there is a phenomenon known as Gravitational Compression. The act of compressing a gas does heat the gas (as anybody who has pumped up a bicycle type by hand would have noted). But when the compression stops so does the warming and the elevated temperatures experience cooling (as my bicycle pump plainly shows). So what compression is happening in the Earth's atmosphere? There is none. The Earth's atmosphere has not been compressing for eons.
With deference to the Moderator Response @142, I will not suggest that you are delusional in you belief that you have mastered the understanding required to allow a person to wield the equations that you employ. Rather I will humbly suggest that you are a tad out of your depth here.
Moderator Response:[JH] The deleted paragraph is a blatant "ad hominem" attack which is prohibited by the SkS Comments Policy.
You know better than that.
Please take the time to review the policy and ensure future comments are in full compliance with it. Thanks for your understanding and compliance in this matter.
-
john warner at 20:11 PM on 12 December 2016There's no correlation between CO2 and temperature
Google 1976 US Standard Atmosphere Calculator, Digital Dutch and the Stefan-Boltzmann Law Calculator. From the Earth Energy Budget emitted by atmosphere is 169.9wpsm and emitted by clouds is 29.9wpsm. They add up to 199.8wpsm. Entering 199.8 for P yields 243.64oK. Now enter 5,891 meters for altitude and -6.22oK into the Standard Atmosphere Calculator. T=243.638oK Subtract 243.638oK from 281.93oK. Where did thes extra 38.292oK come from? Gravity. The 12 tons of air over the air at the surface increased the Pressure and Density. According to the Ideal Gas Law Pressure and Density determine Temperature according to the following formula. P=CDT Where C is the Gas Law Constant. At 0.0 meters altitude the Ideal Gas Law Calculates:
101325 Pa = 287.052 Pam3/kgoK * 1.25203 kg/m3 * 281.930oK.
How much did the Gravity induced increase in Temperature increase the the radiation emitted by the surface temperature? 154.8wpsm. 199.8wpsm +158.4wpsm=358.2wpsm. -
Tom Curtis at 17:05 PM on 12 December 20162016 SkS Weekly Climate Change & Global Warming Digest #50
Courtesy of my son on facebook:

-
RedBaron at 17:01 PM on 12 December 20162016 SkS Weekly Climate Change & Global Warming Digest #50
One Planet Only Forever,
You said, "a subjective opinion can be whatever anyone wants to believe. But as soon as there is any objective basis for the 'opinion' the freedom to beleive what you want is gone and you must participate in the legitimate discussion or argument, accept the objective evidence, and be willing to change your mind if your opinion cannot be objectively and rationally justified."
This is quoteworthy material. I happen to collect pithy quotes. To whom should I attribute this? One Planet Only Forever? Patrick Stokes?
-
One Planet Only Forever at 16:04 PM on 12 December 20162016 SkS Weekly Climate Change & Global Warming Digest #50
CBC Radio show "The 180" recently included a discussion with Australian philosopher Patrick Stokes with the common sense but currently very provocative title "Actually, you're not entitled to your opinion".
My brief summary is that a subjective opinion can be whatever anyone wants to believe. But as soon as there is any objective basis for the 'opinion' the freedom to beleive what you want is gone and you must participate in the legitimate discussion or argument, accept the objective evidence, and be willing to change your mind if your opinion cannot be objectively and rationally justified.
A key point made is "What it comes down to is that for these kinds of discussions to work, you need to have agreement on what counts as evidence and what counts as success and failure and increasingly we don't even have that." I ama firm believe that the guiding priciple for what counts must be the objective of 'advancing humanity to a lasting better future for all'. Others may argue that fuller freedom of everyone to pursue pleasure, popularity and profitability will achieve that objective. I demand proof of their claim, and what is happening regarding climate science is some of the strongest evidence to date disproving their desired opinion.
In addition to the 'reasons people do not accept that their opinion is not correct' that are presented in the interview, I am a firm believer (and believe there is ample evidence to support my opinion) that resistance to accepting climate science is largely due to the required related understood loss of opportunity for personal benefit.
Accepting climate science actually requires acceptance that many developed perceptions of economic prosperity and opportunity are actually unjustifiable. Especially perceptions of prosperity that were maintained or increased through the past 30 years by the continued and increased burning of fossil fuels. That continued pursuit of benefit occurred as it was becoming better understood that that way of benefiting had to be rapidly curtailed for the benefit of the future of humanity, contrary to popular preferred opinions among the wealthiest and already more fortunate humans (opinions that less fortunate humans may even be tempted to prefer to believe).
-
Art Vandelay at 10:24 AM on 12 December 2016Report helps scientists communicate how global warming is worsening natural disasters
Whether climate change is or isn't a significant threat, there are great benefits to be had from transitioning to renewable energy.
A world where air quality is high and where most countries can be self-sufficient sounds pretty good to me.
-
hig314 at 08:32 AM on 12 December 2016Skeptical Science at AGU 2016
I'll be there, and would love to talk about Alaska's role in the climate conversation. I'll see if I can catch John or Sarah at their posters. I'm interested in seeing climate mitigation become more a part of Alaska politics. I'm interested in the whole range from specific climate science (my poster, EP41A-0900, is related to landslide tsunamis following deglaciation), to adventure narrative as a means of conveying climate science, to climate advocacy.
-
michael sweet at 01:29 AM on 12 December 2016There's no correlation between CO2 and temperature
John Warner,
Your claim at 139 that "increase in radiative forcing of the surface air by the 12 tons of air above every square meter 158.4 W/m2." is unphysical. The air pressure on the surface is a static force, while the radiation of W/m2 is power. A static force cannot emit power or it would be perpetual motion. You have made several other claims that are unphysical. Making claims that are unphysical are very basic errors that demonstrate you have not mastered of the basic concepts of AGW. It appears from your posting that you have developed your own description of AGW that does not match what professional scientists have developed. What is your background that you are qualified to develop a new area of science?
If you want to convince others here that your ideas have merit I suggest that you start out asking questions about what you think are errors in AGW theory. Discuss only one simple concept at a time to reduce confusion. By discussing the basics you will be able to eliminate the errors that are rife in your posts here. Expounding on your own ideas will not convince others while basic physical errors, like describing a static force as emitting power, are present.
As an alternative you could post your material at WUWT where most of the readers do not understand the science and will lap up your ideas.
Tom Curtis,
I am amazed at your patience on this thread.
Moderator Response:[JH] Please keep it civil.
[PS] Also please note, if you wish to change the discussion away from Co2/temperature correlation, then find an appropriate thread and comment there. Leave a comment on original thread indicating where new comment is (the date of top right of a posted comment is a suitable link). Offtopic comments are coming to get deleted.
-
Tom Curtis at 22:14 PM on 11 December 2016There's no correlation between CO2 and temperature
john warner @139:
1)
"If you do a runs test on carbon dioxide you get all positive changes from one data point to the next. If you do a runs test on changes in carbon dioxide you get a nice scatter of pluses and minuses."
The claim here is that, for each data point in a time series of CO2 concentration, the next data point is higher (all positive changes); but that the series x = CO2(i) - CO2(i-1) gives a variety of positive and negative values ("a nice scatter of pluses and minuses"). I hope I am not alone in seeing the straight forward contradiction in that claim. Perhaps john warner means to claim that ΔCO2 is always positive, while Δ(ΔCO2) provides a scatter of positive and negative values. If so, the point is irrelevant to autocorrelation, which is not a function of slope.
2) Here is the energy budget to which john warner refers:
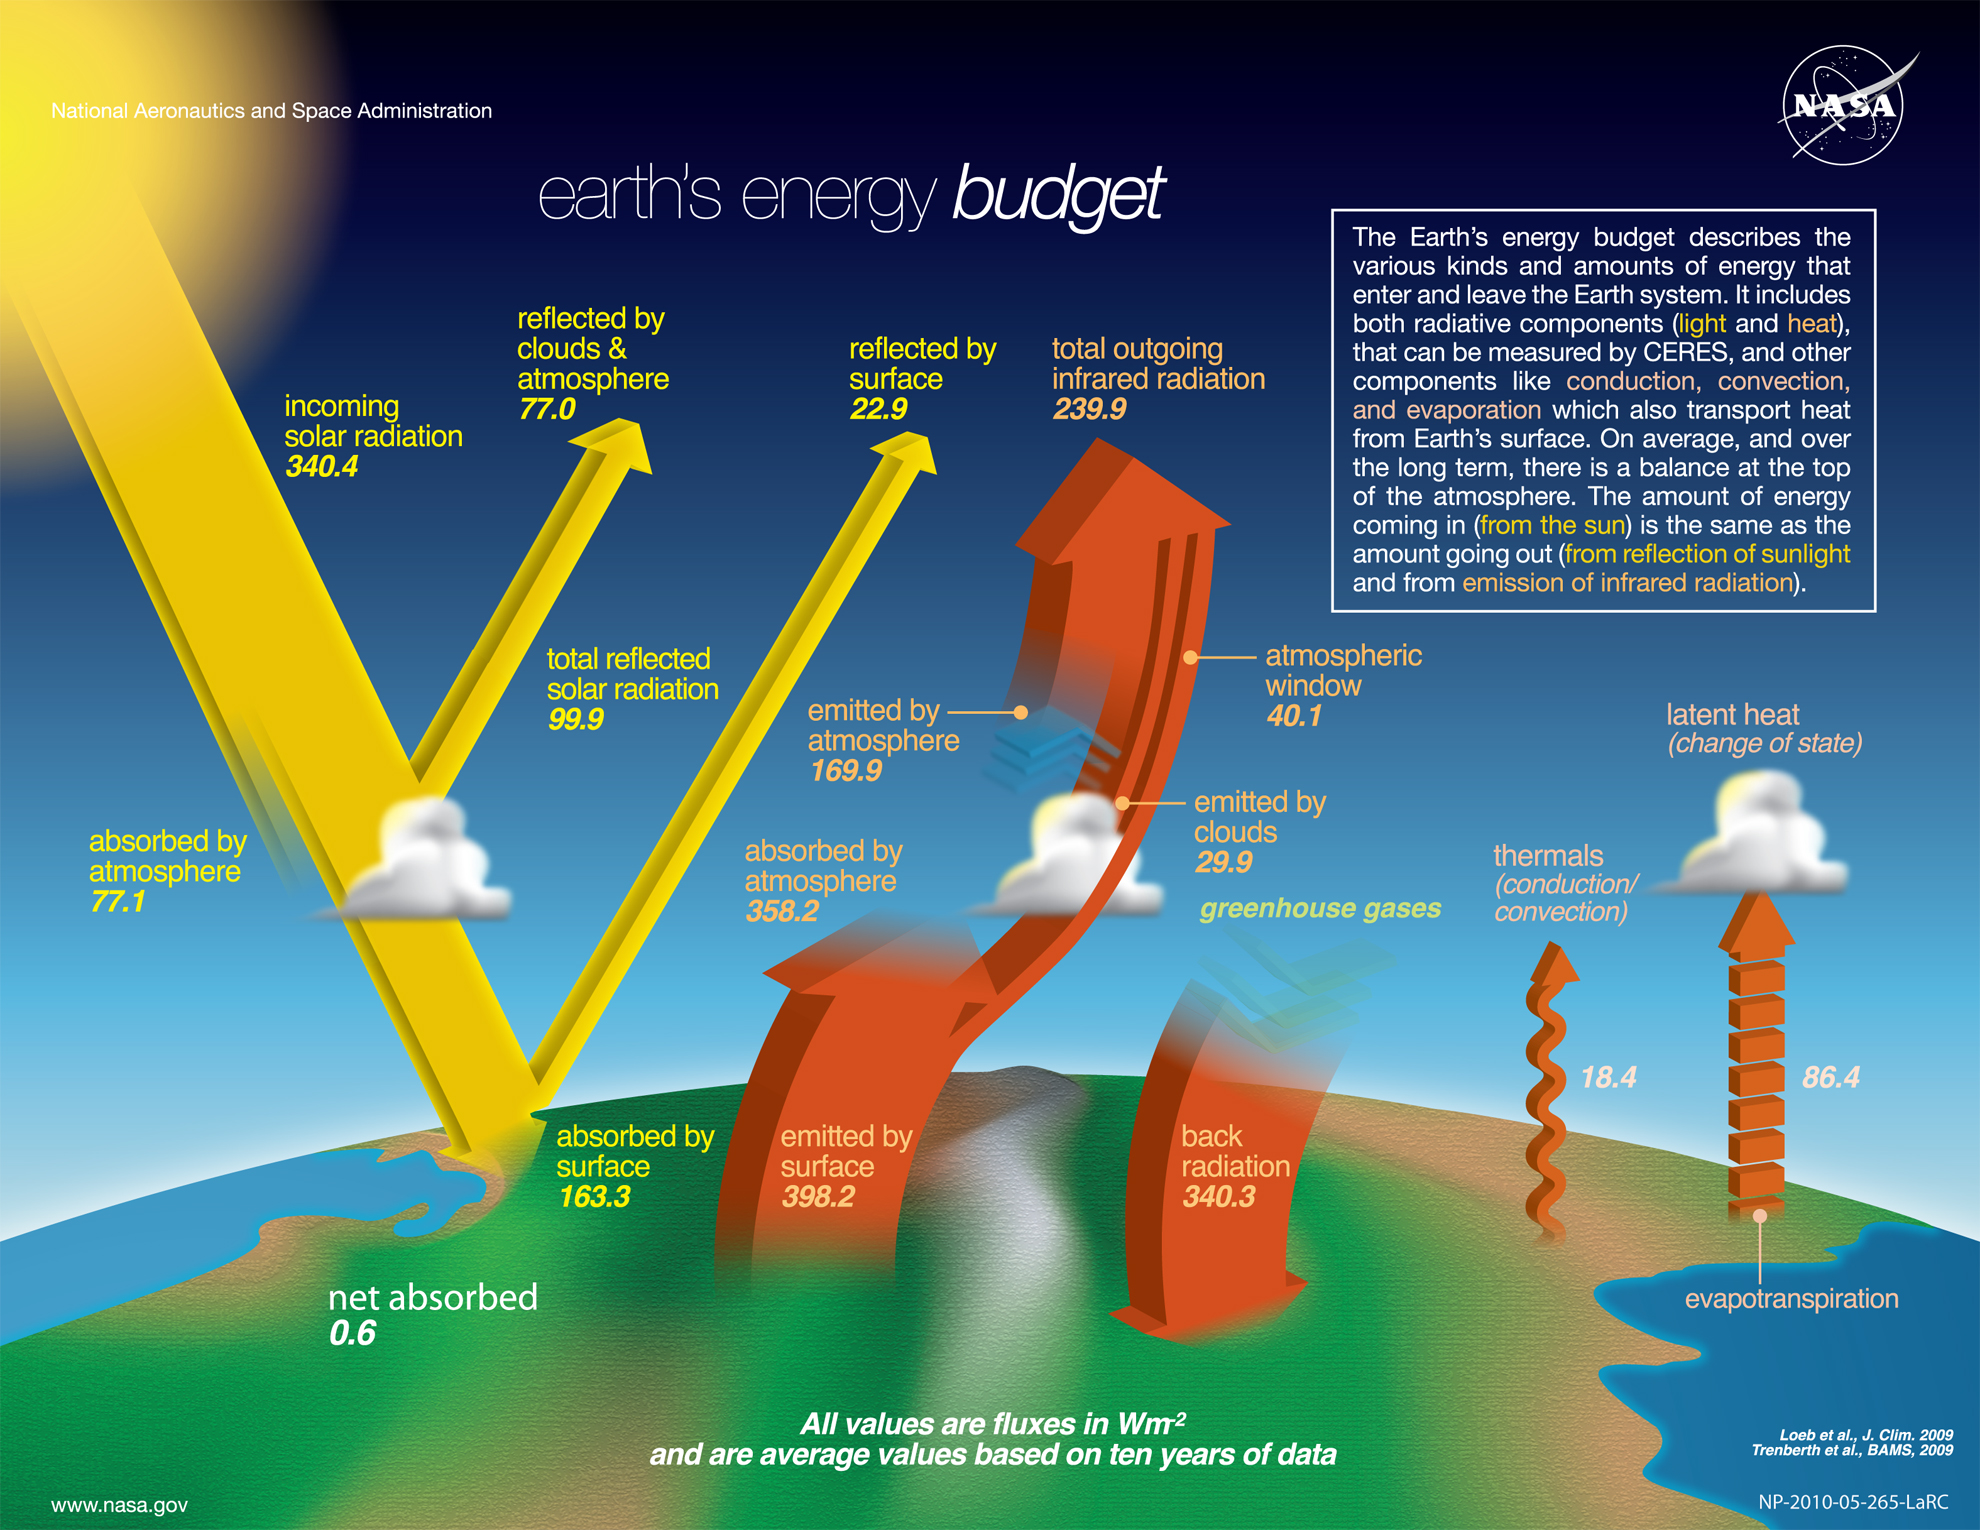
It is NASA's own estimate comparison of the peer reviewed estimates by Loeb et al, and Trenberth et al, (2009). Of this, john warner says, "The back radiation 340.3 has no corresponding physical scientific meaning" despite the back radiation being an observed quantity from many locations around the Earth.
The back radiation is IR radiation from greenhouse gases (including water vapour) and the cloud base. It's flux is less than that of the surface because it comes on average from a slightly higher altitude than the surface, and hence (because of the lapse rate) a slightly cooler layer than the surface. john warner's decomposition is a fiction.
3) With regard to the energy balance and GMST, because the energy flux is a function of the fourth power or temperature, the mean value of the energy flux does not directly correspond to the mean value of temperature unless the temperature at all points is identical. Trenberth, Fasullo and Khiel (2009) discuss this issue in the special section on "Spatial and temporal sampling" (page 315). Deriving the Global Mean Surface Temperature from the Stefan-Boltzmann Law and the known upward flux is, therefore, a basic mathematical error. Thus, if the Earth had two equal parts, each being isothermal, with the temperature of one being 283 K, and the other 295.6 K, for a mean temperature of 289.3, the net upward flux would average at 398.2 W/m^2. Using that to estimate surface temperature would yield a mean of 289.5 K. The variation in surface temperatures is much larger than the +/- 6 K used in my example, which accounts for the larger discrepancy found by john warner.
I should note that Trenberth et al derived their value from a reanalusis product (NRA), ie, a climate model run constrained to match observational data (ie, weather stations, among other sources). That is, he is using a result obtained premised on the accuracy of weather stations to "show" that the weather stations are inaccurate - while making a mathematical blunder in the process.
-
john warner at 19:51 PM on 11 December 2016There's no correlation between CO2 and temperature
MA Rodger @ 138 If you do a runs test on carbon dioxide you get all positive changes from one data point to the next. If you do a runs test on changes in carbon dioxide you get a nice scatter of pluses and minuses. Which proves Tom Curtis linear regression data is autocorrelated data. But I also explained that is the least of the problems with is carbon dioxide sensitivity coefficient.
It is not your fault that you misinterperted the earth energy budget. The presention is intentionally misleading. The back radiation 340.3 has no corresponding physical scientific meaning. It is composed of emmitted by atmosphere 169.9 W/m2, plus emitted by clouds 29.9 W/m2, minus greenhouse gases 17.9 W/m2, (not even shown) and the increase in radiative forcing of the surface air by the 12 tons of air above every square meter 158.4 W/m2. (169.9+29.9-17.9+158.4= 340.3). In 1992 I wrote a 42 page paper which my congressman circulated to the relevant commmitties and submitted into the congression record based upon the misleading presentation of absorbed by atmosphere that confused you. I didn't like being tricked into making a fool of myself. That is why I self-educated myself so I can't be fooled again. I am dedicating a lot of my time on Skepticel Science to help those who are making a good faith effort to understand the real science of global warming.
398.2 W/m2 is the radiation power per square meter of the earth surface. Using the Stefan-Boltzmann Law Equation the temperature of the earth surface is 289.48oK. 358.2 W/m2 is the radiation power per square meter of the earth air at the surface. The earth air temperature is 281.92oK at the surface. The difference is 7.56oK. This means that 40.1 W/m2 of the surface power is not absorbed by the air and radiated directly to space.
The CERES mission proves that weather station data is not accurate. If something as simple as his was not settled when AlGore won the noble prize maybe CAGW was not settled either.
The information contained in the earth energy budget is excellent, you just have to know how to draw inferences about the real world from the budget.
-
RedBaron at 22:57 PM on 10 December 2016From the eMail Bag: CO2 in the air and oceans
That's the problem Michael. Very little has been done on negative emissions scenario's. There is this: Simulating the Earth system response to negative emissions But it explicitly states that
It is vital to address these knowledge gaps in order to quantify the requirement for, and implications of negative emissions.
This is not my field. In fact there is no scientist on the planet that can fully have expertise in every field of climate science. It is too complex. I can add my knowlege you can add your and Tom can add his. Everybody from agricultural science to marine biologist, to physicists, mathematicians, economists, geologists etc etc.. Someone has to take the new information available regarding the LCP and add it to their specialty! I can't stop my research go back to school for 6 or 8 years to specialise on modeling a negative emissions scenario, then go back to my research again. The renassance man that knows everything in every field went extinct centuries ago. What you are asking me to do is unreasonable. Nor can Hansen be expected to know the cutting edge of agricultural sciences regarding the LCP. It just isn't reasonable on something this complex. Now I have many places here given case studies and published papers as references. And there are people with different fields of expertise going over them. Read #17 if you don't believe me.
But try as I might, I have yet to find the paper that modeled the scenaio where fossil fuel emissions drops to near zero AND worldwide agriculture changes are made sequestering 25 to 100 GtCO2/yr , what the outgassing of the oceans would be. It just isn't on any of the models on any published paper I can find. And I lack the expertise to publish a paper with than scenario myself.
-
michael sweet at 21:29 PM on 10 December 2016From the eMail Bag: CO2 in the air and oceans
Red Baron,
Good luck with your scheme. I hope that you can rebuild human agricultural methods across the entire world and that drought does not block your scheme. I will support your enterprise because I think better soil makes for better farming.
I note that you do not cite a single reference to support your claims in 31. Of the very few citations you have previously made most appear to me to be anecdotal or very small scale.
While you claim that large amounts of carbon can be sequestered, you have not addressed how much carbon has to be removed from the atmosphere. You do not account for where all the soil carbon that has been lost has gone. It stands to reason that you cannot sequester all the carbon released from soil and all the fossil carbon by your scheme. You state in 27 that you have no idea how much carbon the ocean will outgas. These issues have been studied and peer reviewed papers address these points. I think you underestimate the amount of carbon that has to be removed by a very large amount. Remember the denominator.
Everyone has their own standard of proof. While I hope you succeed, you have not met my standard. Based on the data I have seen you present, I doubt your claims.
Since I have also offered no data or proof I expect readers to treat my claims with caution. Look at the posts that Tom Curtis makes. He rarely makes a claim without a citation to show why he claims that. When he makes the same claim again he cites his reference again. To convince scientists you need to show that you are correct using data from peer reviewed sources.
-
RedBaron at 18:52 PM on 10 December 2016From the eMail Bag: CO2 in the air and oceans
Michael,
What you continue to ignore is the scale. If the nearly 1.5 billion ha of world cropland now under cultivation for crop production (and a significant % of the 2 billion ha of cropland that has been abandoned by humans since farming began due to soil degradation) were sequestering CO2 at 5 -20 tCO2/ha/yr via the LCP, that totals 7.5 to 30 GtCO2/yr cropland + whatever degraded abandoned land can be restored.
+ 3.5 billion ha agricultural grazing land = 17.5 to 70 Gt CO2/yr
So just those two categories alone we have a biological potential of 25 to 100 GtCO2/yr. And not for only a year or two. The source I already gave you states currently about 80% of the world’s agricultural land suffers moderate to severe degradation. So instead of the 6, 8, 10% SOC meters deep; we have 1, 2, 3% SOC centimeters deep. It will take decades to fully restore this land. That means at MINIMUM we can have 25–100 Gt CO2e pumping into the soil sink for decades before we even have to start worrying about feedbacks slowing us down. In fact no one really knows if it ever will slow down short of atmospheric CO2 getting so low and climate so cold it reduces the flow. All the inovators are claiming sequestration rates that continue to climb. Gabe Brown has one field up to 11%. That field actually sequesters faster now! It just keeps getting deeper. Coli Seis's best fields are up to sequestering 33t/ha/yr. No reduction in rate at all. Dr. Jones asks why would anyone think the LCP would ever slow down?The soil gets so healthy it kills off the AMF? Maybe so. But no one ever observed such a thing ever.
Total worldwide CO2 emissions from fossil fuels and cement combined was 36 Gt CO2 in 2014, but only about 20Gt actually adds to the atmosphere, because natural ecosystems and processes are at work mitigating this already.
Of course biological potential varies quite significantly from practical potential. Just training all the farmers how to do it would be a herculean task.
That's why I have consistently used far more conservative numbers. I get quite annoyed when I use ultra conservative numbers and get accused of exaggerating them instead, implication being this is some small thing that maybe might help just a little. You claim there is an immense amount of carbon that needs to be sequestered. I agree. However, the land surface of the planet under agriculture is immense! And the amount of carbon missing from our agricultural soils worldwide is immense.
I have been using 62-250% as my numbers. But as you can see I am being excruciatingly conservative. -
MA Rodger at 18:21 PM on 10 December 2016There's no correlation between CO2 and temperature
john warner @135 & @136.
It is good that you enjoy the challenge. Perhaps you can communicate to us your reasons for considering that "the earth’s average annual global surface air temperature" can be calculated in the manner presented @136. In particular, what possible relevance does an estimated 358.2W/sq m average radiative energy flux between surface & atmosphere have to establishing such a temperature. (I am conscious that this was described as being a rhetorical subject of discussion on the previous thread and this off-topic and that it remains so on this thread.)
And would you communicate your reasoning for suggesting @135 that your methods avoid the problems of autocorrelation as they patently do not.
-
MA Rodger at 18:08 PM on 10 December 2016There's no correlation between CO2 and temperature
Note concerning john warner @135 & @136.
These two comments are copies of comments first posted on this comment thread which is also where the referenced previous comments can be found.
-
michael sweet at 12:40 PM on 10 December 2016From the eMail Bag: CO2 in the air and oceans
Red Baroon,
We agree that increasing the carbon in the soil would be a good thing to do. We will have to see how much it helps reduce the carbon burden in the atmpsphere. Every little bit helps some! If it also increases soil productivity (which as a gardener it helps my soil a lot) that is great too.
-
Andy Skuce at 12:37 PM on 10 December 2016From the eMail Bag: CO2 in the air and oceans
Thanks, RB. Very good point about eroded carbon. Has anybody done any studies on the carbon content of recent lake/reservoir sediments downstream from farmed areas?
-
Rob Honeycutt at 10:27 AM on 10 December 2016Report helps scientists communicate how global warming is worsening natural disasters
Daniel Mocsny... You're rather oversimplifying by assigning everything to individual emissions. That's only looking at the demand side of the equation. The problem, I would suggest, is as much (or more) a function of supply. This is a systemic problem related to how we produce energy. If you say the solution is all about demand I think that's a dead end and doomed to failure. In a marketplace where nearly everything is produced using fossil fuel based energy, short of moving into a cave, consumers have little choice but to generate carbon emissions.
But as energy markets transition to sources that are free of carbon emissions, then consumers have real choices. They do have the ability to pick and choose and live full productive lives that are free of carbon emissions. Sadly, that only barely exists today.
The right things are happening. Wind and solar continue to fall in price as FF sources continue to rise. The renewables industry is growing faster than any other energy market segment. Electric cars are now popular in most markets.
What's disturbing to me is the potential for an autocratic President to derail such a positive revolution.
-
Daniel Mocsny at 09:56 AM on 10 December 2016Report helps scientists communicate how global warming is worsening natural disasters
"Rather, I mean “win” in that we have faithfully followed the scientific method, explored alternative hypotheses, checked and rechecked our work, and have come to a truth that is unassailable. We’ve done our job."
That would be the end of it if you're talking about a field of science such as astronomy that normally has almost no impact on any entrenched interests (individual lifestyles, organized religions, or large-scale industries). (Of course astronomy hasn't always stayed out of trouble - back in the 1600s Galileo found himself in conflict with the religious authorities when he failed to discover the required truth. Astronomers then were in the unfortunate position of today's climate scientists, having to debunk popular delusions, and suffering the predictable unpleasant backlash.)
Or that would be the end of it when scientists report only to narrow patron groups with stable and predictable reasoning processes, such as the military brass (for weapons research), venture capitalists, and so on.
Sadly for humanity's survival prospects, climate truth is readily assailable. It's getting more successfully assailed than any other field of science. Even a man with no scientific training can win the juiciest prize in politics - the US Presidency - by denying climate science. Donald Trump's falsehoods resonate deeply with (just enough) voters, which means climate truth is not only assailable, it's one of the softest targets out there. If climate truth were actually "unassailable," then denying it would immediately disqualify a person for high office. But the opposite is true now. The complex and abstract nature of the science, and the unwelcome implications for the American lifestyle, make the science eminently assailable. Especially in light of the audience having been preconditioned by years of right-wing attacks on science.
Climate science is nothing like many other less consequential areas of science. It's about as far-reaching as fighting World War II, but with a much longer commitment time. Total war requires near-total agreement from nearly every member of the general population. The climate scientist's job isn't done until there is nearly complete buy-in from the public. Merely convincing the tiny handful of fellow trained experts is just the first step out of base camp on the climb up Mount Everest. (Unless scientists don't care about what happens to humanity, and are merely interested in acquiring knowledge which will soon be lost when climate chaos ushers in a new dark age and life goes back to being nasty, brutish, and short.)
The difficulty is that humanity has an overall budget for "allowable" greenhouse gas emissions. (Picking a temperature target roughly fixes the maximum atmospheric concentration of greenhouse gases which in turn roughly fixes the total cumulative amount of durable greenhouse gases we can dump in the atmosphere.) Dividing the total by the global population (which is still growing by over 200,000/day) gives the remaining allowance per individual. Dividing that by the number of years until some target date when we expect humanity's net annual emissions to become zero (which doesn't even seem possible, but we have to assume it will be or we can just commit suicide now) gives the individual's annual emission allowance - and it comes to something less than 2 tonnes of CO2e/yr, about one tenth of the average American's emissions. This assumes we will have an equitable solution for climate change. If not - if some individuals are to be privileged, with a right to dump more greenhouse gas pollution than other individuals - then the high emitters need to justify their privilege somehow, and enforce it on the low emitters who aspire to become high emitters.
Naturally almost no one in the English-speaking world wants to frame the problem in terms of individual emissions (which is the only logically coherent framing, since the individual is unit of climate change causation, much as the individual heroin user is the unit of the heroin problem), because most native English speakers are among the world's top billion individual emitters. Even worse, the ruling class in almost every country consists of individuals from the top few centiles of greenhouse gas emissions for that country. The people who are talking to our high-emitting rulers are themselves mostly high emitters in proportion to their income level: scientists. It's hard to do cutting-edge science without burning plenty of jet fuel. A quick jaunt to one academic conference can gobble an individual's emission allowance for the whole year.
The inconvenient truth is inconvenient on more levels than even many people close to the issue want to confront. I think a good way to come to grips with it is to do the following:
- Using every available technology or technique, try to reduce your emissions to an honest individual fair share. For most people, this pretty much precludes flying, driving, heating, cooling, eating meat, owning meat-eating pets, or procreating. (If you can find a way to live on your carbon fair share while still doing some or all of those things, great - write a book so I can read it.)
- Once you have your emissions somewhat under control, find the climate science denier nearest you (you probably needn't go far - he'll still have a Trump sign up), and try to persuade him or her to repeat what you did in step 1.
- If that sounds too daunting, then pick what should be a slightly easier target: a Clinton voter who at least verbally acknowledges scientific reality, but continues to behave as if climate science is bunk (by flying, driving, etc.). Try to talk the person who should know better into behaving as if science is real.
If we can't even persuade one individual, then we're not nearly ready to try persuading the entire public. You'll find with one individual that you need to identify and destroy multiple onion-peel layers of disinformation he or she has absorbed or self-constructed. There's no way to correct all that damage with just a drive-by public service announcement. It takes lengthy one-on-one commitment and relationship building.
-
RedBaron at 09:53 AM on 10 December 2016From the eMail Bag: CO2 in the air and oceans
I agree Michael The ocean is the unknown to me. All I have claimed ever is that we can sequester into the soil many times more than all the biomass and atmospheric carbon combined based on the fact that since human impact many times more was lost. Currently right now world wide we lose so much soil there is more abandoned cropland than arable cropland. I could go on and on but this explains it better. Soil Erosion Threatens Food Production
So honestly there is a strong case for rebuilding soil rapidly like the new research in the LCP allows us to do, whether or not it changes AGW or not. But the numbers are larger that all the other climate scientists mitigation proposals combined. More than zero carbon emissions, more than CCS, more than all of them. So either every CO2 mitigation plan ever made is completely useless and nothing will work, or this will work. Simple as that. I don't know if it is large enough to capture all the outgassing of the ocean. But if it can't, then nothing can in under millions of years and nothing we do including 0 emissions has any chances of reversing AGW. I don't believe that any more than I believe AGW denialism. The only difference being 1 denies we did it, and the other denies we can fix it. But both are in complete denial of human impact on the biosphere, whether positive or negative.
-
nigelj at 09:36 AM on 10 December 2016Report helps scientists communicate how global warming is worsening natural disasters
Jonbo @69, I dont have any in depth list in my head of research on extreme weather, as I just take a general interest in climate change. However I came across this media article a while ago which discusses quite specific storms and and floods in Britain and evidence linking them to climate change. It's a good overview style of article, but with links to several specific published papers which may interest you.
energydesk.greenpeace.org/2016/01/04/uk-flooding-climate-change/
Much of the weather research papers appear to be on certain trends in certain countries and finds some things changing and some not changing or even getting less severe. Its so hard to make sense of this as an individual and one or two papers on specific events dont give the full picture.
However James Hansen did an overview of global extreme weather by looking at a large number of events and countries, and concluded its getting more extreme. Im pretty sure thats the paper quoted above. This is probably as near as you would get to a definitive single paper.
I think we have to trust the IPCC as well. They review all the research to see what it adds up to as a global trend overall, and have broadly concluded certain things are getting worse globally (including heat waves and heavy rain events) and its too soon to be certain about others like hurricane activity. Their summary for policy makes is online. Its hard for an individual to do such a big review, so I have to put my faith in the team of experts who serve on the IPCC.
And you will get a lot of regional variation. Some weather may get less extreme in some places because of regional factors, and this is ripe for cherry picking by climate sceptics. I'm interested in the big global picture, and it does seem certain weather is generally becoming more extreme overall.
In comparison the skeptical study you mentioned seems to have an agenda. The author listed too few cases to be able to draw conclusions. We know not all weather events will get more extreme everywhere so its complicated, therefore you have to look at a very wide selection of events and regions before drawing a conclusion.
The author also made claims about temperature trends my country of New Zealand which I strongly dispute and I have local knowledge of the issues he raised.
-
michael sweet at 08:48 AM on 10 December 2016From the eMail Bag: CO2 in the air and oceans
Red Baron,
James Hansen has discussed ocean outgassing of CO2 once emissions become low enough that the ocean has more CO2 than the air. Look for articles on geoengineering that remove CO2 from the air. As I recall (sorry no link but you rarely link), the top 1000 meters of the ocean starts to emit CO2 quickly after CO2 in the atmosphere starts to drop and will be a very large amount of carbon dioxide compared to the amounts you are talking about sequestering in the soil. The ocean contains much more carbon than the atmosphere.
You need to provide data and/or links to support your claims that soil can sequester the amount of CO2 that will come out of the ocean. The immense amount of carbon that needs to be sequestered is the problem for any geoengineering scheme that proposes to remove carbon from the air. Most of the carbon that has been emitted would eventually have to be removed, natural sequestration processes are very slow on a human timescale. You do not appear to have determined the amount of carbon that your scheme needs to address.
At the same time the deep ocean absorbs some CO2. Depending on the exact amounts of emissions, sequestering and time frame the distribution of CO2 is different. Evaluating the issue is complex. One issue with soil sequestration is that if there was a change in soil use, say there was a severe drought or war, that can release the carbon sequestered in the soil.
Any sequestering of CO2 is a good thing and increased carbon in the soil increases productivity. I see little downside or risk to increasing soil carbon. I have not seen here data that I think supports your claims that enough CO2 can be sequestered in the soil to substantially lower temperatures. The amount you claim can be removed has to be compared to the amount that needs to be removed. The latter has not been addressed.
When you say you do not know how much CO2 can potentially come out of the ocean it appears that you need to do more background research to support your very strong claims. The amount of CO2 involved is potentially many times more than is currently in the atmosphere.
-
Jonbo69 at 08:26 AM on 10 December 2016Report helps scientists communicate how global warming is worsening natural disasters
#Daniel
Many thanks
-
Daniel Mocsny at 08:13 AM on 10 December 2016Report helps scientists communicate how global warming is worsening natural disasters
Jonbo69 - also see:
Hansen, James, Makiko Sato, and Reto Ruedy. "Perception of climate change." Proceedings of the National Academy of Sciences 109.37 (2012): E2415-E2423.
Google Scholar entry with links to the Open Access paper online
-
Daniel Mocsny at 08:07 AM on 10 December 2016Report helps scientists communicate how global warming is worsening natural disasters
Jonbo69: "are there any up-to-date papers on the subject of extreme weather...?"
How about a book:
Attribution of Extreme Weather Events in the Context of Climate Change by: Committee on Extreme Weather Events and Climate Change Attribution; Board on Atmospheric Sciences and Climate; Division on Earth and Life Studies; National Academies of Sciences, Engineering, and Medicine
National Academies Press | 200 pages | ISBN: 978-0-309-38094-2 | DOI: 10.17226/21852 | 2016NAP official book page - The PDF is free to download from NAP; or you can buy the dead tree edition.
-
RedBaron at 07:56 AM on 10 December 2016From the eMail Bag: CO2 in the air and oceans
Andy Skuce,
You said,
My question, and it's a real one, I don't know the answer: is it reasonable to assume that we could store more carbon in the biosphere—in a stable manner and securely for the long-term—than there was there prior to human interference?
We probably could. Maybe not. However, there probably is no need. This is the most common mistake made when I talk to climate scientists rather than farmers. Because your main focus is on the atmosphere you automatically equate loss of soil carbon as emissions. That is a portion of the loss yes. However, a far greater loss of carbon has resulted from erosion. That carbon did not all result in increases of atmospheric CO2, but rather most is currently sitting on the bottom of our waterways, lakes and oceans.
So we have the counter-intuitive result that actually long before we restore our agricultural soils to historic levels prior to human interference, that excess CO2 in the atmosphere will be long gone.
That leaves us back to the nuance I mentioned before. The Oceans. They will likely become an emissions source under any atmospheric draw down scenario. But I have seen no studies that looked closely enough at that to actually quantify it, neither by rate, nor by total. There are a few that have done work on how much they absorbed, but not what they might cough back up. Those numbers shouldn't be assumed to be equal, as many processes sequester carbon long term in the oceans, and fossil releases like methane clathrates can happen too. So quite honestly I don't know and it boggles my mind to even make an educated guess.
I suspect that the excess atmospheric carbon combined with additional atmospheric carbon released from the ocean will not be enough to restore the carbon to historical levels in the soil, but it probably should be enough to at least get our soils healthy and stable again. However, that is not an educated guess, not even a wild guess, just a hunch and a promising new line of research for someone smarter and younger than me. I have spent years just trying to understand the atmosphere and soil; The oceans and seabed? Way out of my league. The little I do know from talking to marine biologists only made me realise I basically know nothing. It is that complex.
-
BilB at 06:33 AM on 10 December 2016From the eMail Bag: CO2 in the air and oceans
That is a great interview, Red Baron. So now what I see is yet another Australian great agricultural intellect attempting to educate farmers on how to improve their production with good knowledge and good practice.
Who knows, maybe Christine Jones will be the one who breaks through that tough farmer hide and actually get farmers changing their methods and understandings. The experience seems to be the same as talking global warming to tea party republicans. There has been an impressive procession of others ahead of her.
So as Fergus Brown says, get to it,...make it happen. It should, after all be a doddle to absorb all of Australia's emissions in the land. We do, afterall, have 30 Australian hectares per person, how hard can it be? Please let us know when it is done.
-
Andy Skuce at 06:22 AM on 10 December 2016From the eMail Bag: CO2 in the air and oceans
According to the 2015 Global Carbon Budget Report, cumulative land use emissions since 1750 from deforestation and soil deterioration amount to about 200 GtC. Presumably, the Holocene biosphere carbon stock was relatively stable prior to that (I know, Ruddiman argues for anthropogenic emissions before that, but they are not comparatively very big). If we are to stabilize the climate and don't bring fossil fuel emissions down to zero, we will need to sequester more than that.
My question, and it's a real one, I don't know the answer: is it reasonable to assume that we could store more carbon in the biosphere—in a stable manner and securely for the long-term—than there was there prior to human interference?
-
RedBaron at 04:20 AM on 10 December 2016From the eMail Bag: CO2 in the air and oceans
PS to the post above. I found a way to allow Dr. Jones explain it herself, much better than I have communicated it, in an interview.
Dr. Christine Jones Explains the Life-Giving
Link Between Carbon and Healthy Topsoil -
john warner at 03:11 AM on 10 December 2016There's no correlation between CO2 and temperature
To all between 26 and 33 two corrections: I used UAH Mid Troposphere. I think channel 4 was down in 1912 when I sent this to Dan Lashof at the Natural Resources Defense Council.
There is a typo I need corrected at line 16 for john warner @22 Change, did conform, to did not conform.
My source for the earth’s average annual global surface air temperature of 281.92oK, is NASA 2010 CERES Earth Energy Budget. Notice absorbed by atmosphere is 358.2wpsm. The Stefan-Boltzmann Law Calculator yields an average annual global surface air temperature of 281.92oK.https://science-edu.larc.nasa.gov/energy_budget/pdf/Energy_Budget_Litho_10year.pdf
I have enjoyed the challenge of communicating on Skeptical Science. I learned a lot.
-
john warner at 02:48 AM on 10 December 2016There's no correlation between CO2 and temperature
Nigelj @ 28 I appreciate the opportunity to explain the design of my linear regression.There are scientific concerns and statistical concerns. When there are known laws of physics you don’t have to use statistical analysis to generate coefficients for calculating the effect of carbon dioxide on air temperature. But in order to calculate the effect that air temperature has on the quantity of carbon dioxide in the air we do. We know that colder water absorbs carbon dioxide at a faster rate than hotter water. Assuming that water temperature and air temperature annually globally vary together we can model that if air temperature goes down the water temperature will go down also and absorb more carbon dioxide. If that assumption is wrong the regression coefficient will tell us with a change of sign. I assume that all of the gross increase in carbon dioxide emissions each year comes from humans burning fossil fuels and other organic material. Since more than average carbon dioxide is being absorbed we think the net growth in carbon dioxide left in the air will be decreased. On the other hand if the air temperature is higher than normal we assume that the water temperature will be higher and that less carbon dioxide will be absorbed. Then the annual growth in carbon dioxide in the air will be larger. To be scientifically correct we have to model changes in the magnitude of the annual increase of carbon dioxide as a function of the air temperature. This makes carbon dioxide the dependent variable and air temperature the independent variable. If we use anomalies as the measure of temperature around the 1981 to 2010 baseline, on the graph of the regression results 0.0 on the x axis will also represent when the anomaly is 0.0. The statistical consideration is that when dealing with time series data and the quantities are autocorrelated the scatter of plots is not a random sample. This problem was avoided by modeling dC for carbon dioxide and anomalies for temperature. Also when it is obvious the variables are correlated with a third variable time you have a multicolinearity problem. Modeling dC and T anomalies avoids this problem also. If you graph the regression, the sloping line wii intersect the y axis at 1.7. This means when the anomaly is 0.0oK the carbon dioxide growth is 1.7ppm/yr. If the temperature anomaly is higher the carbon dioxide growth rate is higher. If the temperature is lower the growth rate is lower. 58% of the variation in the growth rate per year of carbon dioxide is explained by the earth’s air temperature. Between 1979 and 2011 the mean growth was 1.7ppm per year. The regression coefficient says if the air temperature goes up 1.0oK the growth rate of carbon dioxide will go up 1.94ppm/yr for a total of 3.64ppm/yr.
I took time away from my mission because I wanted to prove that I know my science by evaluating Tom Curtis’s carbon dioxide sensitivity coefficient linear regression. I want to tie things up on this subject. Tom Curtis said the GMST is a proxy for air temperature. 70% of GMST temperatures are ship log sea surface temperature. We already know ocean temperature is the primary determinant of carbon dioxide absorption. From a practical point the variation in the data for Tom’s dependent variable comes from the world’s sea surface temperatures. On the independent variable, carbon dioxide radiative forcing is a close derivative of the change in carbon dioxide per year. In essence, regardless of the labels he put on the variables he was regressing sea surface temperatures against the change in carbon dioxide per year. The order of causation is wrong but the attained R2 is the same.
-
RedBaron at 02:45 AM on 10 December 2016From the eMail Bag: CO2 in the air and oceans
BilB,
About 22.3 million hectares are planted annually to commercial grain crops across Australia.[1] At the rate Ms Jones measured in her pasture cropping case studies of 5-20 tCO2/ha/yr that equates to between 111.5 to 446 Mt CO2/yr. Australia emitted 549.3 Mt CO2 in 2014. So just pasture cropping alone could offset between 20% and 80% of Australia's CO2 emissions before we even begin to discuss other agricultural areas. That land was already cleared long ago, and the soils already degraded long ago.
As for the rest of your post regarding livestock grazing alone, a far larger land area, what are you refering to? Livestock? or properly managed livestock?
@Fergus Brown,
You asked "where does this lead us?". I have made a rough white paper on another thread here: That's just my idea. I highly suspect there are others who could flesh it out better, or suggest other ways forward.
-
sailingfree at 02:15 AM on 10 December 2016Models are unreliable
Spencer now shows Cornbelt data, and "42 CMIP5 models.
http://www.drroyspencer.com/wp-content/uploads/Corn-belt-temp-JJA-thru-2016-vs-42-CMIP5-models-1.jpg
He implies that the CMIP5 projections are for the cornbelt.
Is this true?
(In my local newspaper I clash with Joe D'Aleo's misiformation, can use help.)
-
bcpierce14059 at 01:56 AM on 10 December 2016Report helps scientists communicate how global warming is worsening natural disasters
Related to the previous question: The paper cites "Two separate studies [that] found that the 2013 extreme heat in Australia would have been virtually impossible without human-caused climate change." Is there a good compendium of other very high confidence associations like this?
-
Jonbo69 at 00:48 AM on 10 December 2016Report helps scientists communicate how global warming is worsening natural disasters
nigelj
Thanks. I ended up doing a bit more research anyway and found the journal the paper was published in to be extremely dodgy, plus i took a closer looke at the references which included A. Watt, Roger Peike Junior, the GWPF etc. That aside, are there any up-to-date papers on the subject of extreme weather that are worth referencing?
-
Fergus Brown at 22:06 PM on 9 December 2016From the eMail Bag: CO2 in the air and oceans
RB, Excuse the density. In Lal, 2008 I see: "Strategies to increase the soil carbon pool include soil restoration and woodland regeneration, no-till farming, cover crops, nutrient management, manuring and sludge application, improved grazing, water conservation and harvesting, efficient irrigation, agroforestry practices, and growing energy crops on spare lands."
As you point out, all of these practices matter for the sake of the soil, but in terms of C sequestration WRT climate, they all amount to LULCC practices. So what is new? There doesn't seem to be anything controversial in any of the ideas proposed, but the mechanisms require actions which are already seen as being desirable, so where does this lead us?
-
BilB at 20:29 PM on 9 December 2016From the eMail Bag: CO2 in the air and oceans
Well, Red Baron, from my read of Christine Jones' article the humification process is fostered with, amoung other things, composted material. I don't doubt the science at all, some of this science is covered in a very interesting read "the hidden Life of Trees", what I do doubt is the scale and reliability of the process en masse. The soil works the way it works because that is what the conditions allow. Christine Jones makes the sweeping claim that 60% of Australia's land area is used for food production, but that is a flawed claim as most of that land area is sparcely utilised by livestock and in no way ever travelled over by humans let alone intensively farmed in the way to promote the soil changes proposed.
The other problem I have with this approach is that you only get to store carbon in this intensive farming way after you've cleared away the 100 to 640 carbon tonnes of bush land vegetation that was there in the first place, so improving the soil carbon is really a restorative process rather than the creation of new carbon storage capacity. Yes it is a good thing to do, but it is really two steps back for one step forward, and having decided to clear land for farming improving soil carbon sequestration in this way should be a high priority, for all of the reasons you have mentioned.
-
RedBaron at 17:35 PM on 9 December 2016From the eMail Bag: CO2 in the air and oceans
BilB,
Arbuscular mycorrhizal fungi (AMF) do not decompose compost. You are confused between AMF and Saprophytic fungi. So pretty much everything you wrote applies to something completely different. Furthermore, every example I gave in this and many other posts all went to this form of agriculture not to save the planet by sequestering carbon, but rather because they were backed into a corner and needed to find a more profitable way to farm or lose the farm. Every one. So that part of your analysis is completely wrong too. In fact the reason it is catching on and spreading so rapidly is that soil degradation is a more emmediate threat for many farmers than AGW. Turns out that there is more carbon missing from our soils than extra in the atmosphere. But your analysis is completely backwards because you don't understand the soil or the carbon cycle in the soil.
-
BilB at 15:16 PM on 9 December 2016From the eMail Bag: CO2 in the air and oceans
RedBaron
The first problem with the soil carbon theory is that It requires an intensity of effort and a quantity of compostible biomass far greater than that available in our dry land.
The second problem is that it is sequestering carbon, as also does the ocean cycle, in a way that makes this carbon permanently unavailable for human civilization to use in the future hundreds and thousands of years.
We are so hooked on the notion that there is abundant carbon and forever, not true. The Earth has been bleeding carbon off into space for billions of years, and it was only by chance that algal life set to work capturing carbon from the primative atmosphere and sequestering it in the form of coal, oil gas, and clathrates, forms of concentrated carbon that can be collected fairly easily by civilization. All along the way atmospheric CO2 has been reducing due to the bleed off and dispersion throughout the Earth's surface to the point where it is a trace gas at a level that still sustains life. Atmospheric CO2 in the natural cycle is topped up from the plate techtonic volcanic cycle as subducting plates boil off CO2 as rock moves into the mantle so we are not going to run out of atmospheric CO2 any time soon, but what we are at risk of running out of is readily available condensed Carbon, Carbon which our civilization would not function without, and I am not referring to carbon as fuel here.
So while you are wishing away our Carbon into the soil and oceans so that inefficient fossil fuel entrepreneurs can be rich for a century more be aware that at the end of the road there is neither enough carbon to build our technology, nor the carbon as fuel to process it.
I am 100% certain that the notion that "soil sequestration can absorb Australia's CO2 emissions" will not stand up to quantified scrutiny. It is a total false assumption that farmers who operate on a commercial razors edge will somehow have the extra resource to collect all of their biomass, compost it, and disperse it over any significant percentage of Australian lands under appropriate conditions in order to promote the growth of different soil fungi with subsequent CO2 sequestration. Most of Australia's land does not produce enough biomass to even begin to activate such a plan. The only thing I agree with you on, is that methane form cows is a bloated argument in my opinion.
The only poath forward for our civilisation is to agressively develop and implement sustainable and renewable technologies in order to reduce the rate of extraction of fossil carbon to both reduce atmospheric CO2, and preserve as much readily available carbon for the continuity of our civilisation.
Every single Australian is currently consuming a continuous 7 kilowatts of energy 24/7/365. That is a staggering energy consumption and all of that comes from fossil fuels. That is the equivalent of burning .75 litres of petrol every hour continuously. And that does not include the energy content of the goods Australia imports.
Prev 460 461 462 463 464 465 466 467 468 469 470 471 472 473 474 475 Next


