


 Arguments


Recent Comments
Prev 464 465 466 467 468 469 470 471 472 473 474 475 476 477 478 479 Next
Comments 23551 to 23600:
-
Tom Curtis at 08:10 AM on 25 June 2016Venus doesn't have a runaway greenhouse effect
HK @186:
1) Again I refer you to the claim I was actually criticizing, ie, that "a majority of upwelling wavelengths of IR" were transparent to, or largely transparent to IR radiation. For a wavelength to fall into that category, and therefore be a relevant wavelength for assessing the claim, it is sufficient that it be a wavelength that emits IR radiation from the surface. However, while the 3-5 micron band is only responsible for % of all radiation from a source at 288 K, the 8-13 micron window that Mike Hillis would have us focus on is only responsible for 9.9%. That compares to 3.8% for the 4-8 micron band, and 9% for the 13-20 micron bands he would have us ignore. Even that comparison falsely favours his case in that he treats the 9.2-10 micron band, heavilly absorbed by O3 and accounting for 1.7% of emmissions at 288 K, as being essentially transparent.
The simply fact is that no matter what end limit I used, the total irradiance from that wavelength is trivial if you concentrate on just that wavelenght. Thus total emission from 7.6-8.6 microns (chosen because it brackets the wavelength of peak emission) represents just 1.8% of total emissions, and hence can be considered trivial. Had he focused just on the low emissions at 4 microns, he would have been cherry picking the edge of a broad band specified (4-20 microns). Of course, he did not even do that, but wrongly claimed zero emissions at 4 microns.
So, in short, he attempted to distract from rather than properly address my criticism by focusing on an edge value rather than the full band, pretended his claim was other than it actually was, and still got the facts wrong. I would say that qualifies as "very wrong", though those were not my words.
2) The point in your final paragraph is a very good one. There is reason earth bound IR telesopes are located at the top of tall mountains, or flown in balloons or planes (something not commented on by deniers when they trot out the "atmospheric window". The impact of water vapour at low levels in that window can be seen from this spectrum of downwelling IR radiation from Nauru, compared to that from Barrow Alaska, where cold weather has condensed most of the water vapour from the atmosphere:

-
HK at 05:28 AM on 25 June 2016Venus doesn't have a runaway greenhouse effect
Tom @183:
"Earth doesn't even emit 4 microns."I wouldn’t say that Mike’s claim is very wrong here. According to this blackbody calculator, a surface at 288 K emits only about 1 % of its total radiation at wavelengths between 3 and 5 µm, so I think it’s safe to say that absorption in that part of the spectrum is pretty insignificant for the greenhouse effect on Earth, though important on Venus.
Mike Hillis@178:
"....if you do not know that the atmosphere is almost 100% transparent or largely transparent to a majority of upwelling wavelengths of IR...."Let’s compare the IR flow from the surface to that escaping to space in the chart posted by Bob Loblaw in @167.
A simple calculation shows at the latter (239 W/m2) is about 60 % of the former (396 W/m2), so by a simplistic glass greenhouse analogy one could claim that 60 % of the "roof" is open. That’s wrong because the atmospheric greenhouse effect both absorbs and reemits in accordance with the local temperature. As a result, the heat loss to space isn’t reduced to zero in any part of the IR spectrum. Consequently, you could have 100 % absorption in the entire spectrum and still have a more or less "open" greenhouse roof because the altitude of heat loss is just as important as the optical depth of the atmosphere. So, claiming that the atmosphere is largely or almost 100 % transparent to a majority of upwelling IR when the heat loss to space is reduced by 40 % is definitely wrong!
Imagine an Earth with present day surface temperature (288 K) and lapse rate (6.5 K/km) with 100 % cloud cover, the cloud tops 1 km above the surface and no greenhouse gases above them. That atmosphere would be virtually 100 % opaque to IR from the surface, but would that create a strong greenhouse effect? No, because the outgoing IR would only be reduced by 40 W/m2, not 157 W/m2 as in the chart in @167.
Regarding the 8 to 13 µm range, water vapour does absorb some radiation in that part of the spectrum, but pretty weakly. The absorption spectrum of water vapour is quit "messy", with a broad band from about 5 to 8 µm, and lots of very narrow, more or less widely spaced bands after that. The peaks of these narrow bands are at their lowest near 10 µm, but get progressively higher with longer wavelengths. So, much of the radiation escaping to space in the 8 to 13 µm range originates from low level water vapour (and stratospheric ozone), but since this water vapour isn’t much colder than the surface, it has a very minor impact on the greenhouse effect. -
rocketeer at 05:01 AM on 25 June 2016A brief history of fossil-fuelled climate denial
I thought one of the intersting aspects of the article I posted was the defensive tone of the author. Whe he states that "the fears of those people who shudder at the " greatly " increased carbon dioxide content of the air which is produced by modern industrial activity, are unfounded" it is news to me that anyone of that era was shuddering wiht fear about the increase in CO2. Arrhenius in 1906 and Callendar in 1938 both advocated that the climatic changes form CO2 would be a good thing because it would forestall "the return of the deadly glaciers" and improve agriculture in northern regions.
Does anyone have any information on what concerns scientists might have had about global warming in the 1930s? My impression was that very few people (other than Guy Callendar) were even paying attention to Arrhenius' theory at that time and I wasn't aware that anyone considered it a problem.
-
One Planet Only Forever at 03:22 AM on 25 June 2016A brief history of fossil-fuelled climate denial
Tom Curtis@13,
Thank you for the clarification. My return clarification is that the article was a piece of marketing, not a scientific presentation. The choice of referring to percent increase combined with the term infinitesimal was almost certainly deliberately chosen to diminish the concern regarding the burning of fossil fuels.
Many readers then and today would be likely to interpret 'percentage increase' as referring to a ratio of change. That is what a deliberately misleading marketer would do, then and today. Which ties to the end of my comment @12.
This will be my final clarification regarding this point.
-
alexasilock at 01:38 AM on 25 June 2016The Scientific Guide to Global Warming Skepticism
I would be happy to assist in the translation of this guide in Greek. Please notify me, if you are interested.
-
Tom Curtis at 01:26 AM on 25 June 2016Venus doesn't have a runaway greenhouse effect
MA Rodger @184, thanks. Very interesting.
-
MA Rodger at 01:06 AM on 25 June 2016Venus doesn't have a runaway greenhouse effect
Tom Curtis @183,
The usual graphic of the Earth's radiative balance (presented in-thread here @167) suggests that the surface IR emissions to space represent 12% of the total IR at 40wm^-2. Mind, Costa & Shine (2012) point to this being a rather "ad hoc"value and model the clear sky value as being 66Wm^-2 and revise the true global average down from 40WM^-2 to 20Wm^-2 (+/-20%). They conclude "This indicates that less than one-tenth of the Outgoing Longwave Radiation originates directly from the surface."
If the words of Mike Hillis are taken as his position on this %OLR to space, @176 he tells us "The majority of upwelling IR is emitted to space by the surface itself with no absorption by greenhouse gases in the atmosphere" which is quite a staggering assertion. He is asserting the surface IR flux to space is in excess of 120Wm^-2 but presents no evidence in support. Rather we are treated to empty assertiveness.
-
Tom Curtis at 22:55 PM on 24 June 2016Venus doesn't have a runaway greenhouse effect
Mike Hillis @181, I quote you in full:
"As for the third paragraph, if you do not know that the atmosphere is almost 100% transparent or largely transparent to a majority of upwelling wavelengths of IR, most importantly the large band from 8 to 13 microns known to IR astronomers as the N band, which means they are not absorbed by any greenhouse gases at all and play no role in a greenhouse effect, then I would suggest you not enter scientific discussions on this level until you study the subject."
(My emphasis)
I have not challenged the claim that the majority of energy radiated from Earth to space comes from the surface because I do not know it is false. Nor do I know it to be true, though I do know it is irrelevant to the debate. But when you make the damn fool claim that the majority of IR wavelengths are "transparent or largely transparent", I challenged you because it was transparently false. Your response it to claim that you wrote something other than what you actually wrote. Do the decent thing and accept that you mispoke; or confirm that you are deceitful as well as a fool.
And while we are on the topic of your being a fool, we have this prime example:
"Earth doesn't even emit 4 microns."
A fool not simply because you are wrong, but because you make this claim despite the evidence in the chart I showed, where the blue line is Earth's IR spectrum and the lowest wavelength of emissions is clearly seen to be less than 4 microns. But as you have demonstrated repeately on this thread, you never let evidence that would rebut your ideas enter your consciousness, so why would you start now.
-
Mike Hillis at 22:44 PM on 24 June 2016Venus doesn't have a runaway greenhouse effect
Glenn thanks for the link, I will revise my estimate of 30-40% up to somewhere around 50% for blackbody clouds, since some of the thinner clouds aren't.
-
Mike Hillis at 22:21 PM on 24 June 2016Venus doesn't have a runaway greenhouse effect
Tom @179
You site the N-band of 8-13 microns as being largely transparent to IR, ie, a total of 5 microns of the 0.7 - 1000 micron range of IR radiation. That is, it represents 0.5% of the IR spectrum. It is less than a third of the 4-20 micron range typically detected by satellite instruments. And that 8-13 micron range includes the absorption band of ozone,
This is the rambling of a non-scientist intending to deceive the readers. The entire 0.7 - 1000 micron range? Really? When we are talking about Earth's upwelling IR? And really, the 4 - 20 micron range detected by satellite instruments? Earth doesn't even emit 4 microns. And dividing up these absurd ranges of wavelengths as if the wavelengths all had equal amplitudes. Unbelievable. And claiming the 8-13 micron range, which presents a major chunk of Earth's Planck curve, and includes the peak wavelength according to Wein's law, is not really transparent because of the trivial 9.6 micron O3 absorption band? This sort of argument makes me want to quote a 1970's bumper sticker:
If you can't blind 'em with science, baffle them with BS
And a quote from your own post to me in this thread:
"Don't be a fool"
I'm done with you Tom. I'm not going to be reading any more of your comments from now on.
Moderator Response:[RH] You are going to have to address the points where Tom has shown you in clear error. You don't get to unilaterally abandon a line of discussion once you've been shown to be wrong.
-
Glenn Tamblyn at 19:10 PM on 24 June 2016Venus doesn't have a runaway greenhouse effect
Mike Hillis
From here "ASSESSMENT OF GLOBAL CLOUD DATA S E T S F RO M S AT E L L IT E S"One photo isn't exactly a global, time-integrated survey.
"Global total cloud amount (Fig. 1) is about 0.68 (±0.03) when considering clouds with optical depth > 0.1 (retrieval sensitivity of ISCCP during day, PATMOS-x, MODIS-ST, AIRS-LMD, HIRSNOAA, TOVS Path-B, and CALIPSO-GOCCP; cloud detection of MODIS-CE and MISR is slightly less sensitive over land). This value increases to about 0.73 when including subvisible cirrus (CALIPSO-ST) and decreases to about 0.56 for clouds with optical depth > 2 (POLDER). The optimal estimation method of ATSR-GRAPE leads to a slight underestimation (0.62), because only clouds with small uncertainty are reported (based on a single cloud layer model)."
-
Tom Curtis at 18:12 PM on 24 June 2016Venus doesn't have a runaway greenhouse effect
Mike Hillis @178:
1) Spectral cooling rate is a function of:
- The specific heat of the atmosphere at a given altitude;
- Atmospheric density at a given altitude;
- IR emissions from the given altitude at a given frequency;
- IR radiation from the other altitudes absorbed at a given frequency; and
- Shortwave radiation absorbed at a given frequency.
Changes in the spectral cooling rate can be due to changes to any of the above. For example, the warming trend (grey shades) at 1100 cm^-1 from approximatley 8 to 28 km are primarilly due to an increase in UV-A and UV-B penetrating to that altitude due to the reduced stratospheric ozone levels. Interpreting it as simply a function of IR emissions to space is wrong. Even the third bulleted factor specified above is not IR radiation to space, but IR radiation in any direction, including downward. When you treat the diagram as being only a function of that one value, and indeed, only of the IR radiation to space, you merely show your ignorance.
2) Allowing that you used the photo to show cloud cover, it only shows the cloud cover over a quarter of the Earth at one point of time. That is no basis from which to infer typical cloud cover. If you instead look to satellite surveys of cloud cover, you see that on average 66% of the Earth is covered by cloud, not 30-40% as you claim:

Even that does not tell you the level of the cloud. Because IR emissions are dependent on temperature, and temperature is a function of altitude, an IR spectrum over cloud cover can tell you the cloud height, and hence the level of emissions. In contrast, the intensity of reflected light tells you nothing about the temperature of the object from which it reflects, and therefore nothing about the altitude from which it is reflected without the use of trignometry to determine distance. Needless to say a single 2D photo does not include that information. Ergo, the photo does not tell you the altitude from which the IR radiation originated on any part of the picture. Now either you knew these facts, and were literally trying to decieve, or again your argument is based on massive ignorance.
3) You site the N-band of 8-13 microns as being largely transparent to IR, ie, a total of 5 microns of the 0.7 - 1000 micron range of IR radiation. That is, it represents 0.5% of the IR spectrum. It is less than a third of the 4-20 micron range typically detected by satellite instruments. And that 8-13 micron range includes the absorption band of ozone, in which the majority of radiation to space comes from the stratosphere. Your claim that "the atmosphere is almost 100% transparent or largely transparent to a majority of upwelling wavelengths of IR" is not even close:

All this, however, is beside the point. If an planet existed with an atmosphere that absorbed 100% of IR in a narrow band with no emission to space, it would mean 100% of IR radiation from that planet would be from the surface. The total IR to space from that planet would still result in less power radiated to space, given the surface temperature of the planet, than would be the case with no atmosphere. Given that total energy in from insolation must match total energy leaving the planet for a stable temperature to exist, that means the surface temperature of the planet must be higher than it would be with no atmosphere. In contrast, a planet with an atmosphere having the same pressure profile but absorbing no IR radiation would not cause the IR to space to be less than the total radiated from the surface, and therefore would not result in an increase in surface temperature at quasi equilibrium.
You have been so eager to accuse me of invincible ignorance that you have merely demonstrated your own.
-
Mike Hillis at 16:48 PM on 24 June 2016Venus doesn't have a runaway greenhouse effect
Tom @177,
In your first paragraph you claim that the spectral cooling rate at various altitudes does not show the altitude from which the radiation from various parts of the spectrum emits. Really? Because that is exactly what it shows, and as far as I can tell, it's the only thing it shows.
In your second paragraph, regarding my linked photo, "Earth from interlunar space," it shows cloud cover and is entirely relevant to the discussion I was having with Glenn because he exaggerated the extent of Earth's cloud cover. Nobody is using it as evidence of altitude of emissions, and you should not enter a conversation unless you take the time to understand what the 2 other parties are discussing. Clouds, being liquid droplets and not gas, are black bodies that block all wavelengths of upwelling IR and emit blackbody radiation from their tops. Being black bodies, the cloud tops can be regarded as new "surfaces" like the terestrial surface, and as such are entirely relevant in discussions of altitude of emissions, since cloud tops can be at various altitudes, although I was not representing them as such. I was only showing that cloud cover was 30 or 40 percent of the globe, not some larger amount as Glenn implied. And you should look up the word "literally" in a dictionary because you use it wrong.
As for the third paragraph, if you do not know that the atmosphere is almost 100% transparent or largely transparent to a majority of upwelling wavelengths of IR, most importantly the large band from 8 to 13 microns known to IR astronomers as the N band, which means they are not absorbed by any greenhouse gases at all and play no role in a greenhouse effect, then I would suggest you not enter scientific discussions on this level until you study the subject. I would like to quote you from another thread, in a comment you made to me recently, which by the way has no discernible meaning:
"Your strongest argument appears to be your invincible ignorance" (myth #142 comment @84)
-
SirCharles at 16:08 PM on 24 June 2016Analysis: Is the UK relying on ‘negative emissions’ to meet its climate targets?
Super.
Survivable IPCC projections are based on science fiction - the reality is much worse
Moderator Response:[RH] Adjusted width of video because it was breaking page formatting. Please keep images and videos under 500px.
-
Tom Curtis at 15:18 PM on 24 June 2016A brief history of fossil-fuelled climate denial
OPOF @12, my post @9 was indeed intended to be a response to that precise point. I apologise for not spelling it out sufficiently. Essentially, there are two conventions for specifying the change of concentration of a gas as a percentage. You can specify it as a percentage change relative to its initial value, or you can specify the change as a percentage of the total atmosphere. Normally in doing the later, we use units of parts per million, or part per billion for gases with low concentrations. That however, is only a matter of convenience to eliminate the number of non-significant figures that must be printed. A part per million is no different in principle to a part per hundred, ie, a per centum, or a percent. With that technical issue aside, there is no obvious reason why we should use one convention rather than another, that, for example, we should say CO2 concentrations have increased by 43% since the preindustrial rather than say thay have increased from 280 to 400 ppmv. To the extent that there is a reason to prefer one of the other, the later is preferable because it gives more information.
With that in mind, it was quite appropriate in your quoted text for the author to express the change as a percentage of the entire atmosphere. It contains no different information than if he had indicated a change from 300 to 320 ppmv; which given the data available and presented is a reasonable estimate.
If you had a point, therefore, it should not be that the author deemphasized the percentage change (he did not, given that he presented the initial and final values); but that by choosing units of "percent" rather than "per million" he emphasized the low concentration of CO2 as a whole in the atmosphere. I would still consider that an unjust criticism because, firstly, it is not clear that expressing the value as percent rather than a part per million has that effect (and it certainly doesn't to those familiar with arithmatic); and secondly, the author does not in the quoted section present the spurious argument that CO2 can have no impact because of its low absolute concentration.
Beyond that I refer you again to the last two paragraphs of my preceding post.
-
Tom Curtis at 15:03 PM on 24 June 2016Venus doesn't have a runaway greenhouse effect
Mike Hillis @175 and 176, the Clough diagram shows the spectral cooling rate induced by changes in atmospheric composition graphed by wave number and by altitude. It does not show where the radiation comes from. I have discussed it in greater detail here.
The linked photo, "Earth from interlunar space" shows visible light, only, and hence shows only reflected light, not thermal emessions. It is literally irrelevant as evidence regarding the altitude from which most radiation comes.
Finally, your argument @173 that the majority of radiation to space comes from the surface betrays a misunderstanding of how the greenhouse effect works. Specifically, the greenhouse effectg occurs because some radiation from the surface is absorbed in the atmosphere, with radiation from the absorbing layers to space being less intense than the surface radiation because the absorbing layers are cooler. If the radiation from the CO2 band were as intense as that from the surface, there would be no greenhouse effect, yet you appear to be pointing to the reduced intensity in that band as proof that there is no greenhouse effect. Rhetorically that is something like pointing to a satellite photo of the Earth to prove that the Earth is flat.
Consider your graph from 173:
A key feature of the graph is that the total area under the graph equals the radiation to space in W/m^2. Had the radiation in the CO2 absorption band been as intense as that from the surface, there would have been no greenhouse effect as noted. Because it is very much less intense, however, the surface radiation must be stronger to radiate the same amount of energy as would be radiated through an atmosphere with no greenhouse gases. Ergo, the surface must be warmer to radiate the same amount of energy. Hence the presence of greenhouse gases results in the surface being warmer when incoming solar and outgoing IR radiation approach equilibrium.
-
Mike Hillis at 14:06 PM on 24 June 2016Venus doesn't have a runaway greenhouse effect
Try again:

The above image shows that most radiation to space from Earth comes from the troposphere, usually the lower troposphere (dotted line is the tropopause), except for a small band absorbed by CO2. The majority of upwelling IR is emitted to space by the surface itself with no absorption by greenhouse gases in the atmosphere. The chart assumes a cloud-free sky, and in real life there are clouds, it is true, but in your above description of cloud cover you said:
"So with a reasonable proportion of the Earth cloud covered, on average, only a small percentage of surface radiation escapes directly from the surface."
This is an under-exaggeration. A cursory look at a photo of Earth from interlunar space
shows that cloud covers well less than 50% of Earth, probably closer to 30% or 40% using the one significant digit typical of these arguments.
Earth's atmosphere is a leaky greenhouse with half its panes of glass broken or missing.
-
One Planet Only Forever at 12:39 PM on 24 June 2016A brief history of fossil-fuelled climate denial
Tom Curtis@9
Your point is well presented, however my point was about the "...deliberate attempt to diminish or dismiss the implications of burning fossil fuels." which I am quite confident is the major motivation behind similar disinformation claim making we see today.
So your point does not diminish the relevance of the point I made, however its tenor (and the fact that it is prefaced as a response to my point), seem to imply it is a refutation of my point.
I will add, however, that unlike you I would consider 'the presentation of a legitimate worst case scenario to raise awareness of an issue of concern regarding the future of humanity that some people may prefer to ignore' to be more acceptable than 'deliberate attempts by people wanting to maximize their personal benefit and profit by making an issue appear less serious in the hopes of garnering popular support from people who are inclined to want to ignore or diminish the seriousness of the issue for their own personal reasons and interests'.
-
Mike Hillis at 11:30 AM on 24 June 2016Venus doesn't have a runaway greenhouse effect
Here's the famous Clough diagram showing the height of radiation of various bands. A major portion of the spectrum, from wave numbers 700 to 1300 waves/cm., are emitted from the surface. Plus a little more from 500 to 600. Come to think of it, it looks like Earth radiates from the surface in all but the tiny CO2 band from 600 to 700 and a little around ~300. Hmmmmm.
<Image data deleted>
Moderator Response:[PS] Not sure what is going on here. You cannot embed an image. It has to be hosted somewhere else online. Try again.
-
pjcarson2015 at 11:24 AM on 24 June 2016Climate scientists have warned us of coral bleaching for years. It's here
#28 John Hartz: The IPCC was started in 1988. I think concerns about bleaching emerged rather later than those about CC. That places bleaching concerns mid-1980s at earliest. Anyway, far later than 1965.
-
nigelj at 09:30 AM on 24 June 201697% global warming consensus paper surpasses half a million downloads
Well said. My understanding is we have about 6 studies which show between 90 - 100% of climate scientists say we are altering the climate. Regardless of what study one considers the best, its a huge majority of climate scientists in basic agreement.
There is not one study showing something substantially more controversial, like a 50 / 50 split. Climate sceptics have had decades and tens of millions of dollars from oil companies,etc, but have not come up with a study of climate scientists showing something like this. Surely that speaks for itself.
This is probably because they know it wont give the results they want. Indeed they may have tried, and found they didn't like the results, so chose not to publish. And they better understand they will be put under the same scrutiny they apply to the likes of John Cooke.
Therefore to me the debate on consensus is over. There's obviously a consensus. Can the sceptics please stop wasting everyone's time on this particular issue and move on. I don't know where they move on to, because recent high temperatures certainly dont help them.
-
Ger at 08:25 AM on 24 June 2016Analysis: Is the UK relying on ‘negative emissions’ to meet its climate targets?
Turning agri-cultural residues into bio-char is one way of storing carbon in soil. England has about 12 million ton of straw from wheat, barley etc. which isn't mentioned as a source for energy and bio-char.
Adding bio-char, enhanced with nitrogen from waste water streams, frequently gives 30% to 40% more product from land. Reducing land use likewise. Cover crop and low tilage are simple and hardly used at this moment, which would make use of land more efficient.
As flooding occurs more regular, one can assign patches of land to act as buffer and plant those areas with energy crops like reeds. Those reeds don't mind to be underwater for a while but still give some production of otherwise unusable land.
Then there are processes like the Sabatier process https://en.wikipedia.org/wiki/Sabatier_reaction producing CH4 from CO2 and water at slightly elevated temperatures of 300~400 Celsius, which can be sourced from CSP and high temperature processess like steel making.
Moderator Response:[GT] Turned link on.
-
amhartley at 06:55 AM on 24 June 2016A brief history of fossil-fuelled climate denial
Scorgie @7
Right; I don’t see your Groups 1 & 4 as differing much. In any case, though, based on the Denial101x course, the important distinction seems to be between the active deniers & the passive uninformed. Making any headway with the deniers is quite difficult due to the ‘backfire effect’ & various vested interests (“a man convinced against his will…is of the same opinion still”); however, one can hope to have an effect on the uninformed.
-
Mal Adapted at 06:54 AM on 24 June 2016A brief history of fossil-fuelled climate denial
AMHartley: "Some, at least, of those people might actually sincerely disbelieve a climate change problem exists, leading them to assert that no ‘solutions to climate change’ are needed."
IMO, anyone who "sincerely disbelieves a climate change problem exists" is sincerely in denial. Mere ignorance doesn't explain their position: a genuine skeptic who was merely uninformed would reserve judgement while seeking reliable information. A genuine skeptic would also want to be able to recognize who the credible sources of scientific information are, rather than swallowing whatever he or she sees on FoxNews or reads on WUWT.
In the Internet Age, it's just as easy to find reliable sources of information (for example, the U.S. National Academy of Sciences, or the Royal Society of the U.K.) as it is to find unreliable sources. Therefore, forming an opinion that ‘no solutions to climate change are needed because no climate change problem exists' is a matter of choosing to believe untrustworthy information sources over trustworthy ones. That is, it's a matter of denial.
-
Tom Curtis at 03:46 AM on 24 June 2016A brief history of fossil-fuelled climate denial
OPOF @8, from the text quoted @1, over 50 years prior to the article, 50 GtC was released to the atmosphere. That represents an atmospheric increase of 23.5 ppmv if all of it was retained in the atmosphere. Based on the science of the time, the claim is made that "well over 90 per cent. of any excess carbon dioxide introduced into the atmosphere eventually finds its way into the ocean". A 90% figure for such a low cumulative emissions is consistent with modern carbon models. What differs is modern models, based on emperical evidence not available in the 1930s, show that it takes several hundred years for that draw down, not the couple of years assumed by the text. Based in the science of the time, however, an estimate of 10% of 23.5 ppmv, or 2.35 ppmv increase is reasonable.
As it happens, they significantly understate their case, instead claiming 20 ppmv increase (from 300 to 320 ppmv). Presumably they have not factored in the ocean draw down, in line with the claim the conditional, "If all the carbon dioxide dumped into the atmosphere in the last 50 years had not been removed by returning the elements involved to the earth in some form or other".
Finally, that the case is presented persuasively does not make it denial. Richard Alley, Michael Mann and many others on the pro-action side try to present the science persuasively. That does not make their writings (or their popular writtings) anti-scientific. It is only when you misrepresent the science to achieve greater persuasive power that you become antiscientific, and consequently (if you oppose action) a denier.
This attempt to turn "denier" into a word that merely indicates disagreement, without regard to the merits of the science at the time of writing, turns it into nothing but a tribal insult - a means of indicating that the person in question disagrees with you, and that you intend to insult them for that alone. It evacuates the word of useful meaning.
-
Glenn Tamblyn at 03:14 AM on 24 June 2016Venus doesn't have a runaway greenhouse effect
Mike Hillis
My graph is from Conrath et al 1970 - NASA used to host a non-pay-walled copy. To my knowledge this was the first time such a measurement was possible, from the Nimbus 3 satellite. This graph shows the corresponding planck curves. Figure 5 from the paper shows both theoretical and observed data from most of the pectrum, with a vertical displacement of one graph for clarity. Impressive agreement between theory and observation given it was 1969.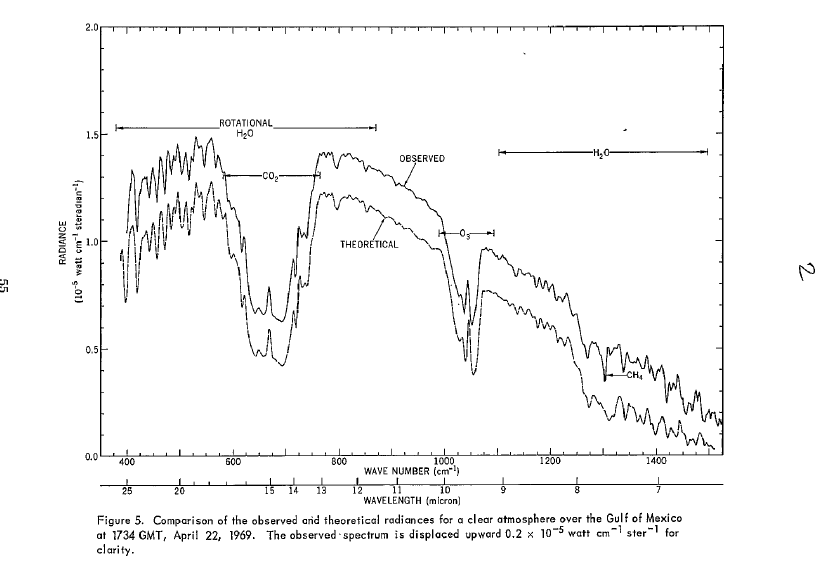
The cutoff above 25 micron is because that was the range of the instrument.
Regarding your graph, yep, that is a typical tropical profile.
Note how everything to the left of the CO2 notch, due to H2O Rotational absorption, is all substantially below the planck curve from the atmospheric window.
What is missing from this, since it is a clear sky simulation, is the effect of clouds. With clouds the curve sits significantly below the surface planck line across most of the spectrum. You can explore this here. at the Uni of Chicago - an online hosted copy of the Modtran simulator. You can select broad atmosphere profile, cloud type, gas concentrations and where you are looking from.
This is current gas composition, US Standard Atmosphere to be indicative of the entire planet, no clouds, looking down from 70km.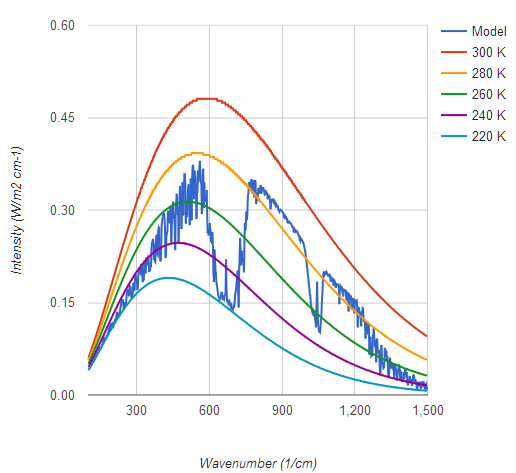
Here is the same set up but with a cumulus cloud base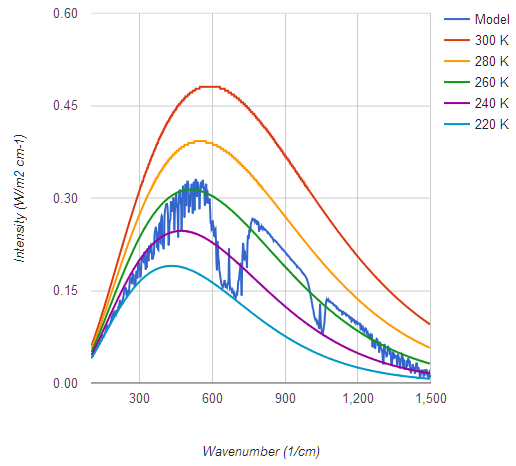
As you can see, clouds modify the picture significantly. Here nothing is originating from the surface.
So with a reasonable proportion of the Earth cloud covered, on average, only a small percentage of surface radiation escapes directly from the surface.
An interesting exercise with the Chicago simulator is to select a configuration and progressively look down from lower and lower altitudes all the way to zero. Gives a sense of how high in the atmosphere different parts of the spectrum originate from.
This is a simulation of an atmosphere with 400,000 ppm. It isn't completely realistic since it still assumes a standard temperature profile, no extra water vapour and may not model continuum absorption, but as you can see, lots of extra effects and significantly less energy escaping to space..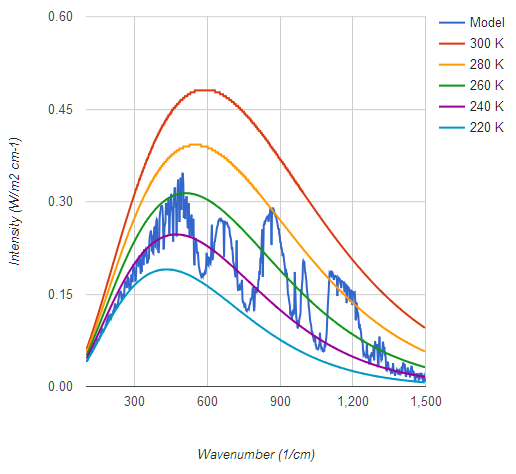
-
One Planet Only Forever at 03:08 AM on 24 June 2016A brief history of fossil-fuelled climate denial
rocketeer@1,
I agree with your point about the 1937 report being an early example of deliberate climate change denial, or more correctly a deliberate attempt to diminish or dismiss the implications of burning fossil fuels.
The following part is the basis for declaring it to be disinformation messaging like we see today.
"...would have increased only two-thousandths of one per
cent. in that time; from 0.03 to 0.032 per cent."That statement does not say the increase is 6.67 percent. It deliberately says the increase is only 0.002 percent. That is a deliberetae diminishing of the impact by a scale of 3333.3 times.
So in addition to being an early piece of disinformation marketing, it is a whopper.
And the closing statement including the word "infinitesimal" hopes to be reinforced by the ealier 3333 times diminishment of the amount of CO2 impact by that early date.
Clearly it is a deliberately thought out bit of disinformation marketing created by people who actually do 'know better' like we see today.
-
John Hartz at 01:34 AM on 24 June 2016Climate scientists have warned us of coral bleaching for years. It's here
pjcarson2015:
You asserted:
Until AGW raised its head ca 1985, not much concern was raised about bleaching, and was reflected in when or if it was reported.
I asked:
How do you know this to be true?
You responded:
Because I’m old enough for my observations to be contemporaneous.
Can you document evidence that your memory is accurate?
What do you mean by the phrase, Until AGW raised its head ca 1985 ?
Does your initial assertion apply globally, or just to Australia?
-
Mike Hillis at 21:26 PM on 23 June 2016Venus doesn't have a runaway greenhouse effect
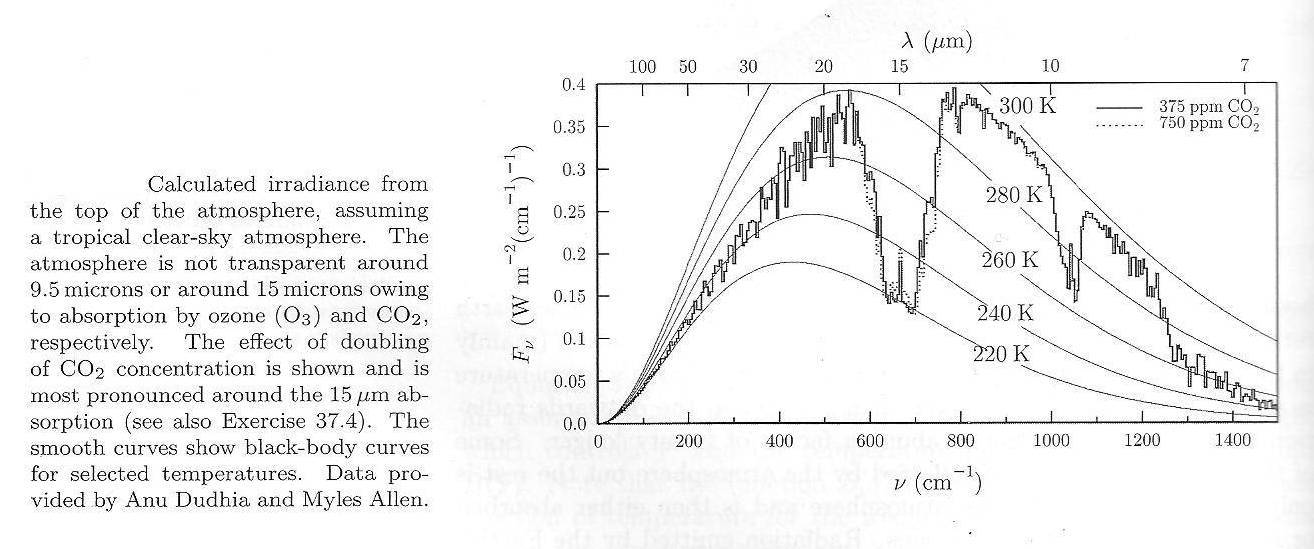
I prefer a graph which shows actual flux, not log of intensity, to get a more accurate visual image of what's going on, and one which covers Earth's entire upwelling IR spectrum of 7 microns to 100, not one artificially cut off at 10 and 25 microns. In this case we see a CO2 band of IR emitting at 220 K but that the majority of Earth's IR radiates from near the 300 K Planck curve, which means it's not being absorbed by any greenhouse gases. Yes I do know about the 9.6 micron O3 band which also radiates from higher elevations and lower temperatures.
Earth's greenhouse atmosphere is like an actual greenhouse, with one section of glass representing CO2, another section for H2O vaor, and most of the roof wide open.
-
Tom Curtis at 21:25 PM on 23 June 2016Climate's changed before
Glenn Tamblyn @527, here is the relevant paper showing low CO2 levels at the start of the Ordovician glaciation. It is discussed in passing by Richard Alley in his famous lecture.
-
Glenn Tamblyn at 20:37 PM on 23 June 2016Climate's changed before
Doodad - nice tag by the way :-)
Is this a drive-by or do you have specific points to make.
And by the way, current CO2 is more like 400, not 350 ppm.
Yes there are mechanisms that draw down CO2, just as there are mechanisms that can raise it. The key question is over what timescales. Come back in a million years and our disruption of the carbon cycle will have disappeared from the climate system. However its signature will be visible for 10's to 100's of millions of years in the geology.
How could an Ice Age have happened when CO2 was 5000 ppm (very approximately)? Perhaps if they dropped!
Your figures of 4% lower solar and 5000 ppm suggest you are referring to the End Ordovician Ice Age (and Mass Extinction Event). You might help discussion if you clarify that.
So using the standard definition of the impact of changing CO2 levels - similar impacts for each doubling, 350 ppm (your number) to 5000 ppm, is under 4 doublings - 700, 1400, 2800, 5600. So somewhat under the impact of one doubling. One doubling changes radiative balance by 3.7 w/m^2 so around 14.8 w/m^2 in total. Actually when we look over larger ranges of CO2 concentrations this change is lower, so less than 14.8.
Then solar was 1310.8 rather than 1365.4 watts per square meter today - your figures. The current estimates are more like 1361, the 1365 figure was likely a small calibration error from an earlier satellite. Small detail.So on your figures, a difference of -54.6 w/m^2. But we need to divide by the ratio of the Earths frontal area to its total area, so divide by 4. -13.65 w/m^2.
Hmmm... Not much difference. So if CO2 dropped back then, an ice age is entirely plausible. A drop from 280 to 180 ppm today is associated with a swing into an ice age. That is the equivalent of a swing from 5000 to 3200 ppm back then. What might trigger that? The evolution of vascular plants drawing down CO2? Major volcanic events sequestering CO2 due to weathering?
We don't know everything about the past but it sure fits with CO2 being a significant factor. -
Glenn Tamblyn at 19:40 PM on 23 June 2016Venus doesn't have a runaway greenhouse effect
Mike, actually not off-topic, just a more detailed exploration of the topic. You might find this interesting

This is the data from the HiTran spectroscopic database for the Spectral Intensity of CO2 vs wavelength.
This is the starting point for evaluating absorption/emission strength. As you can see the vertical scale is logarithmic. The roughly triangular shape of the graph either side of 15 on a logarithmic scale is the primary basis of the logarithmic nature of CO2 forcing.
So peaks either side of 10 are also visible, and a peak near 5. However they are 4 orders of magnitude weaker than 15.
However this is only part of the picture. There is also a process called Line Broadening which, particularly in the lower atmosphere, smears out each line substantially. Extend this to Venus or Jupiter like atmospheres and individual lines can actually be smeared across much of this graph. There is more on this here.
As a result the actual spectrum observed by satellites is a product of some complex stuff.
Here is one such satellite measurement, from 1969.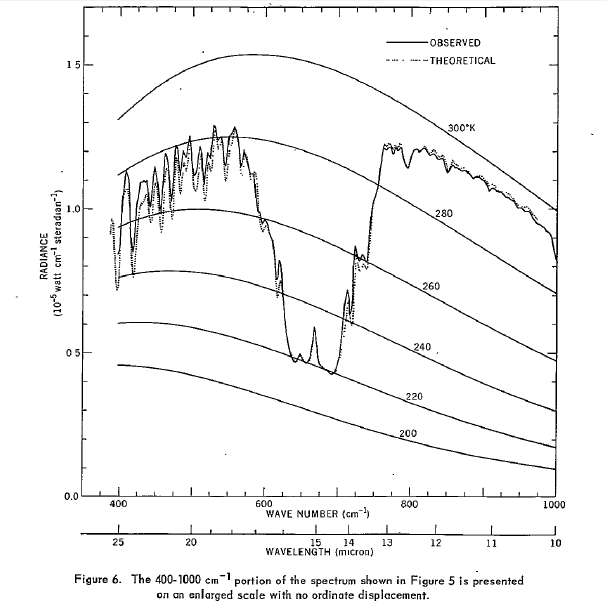
That spike at 15 micron, at the centre of the CO2 'notch', doesn't just come from the top of the troposphere. It actually comes from the upper stratosphere where temperatures are actually higher.
So yes, there is lots of wavelength specific detail. Most of the radiation from 9 to 11 is from the surface except near the centre of that where Ozone plays a role - that is just visible on the above graph as a dip starting at the right extreme.
However, at a broader level, dealing with averages across wavelengths, the broad picture I have painted is still valid. -
Tom Curtis at 18:28 PM on 23 June 2016Climate scientists have warned us of coral bleaching for years. It's here
pjcarson2015 @26, a person who assumes scientists are uninformed buffoons as you do deserves no respect. Especially when you do so on the basis of such transparently inadequate arguments.
-
Tom Curtis at 18:24 PM on 23 June 2016Climate's changed before
Doodad @522, the primary effect of warmer weather on cold blooded creatures is that they become faster in their actions. There is a limit on this, primarilly based on the fact that they must use different enzymes in different temperature ranges, and above 60 C they do not have appropriate enzymes. But you are correct, for lizards, and cockroaches, and flies and mosquitoes, and other cold blooded creatures, warm conditions are good conditions.
Likewise, warm conditions tend to be good conditions for small warm blooded creatures. This is because they have a higher skin area to volume ratio, allowing more efficient cooling; and because they have higher basal temperatures so that wet bulb temperatures need to be more elevated to cause heat protration and death than they do for large warm blooded creatures (such as humans, and human livestock). So, within limits, warmer climates are good for rats and other rodents.
In general, warm weather is good for all of hour pests and parasites.
I'm not sure why you think that is a good thing.
In contrast, for humans in the tropics, summer temperatures already reach or exceed the range that allows efficient cooling on a regular basis. This can be ameliorated by drinking large quantities of water, finding shade, and resting - the combined effect of which is to significantly lower work efficiency. So, already in the tropics warmer climates will have a negative effect on the economy just from the direct effect of heat on humans. However, with a sufficient warming, the tropics will regularly reach wet bulb temperatures leading to death of humans and large livestock (anything larger than a chook). Put simply, most of China, all of India and all of South East Asia, the north part of Australia, most of Africa, the mediterrainian and Middle East, Central America and the north part of South America including essentiall all of Brazil will become seasonally uninhabitable.
This massive catastrophe is very unlikely if we take serious measures to limit climate change, but laregely unavoidable if we insist on burning our conventional fossil fuel reserves to exhaustion. Currently we are doing something towards mitigating climate change, but branching out to burn unconventional fossil fuels as well.
-
Tom Curtis at 18:09 PM on 23 June 2016Climate's changed before
Doodad @524, using the standard formula, top of atmosphere insolation 400 million years ago was 96.6% of the current value of 1360 W/m2. However, that is the insolation per meter squared prior to the effect of albedo, and for an area perpendicular to the Sun's rays. The Earth is effectively a sphere so that only a small part of it is perpendicular to the Sun's rays at any time, and half of it is in darkness at any time. Averaged over the Earth's surface, that means the incoming sunlight is one fourth of the top of atmosphere insolation. (The difference is just the ratio between the area of a circle perpendicular to the Sun's rays and just large enough to cast the Earth entirely in shadow, and the area of the Earth, ie, the ratio of πR2 to 4πR2, where R is the radius of the Earth.) Further, the Earth's albedo of 0.3 means 30% of sunlight is reflected to space and does not contribute to warming the Earth. Therefore the average sunlight that warms the surface amounts to (Top of atmosphere TSI * (1 - albedo))/4, or 238 W/m2.
Assuming the same albedo, that means the average sunlight warming the Earth's surface 400 million years ago amounted to 229.95 W/m2.
Four hundred million years ago, there was approximately 4000 ppmv of CO2 in the atmosphere:

4000ppmv is 10 times 400 ppmv, or 3.32 doublings (23.32) of 400ppmv. Each doubling of CO2 has a forcing of 3.7 W/m2, so 4000 ppmv has a forcing of 12.84 W/m2. Adding the 229.95 insolation gives a warming effect of 242.23 W/m2, or 4.23 W/m2 relative to the current forcing.
For whatever it is worth, the forcing difference between 400 ppmv and 5000 ppmv (3.64 doublings) is 13.48 W/m2.
I assume this relates to your claim that there have been ice ages with CO2 levels at 5000 ppmv. That claim is false. To understand why, it must be understood that the graph of CO2 concentration shown above has a resolution of 10 million years (top of fourth page). If there is a five million year period with low CO2 immediately preceded by a period with high CO2, it will be shown as a period of average CO2 because the resolution of the graph is incapable of distinguishing the two periods. A later publication by the lead author of the previously linked study had a look at CO2 levels during periods of glaciation with data from high resolution strata. In almost every case, the ice ages came in periods of low CO2 (< 1000 ppmv) that were too short in duration to show up in the 10 million year resolution graph. The few cases not covered by his paper have since also been shown to have low CO2 by the discovery of new high resolution strata.
And just a point of vocabulary, geologists call any age with sea level, or near sea level glaciers an ice age. The periods of massive glacier advance commonly called ice ages by non-scientists are, by geologists, called glacials; while the warm periods between glacials are called interglacials. Thus, because of the sea level glaciers on Greenland and Antartica, we are currently in an ice age. Even with projected melt of ice sheets from a 5 C warming, there will still be sea level glaciers in Antarctica, and we will still be in an ice age. Absent more detailed information, the fact that there was an ice age in the past does not tell us whether it was equivalent to a glacial (as you are probably assuming) or an interglacial (as we are now).
Note that a 5 C warming is approximately equivalent to the equilibrium effect of an increase of CO2 from 280 ppmv to 975 ppmv (ie, effectively the 1000 ppmv limit found in the paper from the second link above).
-
Doodad at 16:28 PM on 23 June 2016Climate's changed before
Is a 4% less solar irradiance than the present enough to level out and invert the effects of a dozen times the amount of carbon dioxide than the present? Please affirm if these are true:
the carbon ppm back then was over 5000
the carbon ppm now is around 350
the solar irradiation now is around 1365.4 watts per square meter, therefore back then it was 1310.8
Under these conditions:
over 5000 carbon ppm + 1310.8 w/m³= ice age temperatures
350 carbon ppm + 1365.4w/m³=16ish degrees
Doesn't this reflect the insignificance of carbon levels?
We can all easily see how much solar irradiance affects the earths temperature. Just compare the temperature at night with the temperature in the day. Thats how much sunlight can change temperatures.
According to your articles, if we increase CO2 levels in the air by 3 times now, a sudden 1% decrease in solar irradiance will plunge us into another ice age? That is to say, the temperature difference made by 300% increase of CO2 is dwarfed by the temperature difference made by a 1% increase in solar irradiation?
-
pjcarson2015 at 15:23 PM on 23 June 2016Climate scientists have warned us of coral bleaching for years. It's here
Tom Curtis. I haven’t bothered to answer your #25 #5, etc, because of your lack of respect. (It won’t help your comprehension but try using a spell-checker.)
-
Doodad at 13:52 PM on 23 June 2016Climate's changed before
CO2 levels long long ago have been over 5000 parts per million, while at the present they are a mere 300. And yet when the CO2 levels were 5000 ppm, the earth was in an ice age. Sure, CO2 isn't the only driver of climate change. But that just reflects what little change CO2 can make to temperatures. Can you tell me, why there was an ice age back then? Have you fully investigated the other driver of climate change? How do you know that other driver is not also playing a part in the current warming? Does that mean even if current CO2 levels were to rise to 5000 ppm, it wouldn't have a significant impact on our climate? When CO2 levels were high in the past(there were also plenty of small fluctuations), WHAT caused them to drop back down? Climate scientist have poured all of their research into what CO2 does to the climate, but what about the other driver?
Moderator Response:[PS] Please see the "CO2 was higher in the past" article and comment there if unclear. I have already pointed you to the article (on weathering) about what caused reduction in CO2 in past. The Search box on the top left or the Arguments, Taxonomy of the menu bar are a good way to find information about these common myths. And before you make assumptions about what climate scientists have and have not studied, I strongly suggest you look at the IPCC WG1 report.
-
Doodad at 13:29 PM on 23 June 2016Climate's changed before
Mammals have the ability to adjust to warmmer weather. We have built in systems to help us reduce body heat. Sweating. Reptiles also will not be harmed by warmer weather. Reptiles cannot adjust their body temperature, they can only use the environment. If it gets warmer, they can easily stay in the water, or under shade, which is what they have been known to do. Colder weather in contrast is the main reptillian killer. There is no simple way like going under a shade or jumping into the water to elevate their body heat. When it's cold, it's cold, and it's cold everywhere.
Moderator Response:[PS] This is extremely simplistic description but I am not sure what point you are trying to make? In what way is your comment relevant to this topic? Are you contesting the evidence in the fossil record that sudden increases in temperature also correspond with mass extinctions?
-
Tom Curtis at 13:16 PM on 23 June 2016Climate scientists have warned us of coral bleaching for years. It's here
John Hartz @23, I was expecting a bullshit answer from pjcarson2015, and you got it.
We can check his hypothesis independently, however. Suppose a low level concern for reef health as a background. Then prior to the massive increase in interest in global warming circa 1990, mentions of "Crown of Thorns Starfish", and "Coral bleaching" should follow similar patterns prior to 1990s, after which interest in coral bleaching should take of. In contrast, if coral bleaching was virtually unknown before the 1980s, there should be little mention of coral bleaching prior to then, and then mentions should rise with the rise in coral bleaching events. Looking at an n-gram search of the two terms, however, we find a rise in interest in COTS in the 1970s that was not matched by a similar rise interest in coral bleaching, as would have been the case had bleaching events been a regular occurence and the concern only be with reef health. Following the global bleaching event in 1983, and especially that of 1998, there is a rapid rise in interest in coral bleaching, which fell significantly a few years after the 2003 bleaching event.
That is, the documentary evidence strongly favours the rise in bleaching events resulting from a rise in SST as the cause of the interest in bleaching events.
Of course, if that is not evidence enough, I also am old enough for my observations to be contemporaneous; and my observations are incompatible with pjcarson2015's thesis. Of course, such anecdotal claims are irrelevant as evidence, in either direction - but Carson cannot count his observations as evidence while excluding mine with out transparent special pleading.
-
pjcarson2015 at 11:59 AM on 23 June 2016Climate scientists have warned us of coral bleaching for years. It's here
#23 John Hartz. “How do you know this to be true? “
Because I’m old enough for my observations to be contemporaneous.
Do you have evidence to the contrary?
-
Digby Scorgie at 09:59 AM on 23 June 2016A brief history of fossil-fuelled climate denial
amhartley @6
You have a point. My hypothesis until now has been that deniers can be divided into three groups, but perhaps I should make that four. My three groups are as follows:
Firstly, there are the psychopaths. You'll find them in the fossil-fuel industry. They know that climate change is a threat but would rather maintain their wealth and power in the short term in expectation that global warming will only become serious in the long term. They are the people behind the climate-science disinformation campaign.
Secondly, there are the suckers. These are the ordinary people who have fallen victim of the disinformation campaign. My assumption is that such people would accept the fact of climate change if they were exposed both to the evidence of climate change and the evidence of the fossil-fuel industry's deceit.
Thirdly, there are the psychotics. These are the flat-earthers whose irrational world-view has no place for the evidence of climate change. Of course they "sincerely disbelieve a climate-change problem exists".
However, I now see the possibility of a fourth group. These are the fanatics who compare the evidence for climate change with the proposed solutions to the problem and conclude that the latter is worse for them than the former. Or can this group be lumped in with the psychopaths?
-
Doodad at 06:44 AM on 23 June 2016Climate's changed before
If past global warmings have been caused mainly by CO2, and it has caused temperatures higher than the present, then how did temperatures come back down and even into an ice age later? There were no animals trying to reduce CO2 emissions back then? That means CO2 emission came back down for some natural caused reason. Does that mean CO2 would also come back down naturally after a period of time after the present warming?
Moderator Response:[PS] Please read the intermediate version of this article. Climate has changed before for many reasons but in these changes, GHGs operate as amplifiers. Over very long time periods earth has a crude "thermostat" in rock weathering (releasing Ca). See here in particular for details and also here and in referenced papers for more. Also, see Mathews and Weaver for how fast temperatures could change under zero emissions etc.
-
amhartley at 06:31 AM on 23 June 2016A brief history of fossil-fuelled climate denial
John Cook, the claim that “People who fear the solutions to climate change, such as increased regulation of industry, are more likely to deny that there is a problem in the first place – what psychologists call “motivated disbelief” ” seems a little uncharitable, if not an invalid argument. Some, at least, of those people might actually sincerely disbelieve a climate change problem exists, leading them to assert that no ‘solutions to climate change’ are needed.
As much as I disagree with Karl Popper on some things, I applaud him for giving others the benefit of the doubt, & trying to strengthen their arguments (before tearing them down, when needed). Would it be possible to adjust the claim about “motivated disbelief” to follow Popper’s example to us all?
-
Mike Hillis at 04:11 AM on 23 June 2016Venus doesn't have a runaway greenhouse effect
Glenn, this is slightly off-topic but when speaking of emission elevations and temperatures, and optical thickness, you must specify wavelength. On Earth, emission of 15 micron IR occurs at the top of the troposphere at cold temperatures, but 9, 10, or 11 micron IR for examples, are emitted to space from Earth's surface (if not blocked by cloud) at very warm temperatures.
-
Glenn Tamblyn at 03:15 AM on 23 June 2016A brief history of fossil-fuelled climate denial
I agree with Tom. In terms of the history of the science, this question was not understood till the 50's and the piece was reporting the scientific view of the time.
However it is still an example of some PR from the petroleum industry. At that time perhaps not unreasonable, it is how an industry responds as the science develops that is the key issue. -
Tom Curtis at 03:02 AM on 23 June 2016A brief history of fossil-fuelled climate denial
rocketeer @1, in 1937 scientists did not know the rate at which CO2 dissolved into the ocean, and more importantly, how rapidly it mixed with the deep ocean. They did not know this until nuclear testing increased the production of C14, giving them a marker with which to trace this in the 1950s. Nor did they know the rate at which CO2 was released by volcanoes (which I believe was not estimated until the 1990s) and hence did not know the rate of natural weathering. Most importantly, they had no clear data showing an increase in the atmospheric CO2 levels (not obtained until Keeling set up the Mauna Loa observatory until the late 1950s). In short, until the late 1950s, they did not have evidence that refuted that hypothesis.
It follows that that is not an example of climate change denial, but only of a scientist being wrong in the absence of relevant data. Scientists do that all the time. It is what drives them to find the relevant data to test alternate theories. Of course, presented today when we do have all that data, or indeed, anytime after the mid 1960s, that theory is denial because it flies in the face of some conclusive evidence.
-
BBHY at 02:53 AM on 23 June 2016A brief history of fossil-fuelled climate denial
Another factor is that climate denial has effectively been turned into a "shibboleth".
People like belonging to a group, whether religous, political, idiological, or otherwise, and for many people people the group the feel affinity for is conservatism. A shiboleth something that people use to identify themselves as part of a particular group, and climate denial has been turned (intentionally, IMHO) into a way for people to identify themselves as a member of the conservative group.
The big difficulty with this is that trying to argue with those folks by presenting evidence and facts about climate change simply reinforces to them that you are "not one of them", an outsider, and therefore possibly not to be trusted. Studies have shown this is often the case, presenting more evidence about climate change to people can actually make them even more certain that their original view is the valid one.
-
Dcrickett at 01:18 AM on 23 June 2016A brief history of fossil-fuelled climate denial
A few weeks ago I finished reading "This Changes Everything" by Naomi Klein. I have not been able to fault the book on accuracy; I do wish it were to show less political bias (altho Ms Klein tried valiantly to minimize this). Nonetheless, the book did make me think. Particularly about how and why intelligent, rational, well-meaning folks don't "get it" on the need for massive and immediate action (the less immediate the action, the more massive it must be).
Political people tend to ignore the "hair-on-fire" urgency of climate action because (a) they can ignore it and get away with it; and (b) their action paradigm does not see the utter nonnegotiability of Nature. Negotiation and compromise are core to a proper political action paradigm, but are immiscible with the science paradigm.
Unfortunately, this has consequences every bit as bad as the misunderstanding spawned by denialism.
-
rocketeer at 00:06 AM on 23 June 2016A brief history of fossil-fuelled climate denial
This is the earliest example of climate change denial I am aware of. i suppose at this early date it could qualify as genuine skepticism rather than denial, but it does come from the petroleum industry so... Also, the arguments may sound familiar as they are still in use 80 years later. Enjoy.
Science - Supplement July 30, 1937
THE CARBON DIOXIDE CONTENT
OF THE AIR
Even though man has released into the atmosphere
some 180,000,000,000 tons of carbon dioxide gas by the
burning of mined fuel during the last half century, the
plants of the world each year return this carbon dioxide
a thousand fold through their decay or combustion.
Dr. Robert E. Wilson, president of the Pan American
Petroleum and Transport Company, who reports this result
in Industrial and Engineering Chemistry, also notes
that the fears of those people who shudder at the
" greatly " increased carbon dioxide content of the air
which is produced by modern industrial activity, are unfounded.
If all the carbon dioxide dumped into the
atmosphere in the last 50 years had not been removed by
returning the elements involved to the earth in some form
or other, the carbon dioxide content of the atmosphere
would have increased only two-thousandths of one per
cent. in that time; from 0.03 to 0.032 per cent.The controlling factor which determines how much carbon
dioxide there is in the air is the water of the earth 's
oceans. Available data indicate there is some 30 to 40
times as much carbon dioxide dissolved in the ocean as is
present in the atmosphere. The average partial vapor
pressure of this carbon dioxide is probably largely what
determines the average carbon dioxide content of the air,
so that well over 90 per cent. of any excess carbon dioxide
introduced into the atmosphere eventually finds its way
into the ocean, leaving the composition of the former
virtually unaffected.
The combined result of all our mining and chemical
activity to date has made but an infinitesimal alteration
in the composition of the earth 's crust or sea water.
And this, despite the fact that in the past half century
some 50,000,000,000 tons of carbon have been obtained as
either coal, lignite, crude petroleum or natural gas
Prev 464 465 466 467 468 469 470 471 472 473 474 475 476 477 478 479 Next


