


 Arguments


Recent Comments
Prev 474 475 476 477 478 479 480 481 482 483 484 485 486 487 488 489 Next
Comments 24051 to 24100:
-
raindog at 06:21 AM on 17 October 2016Explainer: Paris Agreement on climate change to ‘enter into force’
RE: #3: scaddenp, there are some, like Guy McPherson, who believe we have already passed "a point of no return" and face extinction. Others, like Kevin Anderson, think we are very late in the game here, but, perhaps, still can avert the most dire consequences of climate change if we take immediate and appropriate action. In videos and papers, he does make suggestions.
I am not a scientist, but there does seem to be some validity to the idea that climate change may, at this time, be irreversible.
Please correct me if I am wrong.
-
nigelj at 06:22 AM on 16 October 2016Climate scientists published a paper debunking Ted Cruz
William @2, politicians are notorious for dishonesty, and also having different stories for different audiences. They do this so often they probably end up not even realising they are doing, it or knowing what they really believe themselves.
-
Bob Loblaw at 05:00 AM on 16 October 2016It's the sun
BillN:
I expect that your latter paragraphs, if not your whole post, will be deleted by the moderators. For someone who complains about others' tone, you seem to not hold yourself to the same standards. What you consider to be "reasonable" in your own posts is not considered reasonable by others here.
In your post #1180, the full sentence is:
Even though the FOV (Field of View) of the instrument picks up only a small fraction of the solar disk, so that the solar light intensity at the cone is only a small fraction of the full TSI, the instrument has to stay on for a while in order to come to thermal equilibrium when making a measurement (thermal equilibrium under loading is the basis for making the measurement).
You may not have specifically stated that an adjustment is needed, but you did say (incorrectly) that the instrument does not measure the full disk, which certainly implies that something needs to be done about it. How would you get a proper reading of the full TSI from a partial measurement if you do not account for the partial measurement? Or were you just (incorrectly) implying that an assumption had been made that thought was unwarranted?
Your use of the word "optical" implies much more than it should to the casual reader. I pointed out the very limited limited scope in which that term applied to the Eppley HF. If what I said was (to quote you) "exactly" what you meant, then that is what you should have said to begin with. I have not accused you of intentionally misleading anyone, but I have clarified the very limited scope in which your statement applies, so that casual readers will not take the wrong impression from what you have said.
When you walk in here and start proclaiming your expertise, and acting as if we should only take your word on things, then you are making an argument from your own authority. I provided links to the group (PMOD) responsible for the surface-based pyrheliometer comparisons and the World Radiation Reference. I provided a link to a peer-reviewed journal paper describing the stability of the Eppley HF after space exposure. Tom Curtis has provided you with other links. You have not (as far as I can see) provided a single link to support any of your assertions - instead expecting us to believe you solely on the basis of your claimed expertise. Since you claim to have knowledge in these areas, surely you can back up your claims with some references?
You are correct that SkS is a web site where individuals that can provide nothing more than a viewpoint are subject to critical reaction. People are expected to provide independent support of those opinions.
-
RedBaron at 04:39 AM on 16 October 2016Climate scientists published a paper debunking Ted Cruz
@2 William,
You said, "Go figure. I wonder how many politicians are equally crassly dishonest."
All of them? It's a job requirement!
-
william5331 at 03:56 AM on 16 October 2016Climate scientists published a paper debunking Ted Cruz
Seems somehow beneath our dignity to answer every ning nong that denies the evidence of his own eyes. I suppose it has to be done. I was talking to a climate change scientist a month or so ago in England. He related an interesting story. He was at a conference, not on climate change, in which one of the politicians (who shall remain nameless) was giving vent to the usual denyer story. Purly be coincidence, this chap was seated beside the politician on the plane on the way back home. They got talking about climate change. The politician expressed the opinion that it was our most serious problem today. Go figure. I wonder how many politicians are equally crassly dishonest.
-
PluviAL at 03:28 AM on 16 October 2016Climate scientists published a paper debunking Ted Cruz
Scientifically, conservatives are grasping at straws, but politically they are wilding a sledge hammer: Americans (AND other car and high consupmtion people) don't want to hear the truth, if it means we have to work or sacrifice, and we are masters of self-deception. The question is can we be made to try harder than just a few more enlightened states carrying a backwards nation (world)? I say no, unless people can see solutions. We need to offer solutions before America can climb down from our delusions.
As some may know I work toward solutions in my books and papers. I wish more scientifically minded people would join me. There are solutions if we think on scale, and seriously. Wind and PV solar are solid starts, but I think we need minimally 10 times more potency than those tools can offer. We can get 100 times that potency, and really much more.
-
Bill N at 03:06 AM on 16 October 2016It's the sun
Bob,
You have mischaracterized what I have said on almost every count.
The only thing you have corrected me on is that the FOV for these instruments encompasses the entire solar disk, which only serves to strengthen my argument that the solar light hitting the cavity wall will degrade it and cook any outgassing contamination on it. I never said an adjustment must be made to account for what I thought was a limited FOV, so again you mischaracterize.
I never said that there were any other optics besides the open aperture and the optical cavity, so again you mischaracterize. You yourself said that the only room for optical change is the cavity reflectance (absorption ratio). But that's exactly what I have been talking about, nothing more, nothing less. It is the long term stability of this optical property under degrading environmental influences that is the question here.
I did not feel the need to explain what "active cavity radiometers" are beyond the optical components being evaluated, assuming that interested readers here can Google this in a split second and get a lot more detail on them than what I could provide in writing. So what's you beef here.
Again you BS when claiming that I said the instrument developers did not consider stability. I have stated here till I'm blue in the face that there is disagreement amongst the developers and users over what the stability is, even to the point that some think they can not be relied upon for long term TSI variability measurements. So obviously this is a hot topic for them, as I have said again and again.
Finally, I have made no claim whatsoever as to being an authority on space-based TSI measurements, so you last mischaracterization of me about this is a cheap shot. My only "authoritity" is my general experience as an optical engineer flying spaceborne instruments, with of course then radiometry part of that experience (some of this covered solar measurements).
So summarizing Bob, you're really a piece of work.
After recieving so much vitriol about reasonably poised questions and thoughts by me, I decided to Google what other folks think about what is going on at ScepticalScience. Wow! It seems the world opinion is that this site is populated by a bunch of alarmist trolls (kids mainly) who engage in dirty tactics to voraciously defend their pseudo-scientific viewpoints, so that anyone who comes here with a differing viewpoint, no matter how reasoned, will not be treated fairly. Well, that is certainly what I have experienced here (with a few exceptions). So good bye.
-
Bob Loblaw at 01:38 AM on 16 October 2016It's the sun
I will try to keep this short for the moment, as it look as if BillN may be leaving.
BillN has made several assertions about space-based measurements of TSI. I have not been involved in any space-based measurements, but I have a dozen year of experience in ground-based measurements of direct beam solar radiation using Eppley HIckey-Frieden (HF) cavity radiometers, of identical type to those that have been used in space. [All Eppley HF radiometers are built to the same space-rated specifications. I can't point to a peer-reviewed article that says so, so in a scientific paper I would have to reference this as "John Hickey, personal communication". He's the "Hickey" in "HF"...]
Anyway, BillN has made several questionable assertions. I will respond to a few:
- He refers to "optical stability". In the Eppley HF, the only "optics" are a black cavity that is fully-exposed to sunlight - no glass, no optics to focus sunlight, just an exposed cone-shaped receiver. The important "optical" characteristic of this receiver is its absorption ratio (or reflectivity, if you prefer). If that were to change, then stability would be affected, but all that cavity does is absorb solar radiation.
- The radiometer also has a tube and calibrated orifice arrangment to limit the field of view. You may also call this "optics", if you like, but it's not as if there is a telescope or anything like that. It's much like limiting your field of view by holding a paper towel tube in front of your eye. It's fancier than that - black interior, etc., to limit stray light reflections, and a controlled area aperture at the end so that you get an exact field of view, but that's it.The view of the sun is completely unobstructed.
- The field of view of the Eppley HF is slightly larger than the diameter of the sun, so BillN's assertion in comment #1180 that "Even though the FOV (Field of View) of the instrument picks up only a small fraction of the solar disk..." is simply wrong for the Eppley HF. For ground-based measurements, this means that the instrument also views a bit of scattered sunlight around the sun, but in space this will not happen. There is no adjustment for seeing a portion of the solar disk, as BillN has stated.
- BiilN correctly refers to "active cavity radiometers", without explaning what they are. The Eppley HF can be operated either in active or passive modes. The principle of operation is that the cavity that absorbs solar radiation will heat up, which introduces a temperature gradient measured by a thermopile. In active mode, this heating is offset by an electrical heater, and by measuring the electrical heating rate you will know the solar heating rate. In passive mode, you measure the thermopile output caused by solar heating (no electrical offset), but periodically shade the instrument (no sun) and substitute a short period of electrical heating to check the calibration. The calibration results is used to convert the solar-heating output to irradiance. Ground-based observations using the HF will usually use passive mode (e.g. at the International Pyrheliometer Comparisons held every five years in Davos, Switzerland, where the World Radiation Reference is maintained. These IPCs (which have been happening since the 1960s) are a primary indicator of instrument stability in ground-based measurements.
So, stability of an HF instrument depends on the absorption in the cavity remaining stable, and the electronics that measure the electrical heating remaining stable. There are no other "optics" involved.
Rather than taking my word on any of this, HIckey, Frieden, and Brinker have reported on the stability of the Eppley HF after six years in space:
Report on an H-F Type Cavity Radiometer after Six Years Exposure in Space Aboard the LDEF Satellite
This is a 1990 paper, unforunately paywalled, but the abstract reports a 0.1% stability, but with a 0.1% uncertainty on that value. 0.1% of 1368 W/m2works out to less than 1.5 W/m2. After accounting for global abedo (30%) and dividing by 4 (area of sphere vs. area of circle), this leads to an uncertainty of less than 0.25 W/m2 in global absorbed solar radiation. Much less than the CO2 forcing.
BillN is wrong in implying that the developers of such instruments have not considered stability. Tom Curtis' post above also explains how examiniation of multiple instruments and multiple sources of analysis increases confidience in the readings of TSI.
In short, BillN's implied position of infallible authority on matters of spaced-based TSI measurements is fallible.
-
RedBaron at 00:17 AM on 16 October 2016DOE charts show why climate doom and gloom isn't needed
Thanks Wyoming for refresing my memory. I think maybe I mistated it. Food production is actually much higher but we waste a lot of food worldwide. That's where we beat projections. However, we also lose about 100 tons of soil for 1 ton of food, and in my opinion that's what will cause it. Not the food per se, but the soil.
-
Bill N at 00:05 AM on 16 October 2016It's the sun
Hello Tom,
Thank you for the excellent post about the satellite instruments. It looks like you put a lot of work into it, which is greatly appreciated.
I especially took notice of the part about comparing 3 instruments at once to reduce errors. This of course significantly reduces all "drift errors" in which the drift mechanism has a equal likilyhood of moving in either direction. Unfortunately, optical radiometric changes are typically "one way," so that for instance all 3 compared instruments will have a reduced sensitivity over time due to the three error sources indentified previously: outgassing induced contamination, solar light induced degredation of the cone optical surface, and accumulation of spaceborn dust. All three sources will increase the diffuse reflectivity of the (designed) specular cone, thereby reducing the amount of light collected, yielding then a lower measured TSI over time for all instruments flown.
Of course, the degree of change for any particular source will vary between instruments. One of these error sources is likely to be predominant over the others (my guess would be either the outgassing contamination or the solar light induced degredation), and if its rate of change varied significantly from one instrument to the next, it would be detected as a relative change in the sensitivity of 3 instruments being compared. But IMHO, the variation between instruments for the rate of change of the predominant error source, is likely to be less than the average rate of change for the instruments combined, so as long as the average rate of change is not dramatic, the variation in the rate of change between instuments will not be significant enough to indicate the presence of the error. The TSI measurements themselves are "stable" enough to indicate that the optical error sources are not dramatic, so the predominant one is of course also not dramatic. Therefore, what ever the predominant optical error source is, it is reducing the sensitivity of all instruments together, but not so much as to indicate the variation in the rate of change from one instrument to the next. However, the average variation can still be large enough to significantly exceed the 0.01% stability requirement neccessary to rely on these instruments to show the TSI levels are not changing. Therefore, the issue still remains.
You are right in not taking my word on this issue with any more credence than what anyone else has to say, especially against the engineers/scientists building and using these instruments. However, in one respect, I am simply pointing out what any objective optical engineer will tell you, which is that an optical stability level of <0.01% for radiometric instrumentation is extremely difficult to obtain and prove, especially for "field instruments" such as ones flown in space. You should also be aware that there is disagreement amongst the instrument engineers and scientists as to whether they can be relied upon at all for measuring TSI changes (as opposed to absolute TSI measurements which everyone seems happy with). In particular, the claims of achieved stability made by PMOD are in dispute, as are their resultant measurements. I suggest you Google on this issue and take a look for yourself (I mentioned a starting point in my original post).
I believe I've "done my job here" in pointing out that the claimed stability of these instruments in order to successfully infer that the TSI is not changing (or even going down), is in question, even amongst the engineers and scientists that built and use these instruments. So I am now "signing off."
-
michael sweet at 23:52 PM on 15 October 2016It's the sun
Bill,
At this time you have provided no links to any "peer reviewed" studies that you used to form your opinions. I have only your unsupported claim that you are an expert on TSI (although you have apparently never been involved with the measure of TSI). I have provided links to peer reviewed studies that support my position. The Comments rules for Skeptical Science require peer reveiwed links to support your position.
Eclectic and I have shown that TSI is not required to determine that carbon pollution is the cause of warming and not an unmeasured increase in TSI. It is incumbent on you to answer these arguments. Since you have refused to even acknowledge them I presume that you have realized that you cannot respond and concede our position.
You have not " [shot] down a major cornerstone used by folks claiming that the observed warming must be due then to manmade greenhouse gas emissions", you have made unsupported assertions from unsubstantiated authority. Tom Curtis above has demsonstrated (using peer reviewed sources) that your argument is incorrect. That leaves you with only your unsupported opinion. Since I have shown that TSI measurements are unnecessarry to prove that warming is not due to the sun, you have shown nothing.
You are welcome to decide who you want to communicate with. If you want to argue by claiming expertise in a subject you clearly have not studied well (I look forward to your peer reviewed studies that answer Tom above) , claim you have proven a substantial part of AGW theory is incorrect when you have not, refuse to provide peer reviewed data and ignore arguments from other sources of analysis that show your argument fails, go for it. I think you will find that your unsupported opinions do not convince people at this web site.
A word to the wise: people who come here with bold assertions that they have overturned everything scientists have learned over the past 150 years are frequently recieved harshly. If you instead ask questions about what you do not understand people are happy to discuss these issues in great detail. If you say you do not understand the TSI measurements and how they relate to overall AGW theory you will be much better received. If you say you will not discuss how scientists know that the sun is not the cause of warming because you are an expert (at something you have never measured) you will not get friendly responses.
-
Wyoming at 23:17 PM on 15 October 2016DOE charts show why climate doom and gloom isn't needed
Re: #9 Red Baron
In fact the Limits to Growth projections on food production should we continue on a BAU path (as we have done) did not predict a collapse about now as you stated. The projection was for a food collapse to start mid-century (I looked this up in my copy beofre I wrote this message btw). The follow up works based upon LTG methods have also come to the same conclusion. We are tracking dead on the first projections of near 45 years ago.
-
chriskoz at 20:35 PM on 15 October 2016Caring for Creation makes the Christian case for climate action
Typo in my post above: I meant to recall "Resource curse" or "paradox of plenty" to invoke the suffering of people in Middle East as global civilisation is "energised" with their oil.
-
chriskoz at 20:29 PM on 15 October 2016Caring for Creation makes the Christian case for climate action
Dikran@26,
You obviously know that Samson 2011 has evidenced the FF burning benefit only those who do it (e.g. western world) while those who don't do it (e.g. Africa) suffer the consequences:
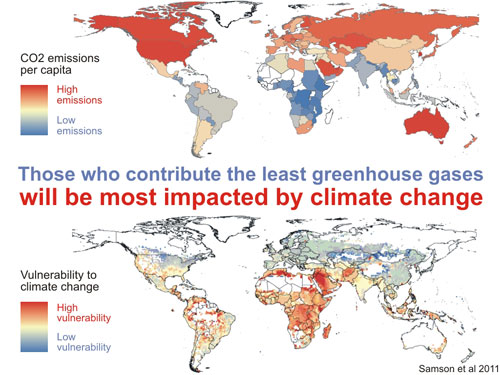
So the argument that FF burning could potentially be "reducing inequality" is not true. The NT etic of "love your neighbour as yourself" is clearly contradicted here, if the "neighbour" mean other countries.
The idea of buring FF to lift people out of poverty if a myth propagated by the FF interest groups. Ask people in those poor countries and they will say the opposite: they don't want that burning and that energy coming with it. Often, the "resource course" in oil rich countires of middle east (where AGW vulnerability is high as shown above) mean people over there get zero benefit of that dense energy consumption by the world, their return are just endless conflicts.
-
Glenn Tamblyn at 20:10 PM on 15 October 2016Global warming theory isn't falsifiable
Kevan. Here is a comment I tried unsuccessfully to post on your blog
------------------------------------------------
Kevan.
I am new to your blog and I have just read through your series on the Carbon Cycle. Unfortunately your analysis misses some key issues and is quite wrong.
What you argue reflects the understanding of the oceans role in CO2 balance that stood during the 1st half of the 20th century. Even as late as the beginning of the 50's this was still the official view of the American Meteorological Society. However advances in oceanography and the understanding of ocean chemistry in the next few years overturned this. Your analysis does not reflect that.
Firstly, Oceanography understands ocean circulation quite well. The top 100 meters of so is very well and rapidly mixed through wave and wind actions. Below this the ocean is highly vertically stratified. Importantly this highly stratified ocean only allows extremely slow diffusion of any chemical, including dissolved CO2 for example, vertically. This has been confirmed by chemical tracer studies for example. By diffusion alone, major changes between the surface and the abyss would take millenia. However major vertical ocean currents in some regions mix the ocean more rapidly than this, but still on timescales of many centuries. It is said that a water molecule sinking to the sea floor in the North Atlantic wont return there for 1000 years. These two processes define a characteristic timescale for propagating changes from the surface to the depths. Changes on timescales of decades only impact the upper ocean.
So your simple model of 'a reservoir' is unphysical. The proportion of the ocean engaged with the surface is dependent on the timescale of the event. The 'size' of your reservoir is a time dependent value.
Secondly, most of your discussion portays the carbon in the ocean as all CO2. In one post you do mention it as being carbonate, but don't follow through with that concept.
The carbon content of the oceans, excluding biomass, is referred to as Dissolved Inorganic Carbon (DIC). It exists in an equilibrium between 4 states. Dissolved CO2 (CO2aqueous), Carbonic Acid (H2CO3), Bicarbonate ions (HCO3-) and Carbonate ions (CO3--). The balance between these four forms depends on the reaction kinematics of the respective reactions that convert between these forms.
CO2aqueous + H20 H2CO3 HCO3- + H- CO3— + 2H-
This link is a Bjerrum plot, showing the proportions of each form present depending on the ph of the water. CO2 & H2CO3 are grouped together. Note the vertical scale is logarithmic. [LINK]

Notice that most carbon is as Bicarbonate, with 10% Carbonate. CO2/H2CO3 is around than 0.5%. And note also the dependency of these concentration proportions on pH - this is the origin of the problem of Ocean Acidification.
This is actually more complex than this since ocean pH isn't just governed by the reactions above but other factors such as Boric acid concentrations. The detailed chemistry of this was first worked out in the 50's by Roger Revelle.
These chemical relations and the kinematics governing them constitute another partitioning of the 'reservoir' - different chemical reservoirs. Carbon as bicarbonate for example is only available to potentially be exchanged with the atmosphere as CO2 when the kinematics allow the reverse reactions to dominate.
So your hypothetical single reservoir needs to be considered as multiple separate sub-reservoirs separated spatially and temporally, and chemically. Only the surface/CO2 reservoir is engaged in gas exchange with the atmosphere
Your broader analysis may come to reasonable answers when applied to long enough timescales (multiple centuries) but still can be limited by the chemical constraints. So the long recovery times for a major CO2 increase presented in the scientific literature are based on these factors. Short term surface mixing processes, multi-centenial scale deep ocean mixing timescales and chemical reponses.
For instance, the truely long term response that recovers CO2 levels is chemical. After ocean mixing has done the maximum possible, there is still a remaining, slow chemical response that achieve the final draw down, on multi-millenial timescales.There is one final class of reactions that can occur in the ocean.
CO3— + Ca++ CaCO3.
Carbonate reacts with calcium ions and other minerals ions in the oceans to be deposited as things like Calcium Carbonate - Limestone. This is the final equilibration. The Carbon is deposited on the sea floor as rock.
The response to a major increase in atmospheric CO2 does give a very long timescale for recovery - centuries.
Moderator Response:[RH] Shortened link.
-
Tom Curtis at 17:36 PM on 15 October 2016It's the sun
Bill N @various, the IPCC AR12, Working Group 1, Chapter 8.4.1 says:
"Total solar irradiance (TSI) measured by the Total Irradiance Monitor(TIM) on the spaceborne Solar Radiation and Climate Experiment(SORCE) is 1360.8 ± 0.5 W m–2 during 2008 (Kopp and Lean, 2011) which is ~4.5 W m–2 lower than the Physikalisch-Meteorologisches Observatorium Davos (PMOD) TSI composite during 2008 (Frohlich, 2009)."
The SORCE/TIM home page gives an accuracy to 1σ of 350 ppm, or 0.48 W/m^2 of 1360.8 W/m^2, so I take that accuracy to be represnt one standard deviation, giving a 2σ accuracy of 0.07%. The SORCE/TIM home page also gives a"long term repeatability" of 10 ppm per annum (1σ), or 0.002% per annum, where the former is the accuracy of the absolute estimate of TSI, and the later is the accuracy of estimates of relative change in TSI from year to year.
It also says:
"TSI variations of approximately 0.1% were observed between the maximum and minimum of the 11-year SC in the three composites mentioned above (Kopp and Lean, 2011). This variation is mainly due to an interplay between relatively dark sunspots, bright faculae and bright network elements (Foukal and Lean, 1988; see Section 5.2.1.2). A declining trend since 1986 in PMOD solar minima is evidenced in Figure 8.10. Considering the PMOD solar minima values of 1986 and 2008, the RF is –0.04 W m–2. Our assessment of the uncertainty range of changes in TSI between 1986 and 2008 is –0.08 to 0.0 W m–2 and thus very likely negative, and includes the uncertainty in the PMOD data (Frohlich, 2009; see Supplementary Material Section 8.SM.6) but is extended to also take into account the uncertainty of combining the satellite data."
(Emphasis in original)
The Guidance Note on Uncertainty indicates that something is "very likely" if it has a 90-100% probability (Table 1), so we can take that uncertainty range to be the 90% uncertainty range. The reduction in the PMOD composite over that period is 0.04 W/m^2, giving an estimated reduction, with 90% confidence intervals of 0.04 +/- 0.04 W/m^2, which represents an accuracy of 0.003% relative to the 1360.8 W/m^2 estimate of TSI from SORCE/TIM. Assuming a normal distribution, a 90% confidence interval of 0.04 W/m^2 is equivalent to a 2 standard deviation interval of 0.05 W/m^2. Even allowing that the error on the estimate the IPCC estimate represents an 80% range ( the minimum consistent with their expressed likelihood) yields a 2 standard deviation interval of 0.06 W/m^2.
The current version of the PMOD composite, with monthly values estimated by taking the mean of daily values, excluding missing values) shows an OLS trend of -0.014 +/- 0.008 W/m^2 per annum (2σ error margin). The absolute difference between the Months with the lowest Sunspot Number is the respective minimums (June 1986 and Aug 2008 respectively) is -0.255 W/m^2, while that between the average of the two years is -0.219 W/m^2. The trend difference is -0.3 +/- 0.18 W/m^2. Expressed as changes in forcing to two significant figures, these values are -0.04 W/m^2, -0.04 W/m^2 and -0.05 +/- 0.03 W/m^2 respectively. It appears, therefore (and is confirmed by the IPCC 8.SM.6), that the value expressed by the IPCC is the absolute difference between the relevant years expressed as a forcing rather than as TSI. Expressed as percentages of the 2008 TSI (SORCE/TIM), they all represent 0.02% of the value, rounded to two significant figures.
The IPCC's (and PMODS's) stated accuracy is less than the relative accuracy of TIMS (by all accounts their most reliable single instrument) if expanded over the June 1986-Aug 2008 interval, which would have an accumulated error of 0.6 W/m^2 (or 0.11 W/m^2 expressed as a forcing; 2σ error margin). This is in part due to the fact that typically (and always from 1986 to 2008) at least three space borne instruments have observed TSI at any given time. This is important, both because the drift in satellite instruments is unlikely to be synchronous, and because multiple measurements reduce error (as errors are summed in quadrature).
More importantly, in developing PMOD, each satellite record of TSI was fit against the square root of the Sunspot Number (SSN), which then provided a framework to develop the composite TSI record. In that way, the superior accuracy of the SSM record is used to overcome the deficiencies of the satellite record. Because of this use of the SSN, and because of the use of multiple instruments observing simultaneously, no consideration of innate instrument accuracy alone can correctly characterize the error in TSI observations.
The use of SSNs by PMOD also indicates that belief in the decline in solar intensity is not based on satellite instruments alone. Indeed, the SSNs show a trend of -3.09 +/- 1.33 per annum (2σ range). Given that you accept the accuracy of the SSN record, and accept a high correlation between SSNs and solar intensity, that should mean you also agree that solar intensity has declined over the last four decades, although we may be in doubt as to just by how much.
In the mean time, and with respect, you retain effective anonymity so your authority on this or any topic (as is mine) is just that of "some random guy on the internet". Even if we take your claimed credentials and expertise on face value (as I am inclined to do), those credential and experience are no better than those of the teams of scientists working on individual TSI instruments, composites, and in reviewing the data for the IPCC. Given that, I see no reason to give your beliefs on this matter particular credence.
-
Eclectic at 15:06 PM on 15 October 2016It's the sun
Bill N , surely you are capable of conversing with 2 people, rather than only 1 .
I certainly don't wish for you to waste your time arguing with yourself about whether there has or has not been any ad-hominem attack on you - for as far as I can see, there has been nothing of any personal attack against you, of any sort.
You have been asked to supply a logical coherent reasoning, showing that the standard science (accepted by all climate scientists) is somehow wrong. You have failed to do so - thus far, anyway.
Therefore please put aside your deflections and diversions about ad-homs; put aside your rhetorical assertions and quibbles about satellite instrumentation - instrumentation which is a very small part of the total picture of climate science.
Whatever cogent ideas you have, I am sure our readers here would be delighted to see them. If they exist, of course. Likewise it would be gratifying to know something of these [your quote] "bonified scientists" (not bonified* in the cranium, surely ??! :-P ) and their contrarian ideas. Contrarian ideas which so far seem uncirculated in the scientific realm (or pehaps are simply not cited . . . which says something in itself) .
So, Bill N , please proceed rationally. For myself, I am keen to see anything useful you can provide.
* Bill N , please note that these comments columns have no SpellChecker . . . so you misspell at your peril. "Bona fide" humorous efforts are always welcome, though !
-
Bill N at 13:22 PM on 15 October 2016It's the sun
OK Micheal and Eclectic. Now I am going to have to ask the moderators to get involved for your "dog piling" and ad hominum attacks, which are clear rule violations at this sight. Your discussions have degenerated from bonified scientific debate to childish antics.
Michael, you have no idea what I do or do not know about this subject. My views are formed from refereed publications and books on this subject. Eclectic, I take personal afront of your claims that I just made my opinions up from thin air. If the both of you have a problem with the emerging views and findings of an ever growing number of bonified scientists showing that the observed global warming is solar induced, you should take it up with them. Don't shoot the messenger. I will not argue any further with you two.
My primary purpose here is to state that in my area of expertice, namely optical instruments, the claim that the satellite instruments have successfully measured that the solar TSI has not gone up since 1978 (even gone down a little), is completely bogus. That then shoots down a major cornerstone used by folks claiming that the observed warming must be due then to manmade greenhouse gas emissions.
-
ianw01 at 12:10 PM on 15 October 2016The future belongs to clean energy
Here is an attempt at a concise summary of what I have found so far, though I'm still concerned that intermittency of wind is a bigger problem than is generally thought.
nigelj: That article is a bit too optimistic relative to the analysis it provides for me (as you might expect!) but it did cite a link where it stated that "a highly renewable ... system ... could meet or exceed regional demand 99% of the time". That sounds nice until you follow the link and look at the chart and realize that those scenarios include coal, nuclear and plenty of CCCT (combined cycle combustion turbine) out to 2050. That chain of claims reminds me of amusing tales of how the truth gets modified as people report to their bosses, resulting in vastly differing stories between the shop floor and the CEO. Trust but verify. :-)
There is an excellent series of articles at scienceofdoom.com such as this one which covers grid stability with higher wind penetration. See the whole series there on renewables - well worth the read!
The best take-away from scienceofdoom.com regarding this thread of discussion is the following summary of the thorough JP Morgan report comparing decarbonization of Germany and California:
Basically, they reach their conclusions from the following critical elements:
- energy cannot be stored economically
- time-series data demonstrates that, even when wind power is sourced over a very wide area, there will always be multiple days where the wind/solar energy is “a lot lower” than usual
- spend a crazy amount on storage
- build out (average) supply to many times actual demand
- backup intermittent solar/wind with conventional
- build a lot of nuclear power
These are obvious conclusions after reading 100 papers. The alternatives are:
- ignore the time-series problem
- assume demand management will save the day
- assume “economical storage” will save the day
Many papers and a lot of blogs embrace these alternatives.
The comments in that article include a discussion of a "box-canyon scenario" where we go headlong down a wind + solar path that does not in the end provide a route to the desired CO2 reductions. It is worth thinking through those possibilities.
Finally, on the Ontario front you can see this year's generation costs quoted here (with a grain of salt given the source). In CAD cents/kWh solar is 48.1, wind 13.3, gas 14, hydro 5.7, nuclear 6.8. That makes for an interesting backdrop for (a) a recent refurb plan that would bring nuclear up to 16.6 cents/kWh over 10 years combined with (b) the recent cancellation of additional wind generation plans. My (biased?) hunch is that wind intermittency would have made for some difficult challenges to operate the system when wind output was minimal, although others do argue that the nuclear industry is well entrenched in Ontario and stands to benefit more from that investment. A combination of the two also seems likely.
Hopefully that draws some of the loose ends that I raised to a close here (although not definitively, I admit).
My remaining to-do item is to get deep enough into Jacobson's reports to get a handle on how intermittency was managed in a representative northern inland US state. Hopefully I can convince myself that the modeling was able to plausibly get past this intermittency issue.
-
michael sweet at 12:04 PM on 15 October 2016It's the sun
Bill:
Here is the illustration of human fingerprints. These fingerprints show that warming is caused by carbon pollution and not the sun.

-
Eclectic at 11:32 AM on 15 October 2016It's the sun
Bill N . . . my apologies for not completely following your chain of logic. Surely there must be some factor I am overlooking?
You have said there is no clear evidence (from the satellite measurements) that TSI has increased or fallen, since 1978. As to TSI in earlier times : observed sunspot activity has less than perfect correlation. And ice-core and tree-ring proxies are based on a deposition of certain isotopes - an isotopic deposition suffering considerable variation from changes in terrestrial magnetic field and changes in atmosphere circulation.
It is well established that there has been rapid global warming in the last 50 or 100 years. And the general scientific view is that that change is well explained by the radiative properties of CO2 (and other greenhouse gasses) .
Yet you yourself feel that possibly there has been a relatively large [ 0.1% or greater ] rise in TSI over the past century or two, and which possibly may have caused all the recent warming.
In addition, you will somehow have to abolish the warming effect of CO2 and other greenhouse gasses, in order for your proposed (but not demonstrated) large and rising increment of TSI to do its work in heating up the Earth. On top of that, you will need to explain away the observed diurnal and climatic changes mentioned by Michael Sweet (above) .
Bill N, your line of argument does not hold together.
So there must be some other factor which I have overlooked?
-
michael sweet at 09:47 AM on 15 October 2016It's the sun
Bill,
It strikes me that you are speaking with a great deal of confidence for someone who has not read very much about AGW.
In the Scientific Guide to Global Warming Skepticism, there is an illustration at the bottom of page 3 that shows why we know without doubt that the warming is due to carbon dioxide and not the sun. If the Sun was causing warming we would expect days to warm faster than nights, summer faster than winter, the stratosphere to warm with the troposphere, the same amount of heat to be returning to Earth as backradiation, the same heat escaping to space and several others. We measure that nights are warming faster than days, winter is warming faster than summer, the stratosphere is cooling as the troposphere warms, more backradiation, and less heat is escaping to space. You will have to counter all of these observations if you wish to support your claim that unmeasured TSI increase could be the cause of warming.
I suggest that you forget all the propaganda that you have read at WUWT and other skeptical sites and try reading the Newcomers Start Here post on the home page. If you continue to post here with claims supported only by your opinion you will not get very far. Your opinion as an engineer about TSI measurements does not count much against the observations I have summarized above. It is not necessary to have any TSI measurements to be sure that the warming is caused by carbon dioxide pollution and not the Sun.
Keep in mind that the warming caused by carbon dioxide pollution was predicted in 1896 by Arhennius. Arhennius predicted most of the observations that I listed above 100 years before they were measured. You are countering a 120 year old scientific prediction with an ad hoc explaination that has a great deal of evidence against it and no measured support.
-
kevanhashemi at 09:35 AM on 15 October 2016Global warming theory isn't falsifiable
We can falsify the claim that our CO2 emissions will double the concentration of CO2 in the atmosphere in the next one hundred years using the fact that cosmic rays create roughly 8 kg of carbon-14 every years. See here:
http://homeclimateanalysis.blogspot.com/2016/10/falsification-of-anthropogenic-global_39.html
-
nigelj at 09:24 AM on 15 October 2016Caring for Creation makes the Christian case for climate action
Dikran @26, I smiled at your wikipedia information on hooning around in a car. I come from New Zealand, and as the article notes the term originated in New Zealand and Australia. Do you know how we deal with "boy racers" who cause a real nuisance? We passed a law allowing their cars to be crushed.
I certainly agree about interpreting the Bible with some flexibility, at least in this sense: The Bible has clauses promoting social justice and also making money, so whoever wrote the Bible had both in mind. The only rational interpretation is we should do our best to balance both. The only way of interpreting the Bible as a whole is rational, balanced insight, otherwise you end up simply ignoring entire clauses on rather arbitrary grounds.
I think you mean burning fossil fuels now might not be seen as selfish if it helps the poor "now”? This is of course what some climate sceptics argue. And there would be a cost on the poor now, but some form of income redistribution could counter this. And burning fossil fuels now is a burden on everyone in all future generations, and this is the greater issue and it would be selfish to ignore this.
-
gws at 08:14 AM on 15 October 2016Science does inform policy making … sometimes
ABC News had an article too: Powerful Greenhouse Gases in Focus at Global Climate Meeting
-
nigelj at 07:09 AM on 15 October 2016Hillary Clinton and Al Gore talk climate and energy in Miami
Moreover @5, I largely agree. Clinton's campaign donors probably include fossil fuel companies, and they will have certain expectations that she not move too much on climate change.
In contrast Trump is more self funding, so in theory is less captive to lobby groups, but Trump is a climate change denialist. This is such an unfortunate and ironic outcome.
Clinton is also a consensus seeker / compromise type of person which has both its merits and problems. It’s fair to say the entire American system was designed to promote this style of politics. However it makes for slow work of dealing with climate change.
-
Bill N at 06:28 AM on 15 October 2016It's the sun
Hi Micheal,
You have hit the nail on the head bringing up the other measurements spanning since well before the satellite measurements. Indeed, a key reason for me "throwing out" reliance on the satellite measured TSI changes, is to force reliance on just the ground based measurements you are talking about.
These measuremnts primarily fall into two groups: accurate measurements of sunspots and faculae since around 1850; measurements of carbon-14 levels in tree rings going back much further.
On the sunspot/faculae measurements, the best solar modelling to date establishes a causal relationship between average magnetic flux in the solar outer layer (averaged over the 11yr sunspot cycles), and the "amplitude" of the sunspot cycles, with a higher amplitude meaning a higher magnetic flux. In turn, the solar modelling also establishes a causal relationship between the average magnetic flux and the TSI, with a higher flux meaning a higher TSI. Now until the latest sunspot cycle, the cycle "amplitude" (variation in areal sunspot/faculea coverage) has been observed to increase since the beginning of when such measurements were made starting around 1850. Using the latest greatest TSI vs magnetic flux vs sunpot cycle amplitude modelling, the predicted averaged TSI has increased on the order of 0.1% from 1850 to present. Based on our latest greatest atmospheric temperature modelling under solar loading, this predicts beautifully the observed solar warming of about 0.7C from 1850 to present. So there you go. Once you throw out the unreliable satellite data, then the observed global warming since 1850 is completely explained by the observed/modelled solar TSI increase, down to evidently the observed "stratospheric cooling" by including the above mentioned "atmospheric layering effect" of the natural greenhouse gas that is always present.
The carbon-14 data is used to determine past TSI levels by using modelling in which the cosmic rays inducing carbon-14 production, are partially "blocked" by solar wind production that has a known causal relationship with sunspot activity. The carbon-14 is absorbed by trees as they grow, with the tree rings giving a timeline for the past carbon-14 presence in our atmosphere. This then is used to infer past sunspot and solar wind activity, which infers then past TSI levels. The resultant historical TSI levels inferred from this technique, fit beautifully with the TSI levels based on the directly observed sunspots since 1850 to present, providing then key support for the conclusion that the observed global warming is solar induced.
With my principle goal at this website established, mainly throwing out reliance on the satellite data, the onus on folks thinking that the observed global warming is due to manmade greenhouse gas emissions, is to prove that it is NOT indeed due to a solar TSI increase since the mid-1800's, as this is the most straightforward conclusion that can be made based on the best modelling and science we have to date.
-
Bill N at 05:06 AM on 15 October 2016It's the sun
Hi RedBaron,
Unfortunately, there are scant numbers available, either from me or the instrument engineers/scientists for that matter, quantifying the degree of optical changes for some of the effects I have mentioned. That is indeed the problem.
For instance, I can assure you that no one has a handle on how much TSI is being lost by buildup of outgassing contamination on the specular optical surface of the cone traps of these instruments. Outgassing of even "clean" materials can be significant over time, with for instance even MIL-SPEC anodized aluminum coatings (typically used to make baffle chambers from) significantly varying in outgassing from one production batch to another, and from one type of cleaning procedure to another. Even though the FOV (Field of View) of the instrument picks up only a small fraction of the solar disk, so that the solar light intensity at the cone is only a small fraction of the full TSI, the instrument has to stay on for a while in order to come to thermal equilibrium when making a measurement (thermal equilibrium under loading is the basis for making the measurement). The result is that over time, the integrated solar power is enough to "fry" the contamination many many times over, turning it into diffusely reflecting "gue." No objective experienced optical engineer would ever be comfortable making the claim that even this one effect was contained within the required <0.01% degredation level, not without extensive testing such as use of the groundbased twin witness instrument placed in a vacuum and hit with a solar simulator. Even then, outgassing distributes differently when in 1g on Earth and weightless in space, so use of the witness to quantify this effect is "sketchy" at best (assuming the same production run and cleaning procedure was used for the chamber materials of both).
I hope the above example gives you a feel for what you're up against when attempting to achieve <0.01% optical stability. I can tell you that in the business, the way the game is played when such dramatically small radiometric stability errors are required, is that the instrument builder/user must prove that it is that stable, not that those of us that scoff at their overblown claims must come up with numbers indicating that it is not.
-
gws at 04:37 AM on 15 October 2016Science does inform policy making … sometimes
This is currently in the news again, though overlooked by many outlets:
VOX: The biggest climate change story in the world this week is quietly playing out in Rwanda,
Reuters: U.S. optimistic climate deal will cut HFC gases
Suffice it to say, these are critical negotiations.
I want to highlight that the Vox article author made one big mistake when he said
Basically, we accidentally swapped one environmental problem for another. Oops.
As I wrote in my article above, the replacements of CFCs with HCFCs, then HFcs was no accident. The industry knew what it was doing, and teh scientists told them that one day these gases would become highly important. So "oops" maybe, but certainly no accident ...
-
Bill N at 03:43 AM on 15 October 2016It's the sun
Hey again @Eclectic. I decided to make a separate post on the stratospheric cooling issue to keep the TSI instrumentation optical stability postings separate.
My background for this issue: Masters degree in Physics. As an optical engineer, developed and/or utilized thermal modelling of spaceborne instruments and spacecraft that were heated by the Sun and cooled by their emitted IR radiation, determining then their internal and surface temperature environments under solar variations induced by spacecraft orbital and orientational changes.
Opinion on maturity of science: As far as I can tell, the science and modelling of solar induced warming of our Earth, especially when combined with the influences of greenhouse gasses present (manmade or natural), has not matured to the point to be able to definitavely conclude that the observed temperature distributions in our atmosphere indicate that manmade greenhouse gas emmisions are responsible for the observed global warming as opposed to a long term TSI increase. Heck, even a few years ago the "official" (IPCC) position was that solar TSI changes had essentially no influence on the Earth's temperature. Only recently then has the science matured to the point that it is now understood that long term TSI changes could indeed significanly change the average Earth temperature. Having only just found this out, claims then that the science has matured so rapidly since this discovery as to be able to distinguish between TSI based changes in our atmosphere and greenhouse gas based changes, seems highly dubious.
"Mixing" issue: Has the recent modelling included the effects of "chaotic mixing" of the stratoshere with the rest of the atmosphere. After all, this is long term warming we are talking about. Certainly the daily winds will "churn" the entire atmosphere to the point as to "swamp" layered atmospheric temperature predictions of one model vs another.
Greenhouse gas perturbation: Assuming that the above "mixing" issue has been properly accounted for, there is still the issue of greenhouse gas induced perturbation in the atmospheric temperature distribution. This will occur even if a solar TSI increase is causing the warming. So when modelling solar induced heating, the "atmospheric layering effect" of the natural greenhouse gasses present must still be included. My suspicion is that this is not being done by the folks attmpting to differentiate between solar and manmade greenhouse gas warming. It is simply a mistake then to model solar warming without including the "atmospheric layering effect" of the natural greenhouse gas that is always present. Once this effect has been properly included in the modelling, I strongly suspect that there will not be a significant difference between the predicted stratospheric cooling of the solar warming model and the manmade greenhouse gas model. As is well understood, long term geologic records show that natural greenhouse gas levels will indeed rise and fall with the Earth's temperature, regardless of the reason for the temperature change. So even if the warming is solar induced, don't forget to include the measured increase in greenhouse gas levels that go along with it.
Opinion: So IMHO, it can not be concluded at this point in our science and modelling, that the observed stratosperic temperatures indicate that the warming is due to manmade greenhouse gas increases as opposed to solar warming.
-
michael sweet at 03:02 AM on 15 October 2016It's the sun
Bill,
In the graph of TSI in the intermediate OP their data goes back to 1880, well before satellite measurements. In the link to their data (Krivova 2007) they describe a model that estimates the TSI based on a series of ground based measurements. I am not expert like you, but it seems to me that your argument that the satellites are not stable enough for the displayed data is moot since the data is not satellite based. Perhaps they use the satellites to ground truth the model? Can you address the issues with the model used to generate the graph of the data? Obviously it is best if you have a direct measurement but for the period before satellites you have to use the data you have and a model. The described calibration issues of the satellites are much higher than the changes in the TSI over the period of observation. Since it is based on ground measurements can the model be used to correct the calibration errors of the satellites?
It seems reasonable to me that if you had 30 years of satellite data you could calibrate a model that would generate data covering the period before you had the satellite data. For the climate argument they do not require the model to be absolutely correct, they only need relative TSI to determine if the warming correlates with TSI.
In the linked data source they describe several models of TSI that are used to generate data over various time periods before we had satellite or ground based machne based TSI measurements.
-
Bill N at 02:04 AM on 15 October 2016It's the sun
Hello "Eclectic". You are spot-on correct about me making no claims about either increased or decreased TSI being reliably measured by these instruments. I am simply saying that this "data point" does not exist, one way or the other.
As for ground instruments, even if they could be reliably calibrated to the 0.01% stability requirement (which in itself is dubious), the atmospheric induced variablities in ground based TSI measuement are enormous compared to the stability requirement, even if averaged over time. I am unaware of anyone that has established the ability to reliably ground measure long term TSI changes to the precision required.
As someone who spent a career dealing with optical stability issues, I can not overemphasize just how dramatically difficult it is to achieve 0.01% long term optical stability of radiometric instrumentation, even under the best of circumstances. Some scientists believe their instruments are a lot more optically stable than they are, and then we engineers have to present them with the "realities" of practical radiometry "in the field" to set them straight (I'm not picking on scientists here, oops, maybe I am, hehe). I hope some of the TIM folks aren't making any "overblown" claims about their instrument, or the similar previous ones. It seems though that some do indeed appreciate the difficulties involved, to the point of saying "it's not reliably stable enough."
I'll address the stratospheric cooling issue in my next post.
-
RedBaron at 01:49 AM on 15 October 2016It's the sun
Bill,
Could you put some numbers to that delta uncertainty please. Clearly as my post shows, they are making calibration adjustments (obviously at least in part due to the reasons you posted) and have quantified their estimate of long-term relative uncertainties. Where are your numbers? And how much difference between yours and theirs?
Thanks
-
Bill N at 01:05 AM on 15 October 2016It's the sun
Greetings "RedBarron". What you posted does not address the long term optical stability issue. There is no onboard instrumentation that can test for optical changes over time (see below for a caveat). The quoted long-term relative uncertainties of 10ppm/yr for the TIM have nothing to do with the continual optical changes due to environmental factors such as outgassing, dust, and sunlight induced degredation of the conical specular refelectors used. This is why use is being made of a ground vacuum witness under simulated solar impingement in order to finally get a handle on this. If you don't believe me, just look at what is being said about stability by some of the very engineers and scientists who fly these instruments. Finally, to obtain a time frame long enough for reasonable assessment of whether the average TSI is changing (over time constants longer than the 11yr solar cycles of course), use is required of the similarly designed radiometers prior to TIM use. Again, there is no way that the whole "daisy chain" of these instruments can be relied upon to the level of stability required. Note we are not talking about absolute calibration here, since each instrument in the series is calibrated against the ones already flying to measure TSI changes. But if they are all experiencing optical changes over time (at levels smaller than what can be detected by the absolute calibrations, but plenty large enough to swamp the long term stabiliy requirement), there is no way to know that.
The UV channel of the TIM spectrometer can though indirectly measure long term solar changes accurately, due to its use of a large number of reference stars in order to measure its sensitivity changes over time. But at present, solar science may not be mature enough to predict TSI changes based on purely UV changes (I far as I can tell). Perhaps if an instrument were flown that could use a similar "many-star" based calibration technique across a number of visible wavelengths, then the changes in our Sun's TSI could be reasonably inferred. But at present, even if the TIM UV channel could be used to infer TSI changes, it has not flown nearly long enough to quantify what these changes are.
-
moreover at 01:03 AM on 15 October 2016Hillary Clinton and Al Gore talk climate and energy in Miami
Tim DeChristopher was quoted on the Hillary/Gore event on Oct. 12. DeChristopher is the founder of the Climate Disobedience Center (http://www.climatedisobedience.org/) and is featured in the award-winning film “Bidder 70.”
He said: “While our political leaders are pretending that being better than Trump is an adequate response to the climate crisis, the climate movement is boldly stepping up to the unprecedented challenge of climate change with courage and commitment. Just in the past few days since the presidential debate ignored climate change, there have been several bold acts of civil disobedience around the country. The sustained resistance to the Dakota Access pipeline at the Standing Rock reservation in North Dakota had 29 people arrested on Monday for refusing to back down in the face of increasing repression and state violence. Four activists in New York spent all day Monday occupying the Spectra fracked gas pipeline that will run right next to the Indian Point Nuclear Power plant. Then Tuesday, activists in four states shut down all five tar sands pipelines entering the U.S. from Canada. Ten people involved in that action remain in jail right now with bails that range from $5,000 to $75,000.
“There is a stark divide between the politicians who seem incapable of thinking about the climate crisis outside of the boundaries of old assumptions about political feasibility and the activists who are making real sacrifices to treat climate change like the unprecedented crisis it is. Al Gore is campaigning for Hilary Clinton without questioning her extreme support for fracking and fossil fuel infrastructure expansion, while Al Gore’s own daughter, Karenna, is currently facing a potential two and half year jail sentence for protesting fracked gas pipeline construction in West Roxbury, Massachusetts.
“Too many failed centrist attempts to address climate change without standing up to the fossil fuel industry have taught honest pragmatists that we simply can’t deal with climate change in a non-confrontational way. Those failures have brought us to this point of record-breaking climate impacts. As the climate crisis quickly intensifies, the climate movement is committing to intensifying our efforts to defend a livable future, as yesterday’s huge pipeline shutdown demonstrated. We hope that our political leaders will join us.”Source: http://www.accuracy.org/release/climate-beyond-trump-and-gore/
-
Eclectic at 00:03 AM on 15 October 2016It's the sun
Bill N @1172 . . . presumably for the same reasons, you are equally skeptical that TSI could have been shown to have "risen" significantly since 1978.
And then there's the matter of stratospheric cooling since 1978 ~ which also seems to suggest that the TSI has not risen.
And the cumulative and aggregate effect of data from ground-level instruments which are properly maintained.
All in all, "it doesn't seem to be the sun" . . . would appear to be quite correct.
-
RedBaron at 23:33 PM on 14 October 2016It's the sun
Data Quality Description
On-orbit instrument characterization is an on-going effort, as the TIM team regularly tracks instrument degradation and calibrates the instrument servo system on-orbit, periodically updating the data processing system with new calibration values. Only minor corrections are anticipated at this phase in the SORCE/TIM mission. To date the TIM has shown lower degradation than any other flight TSI instrument, and long-term relative uncertainties are estimated to be less than 0.014 W/m^2/yr (10 ppm/yr). At-launch absolute accuracy is estimated to be 0.48 W/m^2 (350 ppm), largely determined by the agreement between all four TIM radiometers. The 4.5 W/m^2 by which the TIM read lower than prior instruments at the time of launch has been resolved as being largely due to internal instrument scatter in those prior instruments causing erroneously high readings (see Kopp & Lean, GRL, 38, L01706, 2011). Most of those other instruments have now corrected (lowered) their values, and are now in very good agreement with the SORCE/TIM. -
Bill N at 22:54 PM on 14 October 2016It's the sun
There is no way that the satellite instruments measuring TSI are stable enough to make any claims one way or another about its change since they have been flown (1978 to present). So the belief that TSI has been stable or even gone down based on these measurements is a myth.
Stability requirement: As is understood, a change on the order of 0.1% in TSI could yield the observed average warming. So in order to use these instruments to successfully state that this is not happening, they would need to be stable by <0.01% !!!. This is this stability requirement stated by the instrument engineers and scientists themselves (see for instance the Wikipedia "Solar irradiance" article, and then click on links to articles written by the instrument engineers/scientists). Mind you, this requirement needs to be satisfied over the entire series of instruments flown since 1978, with the change in TSI "passed through" several of these instruments to the present, using each instrument in the "daisy chain" to calibrate the next one.
Community stability assessment: In the community of engineers and scientists that actually build and fly these instruments, there is a high degree of skepticism that they are stable to the 0.01% requirement (or even anywhere close to this). Just Google the subject of satellite TSI instruments, or fan out from the Wikipedia "Solar irradiance" article, for yourself.
My background: I was an optical instrument engineer for my entire career, with a lot of that time working as a contractor for NASA GSFC (such as working to fix the Hubble telescope). I designed, built, and calibrated flying instruments, as well as the instruments used to test same. A considerable amount of my time was spent dealing with issues affecting the long term performance of optical instruments, including radiometric stability. With this experience, I was constantly called upon by NASA to evaluate the instruments built by others. If NASA had used GSFC to fly these instruments, as it "should" have done since it is GSFC's pervue to fly any unmanned bird within the bounds of lunar orbit, there was a fair likilyhood that the long term stability assessment of these instruments would have ended up on my desk.
My stability assessment: Any optical engineer with any radiometric experience whatsoever, would ROFL if you claimed that you had a radiometric instrument stable to <0.01%, let alone a whole "daisy chain" of them flown over decades in space. This is certainly true after examining the design of these instruments (active cavity electrical substitution radiometers), and the environment in which they operate. Leaving the electronics aside, there is no way that these radiometers could be assumed to optically stable to 0.01%, or anywhere near that performance. OMG, your hitting the radiometric cavity with full vacuum sunlight. Do you have any idea what that does to any optical surface over time? Also, no matter how careful you are, there can and will be outgassing from the internal surfaces of the instrument cavity (especially all that baffling), which will collect on the (designed) specular surface of the light cone used trap the light. When the sunlight hits that contamination, it will "fry" it, causing "globules" that will increase the diffuse reflectivity of the cone over time, thereby decreasing the amount of specular light absorbed by the cone, and therefore its sensitivity. This is something we intrument engineers have seen time and again with spaceborne instruments measuring full sunlight. The present generation has some accompanying ground "witness instruments" that are twins of what is being flown, and the engineers/scientists have wisely put one permanantly in a vacuum chamber along with a solar simulator to measure its long term stability under the expected conditions. But this measurement is still in progress (in my understanding), and I'll bet my last dollar that this witness won't even come close to being stable enough.
-
Dikran Marsupial at 21:11 PM on 14 October 2016Caring for Creation makes the Christian case for climate action
"Seems obvious to me."
It isn't exactly rocket science, is it? ;o)
Unfortunately acting on it is more difficult as we generally don't know our neighbours desires and requirements (they generally don't either, any more than we really know ours), which is why we need to have some flexibility, rather than dogma about it. If we can make the world a better place in the future by using fossil fuels now, e.g. by raising the standard of living or reducing inequality, then it is not clear that fossil fuel use today (primarily for our immediate benefit) is entirely selfish. It is a bit more difficult to argue that hooning about in a muscle car is an entirely unselfish activity.
-
Glenn Tamblyn at 16:17 PM on 14 October 2016Explainer: Paris Agreement on climate change to ‘enter into force’
ELIofVA
The Paris AGreement is under the auspices of the The United Nations Framework Convention on Climate Change (UNFCCC)
"The United Nations Framework Convention on Climate Change (UNFCCC) is an international environmental treaty negotiated at the Earth Summit in Rio de Janeiro from 3 to 14 June 1992, then entered into force on 21 March 1994."
The US is a signatory to the convention, so it has already signed and ratified that threaty long ago. That step required Congress. Now agreements entered into within the treaty aren't then regarded as new treaties, but simply part of an existing treaty. My understanding is that under US law that does not require Congress.
Additionally the national targets are intentions, not strictly binding; there is no enforcement mechanism. -
One Planet Only Forever at 13:53 PM on 14 October 2016Hillary Clinton and Al Gore talk climate and energy in Miami
nigelj@3,
The EPA is a great idea. However, it can be hobbled by a lack of funding. And right now the Republicans control the House of Representatives which controls funding.
So what is required is a legal obligation for an EPA group to be guaranteed the funding required for it to properly perform its duties. And that legal requirement would need the teeth to remove from office any official, incluing elected representatives, that can be shown to have participated in r supported efforts to try to limit the funding of the EPA. And the law woule need the teeth and independance form influence to financially penalize anyone who tried to influence such officials.
-
scaddenp at 13:07 PM on 14 October 2016Explainer: Paris Agreement on climate change to ‘enter into force’
Why do you believe that we have "irreversible rapid climate change" even if world manages to reduce CO2 emissions? There is committed warming obviously, but irreversable? Reduce the CO2 in atmosphere and temperatures will drop.
-
denisaf at 12:40 PM on 14 October 2016Explainer: Paris Agreement on climate change to ‘enter into force’
This article about policy decisions of countries is anthropocentric blathering at the highest level! The stark reality is that the best that can be done by reducing the global rate of greenhouse gas emissions as quickly as is physically possible is to slow down the irreversible rapid climate change and ocean acidification and warming. What is really needed is a global focus on measures to cope with such consequences as sea level rise.
-
nigelj at 12:21 PM on 14 October 2016Hillary Clinton and Al Gore talk climate and energy in Miami
Good to see Clinton taking climate change seriously. Of course Clinton would face challenges if elected. Politicians may be slow to act on climate change as they are somewhat captive to their funders and popular opinion and worries about losing votes.
However America has one interesting feature, namely the EPA (Environmental Protection Agency) which appears to be semi autonomous or independent of politicians, in the way the American system typically divides up power. The EPA has declared carbon dioxide a pollutant, and required various regulatory measures to be taken (to howls of protest from the Republican Congress, but they haven’t been able to overturn the regulatory measures).
The EPA might be a good approach for other countries to take, if politicians are worried about public reaction to climate change policies, as it hands decisions to technocrats tasked with simply protecting the environment.
The EPA does not appear to stop politicians promoting additional protections, but Obama has met resistance on this from Congress. But at least the EPA is there doing something in the background.
However the EPA can only regulate. Only politicians can introduce something like a carbon tax or emissions cap and trade scheme. So good luck to Clinton, if elected.
-
nigelj at 07:32 AM on 14 October 2016Caring for Creation makes the Christian case for climate action
"[The] basic theme of the new testament is that we should try to be a bit more unselfish and a bit less selfish"
Couldn't agree more. Seems obvious to me.
"The ethics of the New Testament is indeed to "love your neighbour as yourself"
Very true and a basically useful teaching. I would say the teaching to love thy neighbour as thyself would presumably include your neighbours children and arguably their own future children and so on. If not why not? I can't think of a viable reason, that doesn't fall into the category of selfishness.
-
ELIofVA at 06:22 AM on 14 October 2016Explainer: Paris Agreement on climate change to ‘enter into force’
I am confused about the statement, "On 3 September, the US and China jointly ratified the agreement.". I remember this in the news. However, how can Obama claim ratification without the approval of congress? Is the USA claiming to be one of the countries ratifying? Most people believe any climate deal could not be passed in Republican controled Congress.
-
johnthepainter at 02:55 AM on 14 October 2016Hillary Clinton and Al Gore talk climate and energy in Miami
Wow! An actual discussion of the most important issue in the campaign. I saw brief images of Hillary and Al Gore at this rally, accompanied by speculation about why Hillary had Al Gore with her and how that would help her, but I didn't seen any broadcast of theactual presentation, in which Hillary got everything right. And that's in contrast to the way all TV news stations, as well as CNBC, interrupt their programs to carry Donald's rants.
-
Tom Curtis at 01:38 AM on 14 October 2016Caring for Creation makes the Christian case for climate action
Dikran Marsupial @23, the Golden Rule, "Do unto others as you would have them do unto you", is not in fact equivalent to the the second of the two commands identified, first by Hillel the Elder, and later by Jesus as "being the whole of the Law", ie, "Love your neighbour as yourself". In practical terms, their guidance will often coincide, but the later requires far more than the former; and even more than the negative form of the Golden Rule ("Do not do to others what you would not have them do to you") taught by Hillel the Elder, and tracable to long tradition going back to Confusius circa 500 BC.
Taking account of pragamtics, and in particular conversational implicature, the negative version only enjoins that you do no harms to others, that you would not have them do to you. In contrast, the positive version requires you to do any good to others that you would have them do to you. In simple terms, consistent with negative version, you can ignore the want of the beggared blind person, so long as you do not steal from their bowl; whereas the positive version requires you to give aid to that person, at least if you in a similar circumstance would also desire aid.
In contrast, unless we take it to be hyperbole, the command to love your neighbour literally requires that you consider a given gain by your neighbour as valuable to you as the equivalent gain to yourself; and a given loss by your neighbour as undesirable as an equivalent loss to yourself. Or in the wors of Laoze (also circa 500 BC):
"Regard your neighbor's gain as your own gain, and your neighbor's loss as your own loss."
Of course, there is no reason to regard that command as hyperbole on Jesus' lips beyond the difficulty we would have in satisfying the command. Certainly, the more specific principles espoused on the Sermon on the Mount are only inconsistent with the command in seeming to undervalue yourself relative to your neighbour, so unless you ascribe all of Jesus' ethical teachings as hyperbolic (which precludes any possibility that your interpretation is based on context), you are left with the command to love your neighbour haveing the strict form I indicate.
Specifically with regard to the discount rate, it consists of three parts. The first is the expected return on an arbitrary investment. If we can expect a 3% return per annum by simply investing in the stock market, we may reasonably expect a similar return from investment in mitigating and adapting to climate change, and therefore should include that as part of the discount rate. Further, it is permissible to discount based on uncertainty of outcomes (although given the long tail of uncertainty, that actuall adds a premium rather than a discount in the case of climate change). Finally, there is the pure rate of time preference, ie, the fact that we prefer to have our benefits here, and now rather than at some distant time in the future. Consistent with the command to love your neighbour, that part of the discount rate must be zero, for it is impermissible to preffer the current generation over future generations.
-
Tom Curtis at 01:10 AM on 14 October 2016Temp record is unreliable
pink @397, using data from the site which provided the data for your chart, and calculating an 11 year running average of montly sunspot numbers from 1750-2016, 1883 is at about the 20th percentile, and about 70% of the mean sunspot number. Neither of these is consistent with 1883 being a grand solar maximum.
With respect to Laki, I repeat, it occurred prior to the Dalton Minimum. Indeed, 1783 is in the 98th percentile of sunspot numbers, with 1.56 times the mean number of sunspots. Arguably that makes it grand solar maximum, but solar astronomers do not so describe it, presumably due to the brevity of the peak.
Your persistent ascription of voclanic eruptions to minimums when they are more likely to lie in a maximum, and to maximums (ie Laki), when they are quite ordinary years (ie, Krakatoa) shows your theory is not emperically derived. Further, because of the low forcing associated with fluctuations in the solar cycle, only persistent large fluctuations (positive or negative) can plausibly result in increased volcanic activity. Your wanting to ascribe Krakatoa to a maximum suggests you care nothing for that, giving your theory all the hallmarks for a deux ex machina for a "anything but CO2" paradigm. That is, your only evidence for your theory is that you want to believe it to be so to avoid believing that increasing CO2 is likely to have a significant impact on globat temperatures.
Moderator Response:[PS] This is offtopic. No further responses to Pink here on sunspots and volcanoes. Pink, if want to discuss "its not us" myths, then perhaps here (sunspots) or here (volcanoes)
And dont even think of making another assertion without backing your claim ( eg a link to a specific claim or evidence to support your argument). I'll delete your entire comment.
-
Dikran Marsupial at 22:57 PM on 13 October 2016Caring for Creation makes the Christian case for climate action
Tom wrote "Put simply, the only valid discount rate permissible in the NT gives a pure rate of time preference across generations of 0"
I'm not sure I completely agree with that. The idea is that we should treat others as we would like to be treated if we were in their position. It seems fair that richer societies should not be subsidised by poorer societies, so if societies become richer over time it doesn't seem unfair to me to forgo a bit of that increase in wealth to solve problems for a previous generation. So a rate other than zero (if I understand it correctly) could at least be neutral from a "golden rule" perspective.
Prev 474 475 476 477 478 479 480 481 482 483 484 485 486 487 488 489 Next


