


 Arguments


Recent Comments
Prev 495 496 497 498 499 500 501 502 503 504 505 506 507 508 509 510 Next
Comments 25101 to 25150:
-
bozzza at 19:28 PM on 11 February 2016No climate conspiracy: NOAA temperature adjustments bring data closer to pristine
@27, I have found the most fun to be making deniers refuse to acknowledge the term 'multi-year sea-ice'.... they keep trying to dismiss you with a time series of sea ice!
I love spilling coffee....what can I say!
-
bozzza at 19:25 PM on 11 February 2016No climate conspiracy: NOAA temperature adjustments bring data closer to pristine
Adjustment is not allowed, ever. Nothing vibrates and stagnation is not close to death.... the industrial revolution just happened mannnnnnnnnnnnnnn!! Yay, i can do i-phone graphic design and am not standing on the shoulders of any giants: no mum, promise etc.....
~;^>',,,,<
-
Kevin C at 19:18 PM on 11 February 2016Hansen's 1988 prediction was wrong
planet8788: Accoding to Meinhausen et al, the Montreal gas forcing (CFCs etc) peaked at about 0.32 W/m2 and is projected to drop to about 0.2 W/m2 by 2050. Do you disagree with those figures?
-
Tom Curtis at 15:36 PM on 11 February 2016Hansen's 1988 prediction was wrong
planet8788 @41, based on Gavin Schmidt's calculation, the Hansen 88 GHG concentration trajectories would have resulted in a net forcing increase relative to 1983 of 3.35 W/m^2 for Scenario A, 2.33 W/m^2 for Scenario B, and 1.41 W/m^2 for Scenario C. The actual increase was 2.2 W/m^2, or just below Scenario B and 56% greater than scenario C. More importantly, Scenario C has a slightly declining forcing from 2000, while anthropogenic forcings have continued to rise at an approximately linear rate:

Therefore it is seriously misleading to say "we're still at Scenario C".
Further, and importantly, we are in our present position of a forcing increase slightly below Scenario C in part because of a significant, and ongoing effort to reduce GHG emissions. The correct conclusion, therefore, is not that everything will be fine, but that we need to continue, and indeed strengthen substantially those efforts. In the medium term (30 to 50 odd years), we need to bring net emissions to effectively zero. BAU will not do that. Even a continuation of current mitigation efforts will not do that.
Finally, even if we do that we will reach a mean global temperature close to 2 C above the preindustrial average. Likely even that increase will be significantly harmful, and certainly it will be catastrophic for some. It is just a much better scenario than genuine BAU which, if pursued in the long term would see the tropics become seasonally uninhabitable for large mammals (ie, humans, sheep, cattle, and dogs would die of heat prostation within a few days of unairconditioned exposure to 'normal' heatwaves under that scenario for more than a day or so).
That we are doing very slightly better than what Hansen considered the most likely scenario in 1988 is hardly a great comfort.
-
planet8788 at 15:06 PM on 11 February 2016Hansen's 1988 prediction was wrong
In fact, CFC concentrations are still going down and it looks like they have a long way to go. So that is still going to continue offsetting warming by CO2.
The ocean is absorbing more CO2 than expected. We probably don't have much to worry about. The main wildcard is methane.
-
planet8788 at 14:54 PM on 11 February 2016Hansen's 1988 prediction was wrong
Okay, So, we've increased CO2 emissions and we're still at Scenario C. So we have little to worry about. Becauses CFC emissions aren't going to go back up. CO2 emissions will probably peak by 2030...
The only wildcard is methane. And that is evolving much much slower than expected.
-
Tom Curtis at 12:57 PM on 11 February 2016The gutting of CSIRO climate change research is a big mistake
A response by the head of the CSIRO.
I think his view is wrong headed. I agree we should ramp up studies on mitigation, but:
1) The key policy on mitigation, introducing a carbon price, is already well known, and is more a matter of economics than science; and
2) The impact of more technical fixes (geoengineering) cannot be assessed without the sort of knowledge generated by the division of the CSIRO he is in the process of gutting.
Perhaps he has in mind more specific studies such as research into how to reduce methane emissions from cattle, or rice agriculture; or research into improving renewable energy sources. However, while such research is welcome, with a carbon price it will be driven rapidly by the private sector wheras the basic climate research currently being conducted by the CSIRO will not be.
This is like the reasons he gave in his original statement. Then the cuts were justified, apparently, because staff turnover at the CSIRO was less than in commercial organizations (which is not a reason at all), and because it would create a career path (but apparently in an organization in which careers will be terminated early with little prospect of alternative funding). His belief appears to be that the 9 odd years spent becoming a scientist should be rewarded with careers of a little less than that in order to encourage new students to dedicate that time for a truncated career.
It appears to me that he considers 'renewal' a good thing, without understanding that renewal must be for a reason, and too a purpose. Instead he has put renewal first as a management mantra, made massive changes on that basis with only post hoc justification at best.
-
villabolo at 12:37 PM on 11 February 2016The gutting of CSIRO climate change research is a big mistake
"Posted on 10 February 2016 by [blank]"
The author's name, underneath the title of this article was omitted.
-
Tom Curtis at 12:21 PM on 11 February 2016The gutting of CSIRO climate change research is a big mistake
The most important part of this article are the links to the petitions in the final paragraph of the Guardian version. They are with Youth Climate Coallition, and Proud to be public. Please sign one.
-
Tom Curtis at 12:13 PM on 11 February 2016Other planets are warming
sjw40364 @41, the last NASA article to which you link states:
"Even more impressive was the substorm's power. Angelopoulos estimates the total energy of the two-hour event at five hundred thousand billion (5 x 10¹⁴) Joules. That's approximately equivalent to the energy of a magnitude 5.5 earthquake."
Averaged over the Earth's surface, that represents 0.00014 W/m^2. For comparison, the reduction in release of energy from the Earth's surface due to the increase in CO2 since the preindustrial is 1.9 +/-0.19 W/m^2. Even the error term of that calculation is 1400 times greater than the "new" energy to which you point.
Worse, this is not newly discovered energy. According to NASA, the Themis spacecraft have "... made three important discoveries about spectacular eruptions of Northern Lights called "substorms" and the source of their power" (emphasis added). They have not made the discovery of substorms themselves, which are well known, and the energy of which are already accounted for in the 889,000 x 10^14 Joules from 1997-2010 (0.00035 W/m^2) discusses by Tenfjord and Ostgaard (and @34 above).
Further, it is not new energy. The Sun has had a solar wind since its inception, and the Earth a magnetic field as far back as paleomagnatism can be discerned (at least 500 million years, and probably at least 4 billion years). This energy, therefore, cannot account for the sudden, rapid rise in global temperatures over the 20th century.
Frankly, you most recent post adds nothing new to the discussion, illustrating only your determination to shut your eyes to counter evidence with regard to your pet theory. (The post before that is even worse, as it grossly misrepresents the facts with regard to warming episodes in the glacial/interglacial cycle and the temperature history of the last 25,000 years.)
-
Tadaaa at 09:10 AM on 11 February 2016No climate conspiracy: NOAA temperature adjustments bring data closer to pristine
@ 23
yes often in the same post, quickly followed by the old "trace" gas and still responible for all biotic life
Heads they win tails you loose - it's denier logic 101
-
billr at 08:26 AM on 11 February 2016The gutting of CSIRO climate change research is a big mistake
Villaboo
here you go: http://www.smh.com.au/environment/climate-change/climate-will-be-all-gone-as-csiro-swings-jobs-axe-scientists-say-20160203-gml7jy.html
-
villabolo at 06:12 AM on 11 February 2016The gutting of CSIRO climate change research is a big mistake
There's no attribution for this article. It's authored by John Abraham.
Moderator Response:[BW] Thanks for the heads-up. I added John Abraham as the author.
-
Hank11198 at 02:00 AM on 11 February 2016No climate conspiracy: NOAA temperature adjustments bring data closer to pristine
Thank you Tom. I assumed there was a good reason I didn't know about.
-
No climate conspiracy: NOAA temperature adjustments bring data closer to pristine
HK - A lovely example. As I stated on WUWT sime time back [archived link]:
It could be argued that it’s better to look at raw temperature data than data with these various adjustments for known biases. It could also be argued that it’s worth not cleaning the dust and oil off the lenses of your telescope when looking at the stars. I consider these statements roughly equivalent, and (IMO) would have to disagree.
Needless to say, this was not received well in deniersville.
-
sailingfree at 00:58 AM on 11 February 2016A Response to the “Data or Dogma?” hearing
Great post!
A broader perspective: Why the troposphere?
To see if the Globe is warming, see the ocean heat content.
To see if the climate is changing, see the global surface temperatures.
-
No climate conspiracy: NOAA temperature adjustments bring data closer to pristine
According to the denier's logic, the left of these two images of Uranus is the correct one because it's based on raw data while the right is a fraud because the Keck telescope on Hawaii used adaptive optics to counter the turbulence in the Earth's atmosphere!

-
CBDunkerson at 22:44 PM on 10 February 2016No climate conspiracy: NOAA temperature adjustments bring data closer to pristine
Denier 1: 'You are not accounting for urban heat island effects on the temperature data! It is all a fraud!'
Denier 2: 'You are adjusting the temperature data! It is all a fraud!'
What's really sad... all too often the 'Denier 1' and 'Denier 2' comments are coming from a single person.
-
SirCharles at 15:16 PM on 10 February 2016No climate conspiracy: NOAA temperature adjustments bring data closer to pristine
For the lay people => Understanding Adjustments to Temperature Data | Berkeley Earth

Histogram of all PHA changepoint adjustments for versions 3.1 and 3.2 of the PHA for minimum (left) and maximum (right) temperatures.
-
sjw40364 at 10:40 AM on 10 February 2016Other planets are warming
Response to anyone ignoring those newly discovered sources pumping energy into the atmosphere:
http://newsroom.ucla.edu/releases/scientists-discover-surprise-in-101025
Of course no studies have been made - it's newly discovered and despite claims of knowing of its existence for years - falsified every text book they had on the subject.
"UCLA atmospheric scientists have discovered a previously unknown basic mode of energy transfer from the solar wind to the Earth's magnetosphere. The research, federally funded by the National Science Foundation, could improve the safety and reliability of spacecraft that operate in the upper atmosphere.
"It's like something else is heating the atmosphere besides the sun."
You all talk of irradiance as if it is the sole factor. You try to justify outer panets wind speeds because there is no heat from the sun - then try to justify Venus's and earth's wind speeds because of heat from the sun. Make up your minds please. You talk about internal heat sources of planets while at the same time ignoring that the Heat from Saturn's north pole was 10 times more than predicted.
http://www.nasa.gov/mission_pages/cassini/media/cassini-20080103_prt.htm
The source of the heat is not a mystery - it's just ignored in conversations is all.
http://www.nasa.gov/mission_pages/cassini/whycassini/cassini20110420.html
Just as those connections exist between the planet and moon - they exist between the sun and the planets. Right now we can only detect earth's solar connection.
http://science.nasa.gov/science-news/science-at-nasa/2007/11dec_themis/
"NASA's fleet of THEMIS spacecraft, launched less than 8 months ago, has made three important discoveries about spectacular eruptions of Northern Lights called "substorms" and the source of their power. The discoveries include giant magnetic ropes that connect Earth's upper atmosphere to the Sun and explosions in the outskirts of Earth's magnetic field....
..."The satellites have found evidence for magnetic ropes connecting Earth's upper atmosphere directly to the Sun," says Dave Sibeck, project scientist for the mission at the Goddard Space Flight Center. "We believe that solar wind particles flow in along these ropes, providing energy for geomagnetic storms and auroras....
..."THEMIS encountered its first magnetic rope on May 20, 2007," says Sibeck. "It was very large, about as wide as Earth, and located approximately 40,000 miles above Earth's surface in a region called the magnetopause." The magnetopause is where the solar wind and Earth's magnetic field meet and push against one another like sumo wrestlers locked in combat. There, the rope formed and unraveled in just a few minutes, providing a brief but significant conduit for solar wind energy. Other ropes quickly followed: "They seem to occur all the time," says Sibeck."
Just as they will be ignored in this conversation.
Moderator Response:[PS] This is getting repetitive and you have failed to answer points made about your previous post. If you expect anyone to take this seriously then please present evidence of other heating sources that represent even a 1/10th of extra heating provided by increased GHG (ie 4W/m2). Extra milliWatts can be safely ignored.
-
sjw40364 at 10:23 AM on 10 February 2016Other planets are warming
And yet the earth has been undergoing heating for the last 25,000 years with no help from man at all. And every approximately 100,000 years it does the same thing its doing now. As a matter of fact a better case could be made that the CO2 has kept this planet from reaching the highs of past warming events. Because despite the effects of CO2 this temperature cycle is less than any of the past events.
http://clivebest.com/blog/wp-content/uploads/2013/12/Global-temps.png
It's nothing new - has been going on for as long as this earth has existed - and will continue to go up and down regardless of what we choose to do. As a matter of fact you all better hope man can affect the temperature on the planet - because ignoring what happens after every 100,000 year heating cycle is over won't change what happens.But talk to me in 10 years about how man is heating up the earth, bet you'll be wearing long johns and claiming global warming did it.
Moderator Response:[TD] Your comment is way off topic. Please comment on an appropriate thread, such as the rebuttal to "It's a Natural Cycle." Anyone who wants to respond, please do so on that thread, not this one.
-
Tom Curtis at 09:08 AM on 10 February 2016No climate conspiracy: NOAA temperature adjustments bring data closer to pristine
Hank @20, the difference you note is an artifact of the fact that the raw data only extends to 2014, while the adjusted data is shown to 2015. On the last year on which both can be directly compared, the difference between raw and adjusted is not noticably different from other recent years.
-
Hank11198 at 08:51 AM on 10 February 2016No climate conspiracy: NOAA temperature adjustments bring data closer to pristine
I am not a sceptic and I accept what the climate scientists are saying. But it appears the last year of the first graph shows a pretty substantial difference between the adjusted and raw data whereas everything else past around 1950 looks pretty close. In fact it looks like around 0.4 degrees. Also the dashed line showing the adjustments doesn’t seem to reflect this. Can someone explain what I am missing?
-
Tom Curtis at 08:49 AM on 10 February 2016Surface Temperature or Satellite Brightness?
Tom Dayton @34, the plot in the comment to which you link is of one set of radiosonde data (RATPAC A), two versions of reanalysis (ERAi, and NCEP/NCAR) , and two satellite records.
-
John Hartz at 06:26 AM on 10 February 2016No climate conspiracy: NOAA temperature adjustments bring data closer to pristine
Supplemental reading:
New Study: Yup, Thermometers Do Show Global Warming Is Real by Phil Plait, Bad Astronomy, Slate, Feb 9, 2016
-
Kevin C at 05:53 AM on 10 February 2016No climate conspiracy: NOAA temperature adjustments bring data closer to pristine
Rob, knaugle:
I'm afraid the 'HadCRUT3 unadjusted' dataset at WfT is not an unadjusted dataset, despite the name. 'Unadjusted' in this context is in contrast with 'variance adjusted', and describes the method used for blending land and sea temperatures in coastal cells weighting together different observations.
CRU collect homogenized temperatures from the national weather services so they don't have an unadjusted dataset, unlike NOAA, Berkeley or ISTI. In contrast to NOAA and Berkeley however, that means that the stations are generally manually remediated using local metadata, giving an independent check against the automated methods of NOAA and Berkeley.
-
Paul Pukite at 04:37 AM on 10 February 2016No climate conspiracy: NOAA temperature adjustments bring data closer to pristine
So the years 1940 to 1945 are very difficult to reconcile with any kind of model. An El Nino ENSO doesn't come close to being able to compensate for it. The ocean accounts for 70% of the contribution to the signal, and land 30%. Obviously a correction factor was put into place, but the error bars on this correction have to be significant.
-
Tom Dayton at 04:10 AM on 10 February 2016Surface Temperature or Satellite Brightness?
Olof has found details on radiosonde datasets other than RATPAC. None of them continues past 2013. Usefully, he has plotted them. See his comment at Moyhu.
-
Tom Dayton at 03:18 AM on 10 February 2016No climate conspiracy: NOAA temperature adjustments bring data closer to pristine
jmath, the RATPAC-A balloon radiosonde dataset (that Kevin C told you is the hottest year on record) is the only one I've been able to find that is global (i.e., gridded globally) and is up to date through 2015. If you can tell us all what other radiosonde dataset has those necessary characteristics, we'd all be grateful. I've asked in multiple forums, including ones that Christy and Spencer watch and comment on, but so far nobody--nobody--has suggested any other datasets.
-
John Mason at 02:54 AM on 10 February 2016Daffodils in bloom, the warmest ever December: how worrying is the world’s strange weather?
Here, in Mid-Wales, the first Lesser Celandines come into flower in February most years. This time round, I photographed their flowers - and those of Red Campion - on December 29th!
-
Rob Honeycutt at 02:51 AM on 10 February 2016No climate conspiracy: NOAA temperature adjustments bring data closer to pristine
knaugle... You're right. I missed the unadjusted HadCRU3. It's interesting to look at the adjusted, unadjusted and HadCRU4 all together.
jmath should also note that there are specific differences in the coverage of each of the data sets as well. RSS goes from 70S to 82.5N. UAH is I think about the same, but may go down to 82.5S. The surface station data sets also have specific challenges to capturing the poles due to the lack of actual weather stations. So, the regions where we get the most warming are also the places that are hardest to capture the data.
-
knaugle at 02:12 AM on 10 February 2016No climate conspiracy: NOAA temperature adjustments bring data closer to pristine
I took jmath's challenge and went to woodfortrees. The only unadjusted data available is HadCrut3.
Wood For Trees, HadCrut3 Unadjusted Global
From this we can see that, yes the period from about 1937 to 1945 were very warm years, however they do not challenge the years from 1998 to present.
Also, while 14 satellites worth of data sounds great, these are not separate independent sources, but for the rather a series of satellites that measured atmospheric properties since 1979 to produce a single set of data.
None of this, certainly not the satellite data, and likely not ocean bouys, supports the claim that 1940 challenges anything so far as record warm temperatures is concerned.
-
Rob Honeycutt at 02:10 AM on 10 February 2016No climate conspiracy: NOAA temperature adjustments bring data closer to pristine
jmath @8... Sorry, but you're incorrect about woodfortrees data. All the data sets are adjusted data. All the satellite data is very definitely adjusted, more so that the surface data sets.
Satellites are also not measuring the same thing as surface stations. They measure the troposphere from the surface up to around 10,000 km, as can be seen here. Surface stations are measuring the air at about 2m on land, and the sea surface of the oceans.
As far as the satellites not showing the hottest year on record: Well, that's not unexpected since satellite temps lag El Nino by about 6 months. I would wait until around April before making major proclamations on this one.
-
Kevin C at 02:06 AM on 10 February 2016No climate conspiracy: NOAA temperature adjustments bring data closer to pristine
jmath: I wonder if you could help me by providing some evidence for a couple of your claims, in particular:
The unadjusted data like the ... ocean buoy data show for instance the 2015 was not the hottest year on record.
This claim is puzzling. I'm not aware of Woodfortrees providing a buoy-only dataset. So I went to the raw ICOADS data here and calculated my own, using just the WMO buoys and no adjustments.
Of course I may have made a mistake, so then I went to the University of Hawaii here, and downloaded their data. This is based on a different and independent set of buoys - the ARGO profiling buoys.
The results are plotted below:

As you can see, the results from two different sets of buoys calculated by different methods show remarkable agreement. Given that I used the raw WMO buoy data and my own code you can check for yourself that no adjustments were involved.
Secondly, from the same sentence:
The unadjusted data like the 14 satellites, the radiosondes ... show for instance the 2015 was not the hottest year on record.
You seem to be claiming that Woodfortrees includes unadjusted satellite records. However the series up on Woodfortrees are heavily adjusted. The adjustments are documented in the publications of both the UAH and RSS groups, for example here.
I cannot find any radiosonde data at all on Woodfortrees, however RATPAC-A shows 2015 as the hottest year on record at the surface by a wide margin.
-
John Hartz at 01:59 AM on 10 February 2016No climate conspiracy: NOAA temperature adjustments bring data closer to pristine
[JH] Moderator Comment:
jmath: Your most recent lengthy and rambling post constituted sloganeering and was laced with words in "all caps." Both are in violation of the SkS Comments Policy and therefore your post was deleted in its entirity.
Please note that posting comments here at SkS is a privilege, not a right. This privilege can and will be rescinded if the posting individual continues to treat adherence to the Comments Policy as optional, rather than the mandatory condition of participating in this online forum.
Moderating this site is a tiresome chore, particularly when commentators repeatedly submit offensive or off-topic posts. We really appreciate people's cooperation in abiding by the Comments Policy, which is largely responsible for the quality of this site.
Finally, please understand that moderation policies are not open for discussion. If you find yourself incapable of abiding by these common set of rules that everyone else observes, then a change of venues is in the offing.
Please take the time to review the policy and ensure future comments are in full compliance with it. Thanks for your understanding and compliance in this matter.
-
scttharding5 at 01:22 AM on 10 February 2016No climate conspiracy: NOAA temperature adjustments bring data closer to pristine
jmath, check out this record heat wave in India that killed 2,500 people https://en.wikipedia.org/wiki/2015_Indian_heat_wave. Or maybe this one that killed 2,000 in Pakistan https://en.wikipedia.org/wiki/2015_Pakistan_heat_wave. Or then there is always this record heat wave in Europe in 2015 https://weather.com/forecast/news/europe-heat-wave-record-highs-june-july-2015. Maybe you prefer this record breaking California heat wave http://www.theguardian.com/us-news/2015/mar/29/california-drought-heat-wave-climate-change. This last article also mentions the severe drought causing dustbowl conditions in the southwest. Of course there was also this one http://ecowatch.com/2015/06/05/heat-wave-alaska/, and all of the deadly heat waves mentioned here http://ecowatch.com/2015/08/13/deadly-heat-waves-sweep-globe/.
I understand that it's hard to find this information, it took me multiple seconds. The idea that a cabal of scientists from around the world are manipulating data is paranoid, but I understand that it's all that climate deniers have left. Climate scientists have already heard, studied, and refuted all scientific claims that AGW is not occurring. They have also heard all the arguments about why it's not dangerous or that it's too expensive to fix, and they are still unwavering in their support for decarbonisation. Therefore, in order to be a denier, you have to believe in a conspiracy.
-
One Planet Only Forever at 00:53 AM on 10 February 2016No climate conspiracy: NOAA temperature adjustments bring data closer to pristine
My thank you for another great post that does an amazing job of more thoroughly explaining the legitimacy of the developing and constantly proving case against the acceptability of burning fossil fuels.
This post really helps justify the surface temperature record as the most relevant measure of the effect of the added CO2 from the burning of fossil fuels.
Other SkS posts point out the major inaccuracies and uncertainties related to the satellite data manipulations to create temperature values of the atmosphere in the 25,000 to 50,000 foot elevation range, way up in the atmosphere, not under all of the CO2 in the atmosphere.
However, there will always be some who could actually better understand this issue but desire to believe that burning fossil fuels must be OK and as a result will prefer to believe whatever sounds like it suits their interests.
-
jmath at 00:34 AM on 10 February 2016No climate conspiracy: NOAA temperature adjustments bring data closer to pristine
Okay. If the first graph were correct there might be a point. However, this is clearly NOT the correct graph. This graph does not remove all adjustments. You can simply go to woodfortrees and look at unadjusted data and adjusted data and it shows the difference is considerably different than the above graph shows. The unadjusted data like the 14 satellites, the radiosondes and the ocean buoy data show for instance the 2015 WAS NOT the hottest year on record. The entire graph for all these other datasets is TOTALLY different than the land adjusted record by GISS. That's simply an indisputable scientific fact. The data clearly show that for whatever reason the sensible sounding adjustments created by climate scientists who are clearly biased to produce adjustments that don't make them look like idiots make the temperature record into something that the vast majority of people who are say > 40 years old and experienced 1998 or know the history of the 1930 and 40s know that the record adjustments being proposed seriously change history. You can find my position on this from my blog at : https://logiclogiclogic.wordpress.com/2016/01/21/48-inconvenient-truth-nytimes-lies-2015-wasnt-the-hottest-year-on-record/
I personally believe the case is closed. The preponderance of the evidence of 14 satellites, radiosonde data, unadjusted climate data, ocean buoys and a new study that shows that 411 perfect stations produce a climate record nearly identical and confirm each other while the GISS adjustments produce massive changes that spike the temperature ever upward in the current years and depress temperatures drastically in the past making the 1930s and 40s which were demonstrably EXTREMELY hot years look like FREEZING years. The 30s and 40s which set duration of times over 100 records, dustbowls, showed arctic melting that allowed ships to pass the northern passage. Every record you look at shows the 30s and 40s were or had to be CLOSE to as hot as anything today. 1998 had 15,000 people die in france from a heatwave. If 2015 was so hot, where are the record heat waves that killed or set records? The data is clear. all the data when you don't include the adjustments makes 2015 look rather unimpressive. The only way you get the flattish line going up from 1880 to 2015 is by applying the apparently craftily constructed adjustments that have been modified 30+ times all to enhance global warming. A Duke university professor calculated the chances that 30+ adjustments would all be to increase global warming is 1 in more than 1 billion chance of occuring randomly. That is essentially proof again that it is simply impossible that the GISS adjustments are correct or even close to being correct. If you remove this post as you have done in the past to squelch perfectly valid scientific doubt you will have succeeded in wasting a few minutes of my time again but you won't at all convince anybody.
Moderator Response:[JH] The use of all-caps constitutes shouting and is prohibited by the SkS Comments Policy.
Please note that posting comments here at SkS is a privilege, not a right. This privilege can be rescinded if the posting individual treats adherence to the Comments Policy as optional, rather than the mandatory condition of participating in this online forum.
Please take the time to review the policy and ensure future comments are in full compliance with it. Thanks for your understanding and compliance in this matter.
-
Sharon Krushel at 19:11 PM on 9 February 2016The Quest for CCS
#75. Michael,
I don't know if we're really in a position to be too picky about how renewable energy innovations look, considering what's at stake, but I have two friends who live across the alley from each other. One friend put in solar panels to provide electricity for her home, and the other friend is ticked off with her for spoiling her view. Some people don't want it in their back yard or their neighbour's back yard. But they're still friends. So there's hope.
-
Sharon Krushel at 19:06 PM on 9 February 2016The Quest for CCS
#75. Michael,
Thank you for referring me to the Jacobson paper post! I left a comment at #81.
In regard to windmills, I think of them as symbols of green energy, so I don't think they look bad at all, when I see them in someone else's back yard.
Sending windmills out to sea seems like a perfect solution to me. But how do we get the energy to all the places it needs to be? (I have more reading to do.)
I get what you're saying about CCS and the true cost of fossil fuels. CCS costs may come down as technology progresses.
But maybe dirt would work better (#42). I grew up on a farm, so I'm inclined to like that as a contributing solution.
-
Tom Curtis at 18:35 PM on 9 February 2016Hansen's 1988 prediction was wrong
For what it is worth, the tabular concentration data for the three scenarios and all included greenhouse gases as used in Hansen 88, and supplied by Gavin Schmidt shows a CO2 concentration for 2015 of 403 ppmv. Again, this is more than has actually occurred.
This denier talking point is based entirely on:
Ignoring four of the five greenhouse gases;
Ignoring Hansens explicit specification of the scenarios in Appendix B;
Ignoring the tabular data as supplied by Gavin Schmidt;
Ignoring that 1982 (not 1989) is the first year of projection; and
Loudly bewailing the fact that annual emissions have grown 1.62% per annum for CO2 when Hansen only specified emissions growth averaged across all GHGs of "about" 1.5%.
If they shut their eyes any tighter against the facts of the case they would go permanently blind. -
Tom Curtis at 18:18 PM on 9 February 2016Hansen's 1988 prediction was wrong
planet8788 @37, Hansen describes Scenario A in Appendix B of his paper, saying with regard to CO2:
"CO2 increases as observed by Keeling [at Mauna Loa] for the interval 1958-1981, and subsequently with 1.5% yr-1 growth of the annual increment."
For somebody lecturing us on needing to "...be clear about Emissions and Concentrations", it is astonishing that you have not noticed that the scenario is specified with respect to the concentrations as measured at Mauna Loa, not according to emissions data. You may think it was specified according to emissions because Hansen wrote in the main body of the paper:
"Scenario A assumes that growth rates of trace gas emissions typical of the 1970s and 1980s will continue indefinitely; the assumed annual growth averages about 1.5% of current emissions, so the net greenhouse forcing increases exponentially."
That statement, however, gives the average growth across all greenhouse gases specified - not just of CO2. Therefore it cannot be interpreted as specifying the growth rate of CO2 uniquely. Further, it only gives an approximate value (about), and is no basis for claiming any growth rate more exact than somewhere between 1.25 and 1.75%. In any event, the detailed statement above takes precedence.
Based on the detailed statement in appendix B, it is trivial to get the Mauna Loa data from 1958-1981 (actually 1959 forward for annual averages), and project from 1981 forward. It is not clear if the increment is expressed as an absolute value, or as a percentage. Taking the former possibility, Hansen's specified CO2 growth compared to actual values is as follows:

The final value in the Hansen projection represents 410 ppmv in 2015 (compared to an actual 401 ppmv). Incrementing on the absolute value gives a lower increase of 407 ppmv in 207. In either case, Hansen's projected CO2 increase for scenario A is comfortably larger than the actual increase.
This is far more the case for CH4 and chlorofluoro carbons.
-
Hansen's 1988 prediction was wrong
planet8788 - See this comment above. If you include all emissions, including in particular differences in CFC emissions due to the Montreal Protocols and in methane levels, the actual forcings are far closer to Hansen Scenario C than A or B.

Note that Hansen did use a larger than currently estimated direct CO2 forcing (largely due to early radiative mis-estimates of that direct CO2 forcing, corrected by ongoing research in 1998), but when you account for that issue his model was indeed quite good.
Your claim that "The EPA and the IPCC both conclude emissions have increased more than the 1.5% That than Hansen classified as business as usual" [i.e. Scenario A?] is only close for CO2, not all emissions of GHGs that were incorporated into his model. And is hence quite incorrect.
-
planet8788 at 12:36 PM on 9 February 2016Hansen's 1988 prediction was wrong
Sorry folks, but you guys discredit yourselves by acting like a bunch of radicals defending your prophet. TallDave is absolutely right. You guys need to be clear about Emissions and Concentrations... Emissions are what are emitted. The EPA and the IPCC both conclude emissions have increased more than the 1.5% That Hansen classified as business as usual.
Now, if concentrations are lower than Hansen expected based on those emission scenarios... than you should clearly state that and admit, yes, the ocean (most probably) absorbed much more CO2 than Hansen expected and therefore CO2 concentrations are more in line with Scenario blah blah blah. ...
That is a calm, coherent argument. But claiming Hansen wasn't wrong... Hansen can't be wrong... that's just irrational and makes you look anything but scientific.
-
Tom Curtis at 08:58 AM on 9 February 2016No climate conspiracy: NOAA temperature adjustments bring data closer to pristine
WebHubTelescope @3, the pattern of unusal warmth in SST in the 1940s is matched by warmth measured by land stations in adjecent regions. While it would be astonishing if so abrupt a change in relative proportions of SST measuring practise as happened over the period of WW2 left no artifact in the data, the concurrent warming in land areas suggest a significant part of the unusual warmth in the 1940s was real.
-
Tom Curtis at 08:48 AM on 9 February 2016No climate conspiracy: NOAA temperature adjustments bring data closer to pristine
nigelj @4, this bears repeating, "Other media are not asking the tough questions of contrarians, and are letting the whole of humanity down very badly."
The whole model of news reporting as necessary to democracy, and which thereby justifies certain privileges for those news organizations (protection of sources, privileged access to government officials) is shown to be badly flawed by the global warming debate. News organizations in general have modelled their activities as primarilly commercial - and in consequence attrociously fail the trust placed in them. Increasingly they report not, what is consequential, but only what is controversial (because that sells newspapers). That the AGW contrarians are repeatedly, comedically and tragically wrong is no surprise. It is a "dog bites man" story. As a result, any error by the IPCC, or any challenge to IPCC science is reported - but the massive errors by the challengers to IPCC science are passed by without comment.
To that, unfortunately, is added the pattern by some media to try to influence politics, and to shape the news they report accordingly. This was an acceptable practise (just) when media was widely diversified, and multiple independent newspapers served each town. With the modern levels of concentration in media ownership, it is as pernicious as the propaganda in monopolistic state controlled media, such as in the former Soviet Union.
-
swampfoxh at 08:36 AM on 9 February 2016Fox News Republican debate moderators asked a climate question!
As a life long Conservative Republican, I've had enough of the Republican Party bosses and candidates this time around. Their behavior borders on the moronic. Anybody who can't see what is happening in the climate realm is asleep, ignorant, or has a monetary motive for denying the facts. So much for that. I never thought I'd ever vote for a democratic socialist but Bernie Sanders is my guy this time around. After all, the climate problem is more important than any other problem we think we have...
-
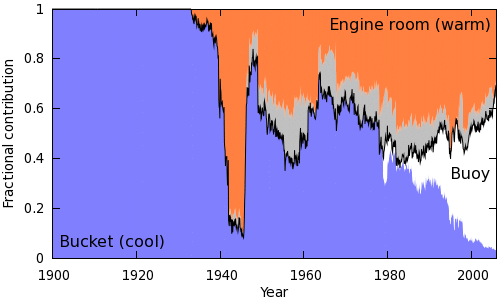
Tom Curtis at 08:35 AM on 9 February 2016No climate conspiracy: NOAA temperature adjustments bring data closer to pristine
suckfish @2, WebHubTelescope answered your question indirectly. Durring WW2 there was a large introduction of new, military ships that measured SST in the intakes to the engine room rather than by the traditional bucket method. At the end of WW2, a lot of those ships were decomissioned. The result is a large artificial spike in the raw SST data:
Kevin C discusses this in greater detail here.
-
nigelj at 06:20 AM on 9 February 2016No climate conspiracy: NOAA temperature adjustments bring data closer to pristine
I agree with Rocketeer. The graphical data for the strong warming phase after 1970 show no significant difference between adjusted and unadjusted data, so the issue should end there. The climate contrarians simply have no case.
But only this website and one or two others holds the contrarians to account. Other media are not asking the tough questions of contrarians, and are letting the whole of humanity down very badly.
-
Paul Pukite at 06:13 AM on 9 February 2016No climate conspiracy: NOAA temperature adjustments bring data closer to pristine
The years between 1940 and 1945 are IMO not well-calibrated. The group responsible for taking measurements shifted from civilian to military resonsibility, and there was also a transition in the approach to measurements, from trailing canvas buckets to engine intake compartments.
I personally don't think it will ever get resolved. Is that global hot temperature spike centered at 1942 real, or is it a miscalibration?
Prev 495 496 497 498 499 500 501 502 503 504 505 506 507 508 509 510 Next


