


 Arguments


Recent Comments
Prev 498 499 500 501 502 503 504 505 506 507 508 509 510 511 512 513 Next
Comments 25251 to 25300:
-
Rob Honeycutt at 01:02 AM on 3 February 2016They predicted an ice age in the 70's
NecktopPC... You note that Roberts is one individual and not the entire NOAA. No one is suggesting that some scientists might have had dissenting opinions in the 1970's. But even given that, you might look further into Walter Orr Roberts work.
First off, he's an astrophysicist, not a climate scientist. Second, he was active in the global warming issue where he attempted to get cooperation between the US and Russia to address the issue. LINK
-
NecktopPC at 00:45 AM on 3 February 2016They predicted an ice age in the 70's
RE: "Other scientific bodies that have released statements endorsing anthropogenic global warming include: National Center for Atmospheric Research"
RE: "None of these bodies (at least the ones that existed back then) endorsed ice age predictions in the 70's."
I would like to draw your attention to this document, which was titled: "A New World Climate Norm? Climate Change and itsEffect on World Food"
And that story was written by: Walter Orr Roberts, of the Aspen Institute for Humanistic Studies, and National Center for Atmospheric Research, Boulder, Colorado.
Here is an URL. to a .pdf copy of the article: https://www.iaea.org/sites/default/files/16505796265.pdf
-
POJO at 00:39 AM on 3 February 201610 Indicators of a Human Fingerprint on Climate Change
MA Rodger @93.
Is it not enough that IPCC have openly stated that have backed away from DTR??
In reference to AR5. Please advise me where IPCC have opted back in??
Regards to Fig 3.2 of AR4. After just explaing and providing the evidence that the IPCC have backed away from DTR as a fingerprint you are effectively questioning the IPCC's wisdom!
It is clear in the the low resolution anomaly chart that the anomaly has flatlined since 1990 ish.
Also note that the IPCC chart you reference in Fig 3.2 of AR4 uses a DECADAL anomaly. The decadal chart I posted is on post 92. It clearly show's what has happened since the 90s. Ignore the last two ticks.
I may add as I have in previous comment that the data that is being used to support the Fingerprint as pointed out by Tom was only upto 2000 and 2003. It is now 15 years later and you are defending the the Brazanghi analysis. I applaud you for that. On reflection I am not disputing his analysis. He made a analysis with the data he had at the time.
Note that Brazanghi etal paper was more about the suitability of using DTR as a fingerprint for CLIMATE VARIABILITY AND CHANGE.
I have already stated that I support this assessment. But people need to move on. Another 15 years has elapsed from the last data used for his assessment. There is nothing in his paper that states his findings do not apply if DTR is moving in a opposite direction now is their.
So in conclusion it is evident to me that DTR is no longer a endorsemnt (Fingerprint) for Co2 effect on greenhouse gas. DTR is stable and Co2 is pumping along.
It is a endorsement of correlation between cloud and temperature. More cloud means a smaller range between min and max temps. That is all it means.
-
scttharding5 at 00:31 AM on 3 February 2016Climate's changed before
Climate has changed before!? Wow! Thank goodness someone realized this. I'm so relieved now. Let's just tell all of the scores of science academies, thousands of climatologists, economists, governments, health care organizations, militaries, and insurance companies that they don't have to worry any more. I'm surprised that none of them knew this already, that climate has changed before. I'm sure they will be as happy as I am to hear that this isn't a problem because climate has changed before.
Seriously, I can't believe people like Marco Rubio are still spewing this nonsense. All of the vast majority of climate scientists that accept the fact of anthropogenic global warming already know that climate has changed in the past, and they are still extremely concerned about our GHG emmissions. The 97% must be wrong, or involved in a giant hoax.
-
SirCharles at 23:44 PM on 2 February 2016Fox News Republican debate moderators asked a climate question!
Climate change denial disorder => https://www.youtube.com/watch?v=fZTTI_0mHN0
-
Tom Curtis at 22:46 PM on 2 February 2016Joseph E. Postma and the Greenhouse Effect
JPostma @148:
From the PDF:
"In the “diverse experiments” Fourier references in regards to de Saussure’s device, we would expect that the results with the highest temperature arose from those conditions which were most conducive to the collection of solar energy. Thus, for an atmospheric total extinction of solar light of ε ~ 14% when the sun is near solar noon on a clear day and at some altitude up a mountain, a maximum TOA flux of FTOA = 1415 W/m2 , a surface emissivity of μ = 96% and surface albedo of α = 96% (such as for charcoal, given that de Saussure’s device utilized “blackened cork” for the absorptive medium), then the equilibrium temperature is 109.8 degrees Celsius, which therefore provides the theory explanation for de Saussure’s observation of the device reporting a maximum of about 110 degrees Celsius."
First, while de Saussure's first experiment with a his improved hot box achieved a temperature of 228oF (108.9oC); his second experiment, which with further improvement, achieved a temperature of 230oF (110oC) did so "... even though the weather was not as favorable as during the prior experiment". This more inclement weather for the experiment with the peak temperature shows that you are not entitled to an assumption of ideal conditions. Further, the experiment which achieved 110oC was not conducted on a mountain. Indeed, the mountain he did conduct experiments on (Mount Cramont) is only 2,740 meters high, hardly enough to avoid all, or even most atmospheric absorption.
You can perhaps assume better conditions for Herschell's experiments, but his peak temperature was 240oF (115.6oC), a value sufficiently exceeding your calculated value to refute your hypothesis. Further, his observations were made not higher than Table Mountain (1,085 meters).
In neither case are you entitled to an inflated modern value of the TSI for an experiment conducted in 1767 (or for Herschell's case, the 1830s). Allowing peak modern values, TOA TSI peaks at 1410 W/m^2, but insolation in 1767 or 1830 was well below that peak value:

Finally, we do not need to relly on these old values. Modern hot box cookers with designs inspired by de Saussure's are tested in modern universities. Of particular interest is the testing of the Sudanese design cooker with the external mirror removed, and the internal mirrors shaded so that it most closely resembles de Saussure's design. Under these circumstances, in April and May of 1998, in Delhi, the Sudanise design reached temperatures of 126oC. We can assume bright sunshine, but this was after the Vernal Equinox, form which it follows that TOA insolation was less than the annual average of 1361 W/m^2. Further, we know the experiments to have been performed at or near sea level, so that. Given your calculated theoretical maximum of 110oC given 1415 W/m^2 and no atmospheric absorption, the 126oC observed clearly falsifies your argument.
-
MA Rodger at 21:23 PM on 2 February 201610 Indicators of a Human Fingerprint on Climate Change
POJO @92.
I am not sure why you harp back to AR4. AR5 has happened since and surely supersedes AR4. Mind, I'm not so sure you have read AR4 properly. Or even given its pictures a critical look. Do you not think the inconsistencies between your data and that presented in AR4 Figure 3.2 should be telling you something?
-
Glenn Tamblyn at 19:45 PM on 2 February 2016The Quest for CCS
Sharon
An open question. Could your heating requirements - which are obviously significant where you live - be met by ground-sourced heat pumps? Is that considered? Is that on individual citizens radar where you live? Is that on the radar for the authorities? -
Sharon Krushel at 17:26 PM on 2 February 2016The Quest for CCS
Philippe, I would identify with you, but not lecture you, on what it's like to lose one's job and livelihood.
I hope I did not imply that we should do nothing about our CO2 emissions. On the contrary, we must do all we can. We have chosen to transition. CCS is one solution in the transition plan.
-
Glenn Tamblyn at 14:57 PM on 2 February 2016Joseph E. Postma and the Greenhouse Effect
Howdy Joe, still trying to slay dragons?
Joe, this is confusing. Figure 3 is correct, reflecting the fact that the inner surface (on the left) will be at a temperature that is 2^-4 times the temperature of the glass surface to the right. That is what thermodynamics says should happen here (in this obviously extremely simplified case).
Whereas your Fig 5 is not in thermal equilibrium. Thermodynamics does not predict fig 5 as a final outcome. You seem to be confused about what thermodynamics says.
And your example in your conclusion is crazy. Your coal engine assumes no other energy flow out of the system so it is not an engine. You are effectively saying that if a system has perfect insulation and we keep adding energy into it it will keep getting hotter. Well duh! But we aren't getting anything useful out of the system like mechanical work. That isn't an engine. -
KingLarry at 13:27 PM on 2 February 2016Inuit Perspectives on Recent Climate Change
Thanks for this informative article, Caitlyn. I enjoy the firsthand account from an individual who has knowledge of the immediate effects of climate change.
NASA animation shows global warming over 135 years
http://www.msn.com/en-us/video/newsscienceandtechnology/nasa-animation-shows-global-warming-over-135-years/vi-BBowdgo?ocid=sf
-
Rob Honeycutt at 12:57 PM on 2 February 2016Joseph E. Postma and the Greenhouse Effect
JPostma... Why is it this doesn't seem to be peer reviewed or published material?
-
Elmwood at 12:00 PM on 2 February 2016Fox News Republican debate moderators asked a climate question!
cap and trade is a terrible way to clean up our emissions, look at europe. all it does is create a mechanism for wall street to skim money at the expense of everyone else, which is precisely why it has support with our elected officials.
james hansen and pope francis both reject cap and trade.
-
JPostma at 09:13 AM on 2 February 2016Joseph E. Postma and the Greenhouse Effect
PDF:
-
JPostma at 09:11 AM on 2 February 2016Joseph E. Postma and the Greenhouse Effect
A Note on Fourier and the Greenhouse Effect
http://arxiv.org/abs/1510.02503
Fourier and his friend de Saussure built a device to "trap heat" from light (electromagnetic) energy, and they found that the interior temperature of the device, where heat was supposed to be trapped, didn't rise above the temperature of the heat source. Therefore, heat does not get trapped in such a way as to increase the temperature above that of the source, and therefore there is no radiative greenhouse effect.
-
John Hartz at 08:48 AM on 2 February 2016Ted Cruz fact check: which temperature data are the best?
Recommended supplemental reading:
Explainer: how surface and satellite temperature records compare by Roz Pidcock, Carbon Brief, Feb 1, 2016
-
John Hartz at 08:39 AM on 2 February 2016Fox News Republican debate moderators asked a climate question!
Recommended supplemental reading:
South Florida Is Sinking. Where is Marco Rubio? by Nina Burleigh, Newsweek, Jan 28, 2016
-
Wol at 06:38 AM on 2 February 2016Climate scientists' open letter to the Wall Street Journal on its snow job
Ryland @ 13
I take your point: I should have said what I meant, which was that 1998 (the start point for deniers' "pause") was a big "El Nino AFFECTED year" as regards global temperatures.
-
PhilippeChantreau at 03:51 AM on 2 February 2016The Quest for CCS
I read your post Sharon and a couple of things bother me. Of course, there are a lot of people whose jobs and livelihood depends on the oil industry in Canada. And in Australia, there are lots of communities that depend on coal mining, each could claim only a small percentage of total carbon emissions attributable to their specific community. The same could be said of the oil production of a small African country where I used to live. And so on all around the World. So what do we do then? Nothing? Because we can not disrupt any community? The international finance industry had no such scruples when they repackaged loan assets, leading to the 2008 fiasco. Strangely enough, that has already been forgotten, and it seems such lesser insult to the economically minded.
The current slump in prices is largely a result of speculation, as were the spikes that happened in the past. The problem is, one can not use the excuse that too many people depend on oil so we can't do anything about it. The hard truth is this: there is no long term future for humanity that includes the industrial scale use of fossil fuels. None. The two are in fact mutually exclusive. So one must be chosen over the other. Which will it be? Once we have that figured out, we ideally would try to make the transition into nothingness for the other as painless as possible. Even if we choose the better option, that may still not be completely painless but neither is life.
And please don't lecture me on how it's like to lose one's job and livelihood. I was working in aviation when the 9/11 attacks sent the all job market down the tubes, including my job. I'm still here. What Westerners these days call hardship would be considered a very comfortable life in 95% of non Western locations. Even the miserable 2008 economic recession did not manage to reach anywhere close to great depression levels. No long lines to get soup. No shanty towns of homeless people. No epidemic. Just a little less comfort and security. The net loss resuting from this greed-induced fiasco was in the trillion range. It was absorbed by the World economy, with only Greece still having consequences.
We can spare a few hundred billions into something that likely holds the key to long term future. How much could we gather if we had the 100 richest people in the World commit 1% of their wealth, as a start?
-
scttharding5 at 03:15 AM on 2 February 2016Climategate CRU emails suggest conspiracy
What has become obvious to me is that all denialist arguments boil down to "It's a Hoax". Whatever the argument that a denialist is throwing out, it is something that the climate science community has already heard and refuted. The authors of the IPCC reports have also heard all of these arguments before. Therefore, the only way to continue to be a denier is to believe that the vast majority of scientists studying climate are wrong, or involved in the most elaborate international hoax in the history of the world. Clearly these views are irrational, and require a strong prediliction to deny climate changed usually based on ideology.
-
POJO at 00:06 AM on 2 February 201610 Indicators of a Human Fingerprint on Climate Change
Thanks Tom for the response,
After getting through all of that. I guess the only bit that matters at the end of the day is what the observed data is saying. If someone is telling the chart is going down but I can see that it is going up I can conclude two things. It is at best stable or perhaps marginally going up.
I say it is going up and hence forth my reasons to support this below.
• I note that the IPCC have withdrawn their support from the DTR story. As from AR4 in as so far they have distant themselves from the previous AR reports where they conclusively aligned themselves with DTR. Note that I do agree that DTR is a good proxy for cloud cover and surface solar radiation amongst others.
•With all the factors going into establishing DTR you mentioned a number of issues that attempt to explain the effect aerosols had on DTR. I.E The Abrupt decline.
You inferred that aerosols – Decease DT. And they do.
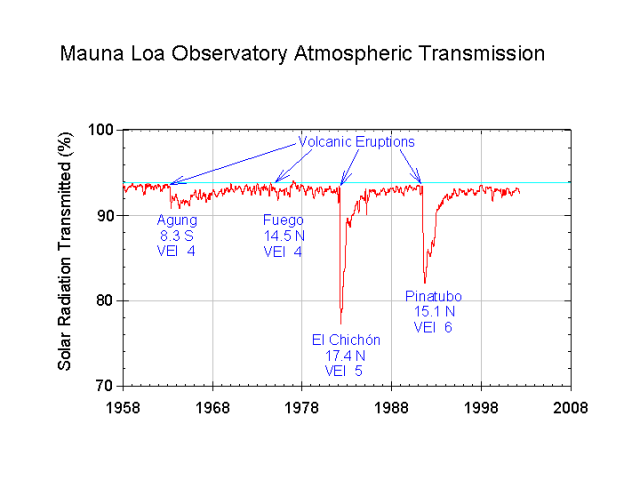
El Ninos and La ninas. Well I look at them as have a neutral effect. Warms here but cools down over there. And we are continuously reminded that that the Oscillation effect is NET ZERO.So taking on board that globally aerosols have a reduction effect in DTR I find it pointless discussing this. We both agree that DTR declined with absolutely minimal effort from the two biggest movers and shakers of Aerosols last century El Chichon and Pinatubo.
Re below Mauna Loa radiation transmissions from aeresol thickness
Also this pic https://en.wikipedia.org/wiki/File:Aerosol_dimming.jpg. Will not upload?
It is obvious when looking at Crutem Mean Temperature Data that the Mean uptrend was very steep since the mid seventies.
Whilst I do not discount the findings of Brazanghi And Alexander it is worth noting that their data was only up to 2000 and 2003. As the IPCC felt strongly about the DTR fingerprint in FAR, SAR and TAR I can see why so did Brazanghi et el and Alexander et al. But since then the IPCC have distanced itself from the DTR fingerprint. As for the reasons I have already given. The observations clearly show it.
Whilst I do not discount the findings of Brazanghi And Alexander it is worth noting that their data was only up to 2000 and 2003. As the IPCC felt strongly about the DTR fingerprint in FAR, SAR and TAR I can see why so did Brazanghi et el and Alexander et al. But since then the IPCC have distanced itself from the DTR fingerprint. As for the reasons I have already given. The observations clearly show it.
This from IPCC AR4 https://www.ipcc.ch/publications_and_data/ar4/wg1/en/spmsspm-direct-observations.html Climate Change 2007: Working Group I: The Physical Science I am sure you have seen this part before.
Some aspects of climate have not been observed to change. {3.2, 3.8, 4.4, 5.3}
• A decrease in diurnal temperature range (DTR) was reported in the TAR, but the data available then extended only from 1950 to 1993. Updated observations reveal that DTR has not changed from 1979 to 2004 as both day- and night-time temperature have risen at about the same rate. The trends are highly variable from one region to another. {3.2}Hence I am at a loss to understand why you are claiming Aerosols as a cause for abrupt dtr decline and then going on the limited data that Brazanghi etal and Alexander etal had they claim GHG's are responsible. The claim to defend the DTR Fingerprint as a result is conflicting from SKS in this case.
This logic contradicts itself.So if IPCC are stepping back from the DTR fingerprint what reason do I have to believe what is written in this threads OP.
You mentioned that the decadel data had extra pips on it. And you are right. I checked the data and it is their. I am damned if I know how it does that. I reloaded the sheet again and it is still their. Nonetheless you were able to establish this and consequently discarded those last two pips.
In summary Tom,
The observed data of DTR is clear that the decline has been arrested.Whether you use monthly, annually or decadal. It is obvious.
Monthly;

Monthly low pass 12

Annual;

And Decadal

To me it is obvious. As to do the IPCC!
Moderator Response:[BW] Comment edited to make graphics fit the page. Please make sure to restrict width to 500px.
-
John Hartz at 23:50 PM on 1 February 2016The Little Ape That Could
@denisaf #17:
Who created the "technical systems"? Who operates such systems?
-
bvangerven at 22:14 PM on 1 February 2016The science for climate change only feeds the denial: how do you beat that?
Hi,
Since I followed your course “Making Sense of Climate Science Denial” I am a fan of edx.org.
On Feb 15th another edx course is starting that may be relevant to this subject: “Framing: Creating powerful political messages”.https://www.edx.org/course/framing-how-politicians-debate-delftx-frame101x
From the introduction: “No doubt that your persuasiveness relies on your arguments. But your ability to influence and convince critically depends on the way you frame your message.”
May be worth checking out ? Enrollment is free. -
Sharon Krushel at 20:50 PM on 1 February 2016The Quest for CCS
#56 - Andy. Thank you for replying to my comment. I am certainly open to anything you have to say. (And I love the photos of your dog.) I agree CCS is suitable for oil sands which are usually in remote areas. And they are, of course, a transitional solution.
Thank you for the link to the Drakes Landing project. Wow! What a great plan for new neighbourhoods. I hope many more of these will be built. Ironically, if our oil industry "tanks" we probably won't be able to afford such ideal innovations. Right now, many I know have lost their jobs or fear they will lose their jobs or that their businesses will go bankrupt. This includes biologists, fish and wildlife specialists, reclamation specialists and environmental scientists and technologists who were working alongside industry to minimize effects on the environment. It trickles down even to us artists (I'm a nature photographer). The curator in Fort St. John, B.C. said sales are down 40% from last year, because most of their customers worked in oil related jobs.
There is a book called "Creativity: the psychology of discovery and invention" by Mihaly Csikszentmihalyi (don't ask me how to pronounce his name!). He makes the observation that innovation is sparked by a perceived problem. However, innovation often, eventually, brings about other unintended problems, requiring further innovation. I think it would be most helpful if the issue of AGW could be addressed in light of this truth. AGW is an unintended problem created by consumers and industry together. Most people know there's no silver bullet. Even the production of solar panels has an environmental impact. As Rumpelstiltskin says in the TV series, Once Upon a Time, "Magic comes with a price, Dearie."
What distresses me most about this issue, besides, of course, the people affected by rising water levels, etc., is what I would call "the psychology of blaming." It's easy to target the tar sands because Canada has a great deal of industry in one area, and statistics and images can be used to paint them in the worst possible light - to the point where they are perceived as one of the biggest contributors to climate change. But from what I understand, if we shut down all of the tar sands, it would reduce global emissions by 0.16%. Even the 2013 Skeptical Science article, An Updated Look at What Keystone XL and Alberta Tar Sands Mean for the Climate, indicates that the "dirty" part of the tar sands (if all the expansions had gone through and the maximum had been sent through Keystone XL for 40 years) would contribute only 0.2% to the global carbon budget. And CCS has the potential to reduce the dirtiness to less than 0.2%.
By focusing the public's blame on the tar sands, are we, in the grand scheme of things, "straining out a gnat and swallowing a camel"? The camel might represent our cars, or the trips we take for the sake of pleasure, or the oil we import across the ocean from Saudi Arabia, or other places where they don't have the same regulations...
The oil industry certainly needs to be held accountable, and I was encouraged by your link to the article about Alberta's energy plan which involved consulting with industry.Ironically, I believe we're going to need a strong fossil fuel industry in order to transition to renewables. We need their expertise and resources. And I do think CCS may prove to be an important part of that transition. Hopefully, as they work with the technology, it will become less expensive and more effective, while we innovate together with renewable alternatives.
Thanks again for your good work. Your articles and comments are most helpful. I have been an environmentalist since the 80s, and I am on a task force to address this AGW issue within the Anglican Church in regard to the suggestion that it is immoral to invest in fossil fuel companies. Our priest referred me to this website, and I'm so glad he did. -
Sharon Krushel at 20:26 PM on 1 February 2016The Quest for CCS
Thank you for your responses as I am genuinely interested to learn of ways we can transition from fossil fuels in Canada without collapsing economically, agriculturally and otherwise. I'm still wondering especially about the land use issue if we shift in a major way to hydro and renewables.
In response to #58 Eclectic, regarding households that are off the electric grid, I found this information: https://en.wikipedia.org/wiki/Off-the-grid
Environmental concerns in Canadian off-grid communities
"Canada has about 175 aboriginal and northern off-grid communities." You can read more at that link. There are many other individual homes that are off the grid.Regarding our electricity cost, it has varied greatly. For example, January 2012, it was 15.1940¢/kWh, whereas January 2015, it was 7.423¢/kWh. For natural gas January 2012 was $3.057/GJ, and January 2015 was $2.760/GJ. We often pay more than double the energy cost in distribution costs.
In 2014, we used 122.25 GJ (natural gas) for heating our 1226 sq ft. very well-insulated home and single-car garage/shop, and 9259 kWh for power (including powering a block heater on cold winter days so our vehicle will start - our garage is a shop - no room for the car). It cost just under $4,000 for heat and electricity for the year. Unfortunately, most people, especially lower income families, have less insulation in their homes, so it would cost more. It would be interesting to compare the power required to provide a home in a warm climate with air conditioning for a year.
In response to #55, scaddenp,
The information on GHSP is very promising. My husband's parents in southern Manitoba had this installed, and we have looked into it. Unfortunately, according to a report: "Feasibility of Ground Source Heat Pumps in Alberta" (Prepared By: Dave Miller and Tanya Maynes, March 2008), "In all cases, calculations using numbers representative of an Alberta energy mix showed that switching from conventional forced air furnaces to GSHPs resulted in an increase in GHG emissions." Also, I think my husband said it cost about $45,000 to install. But maybe in the future, when our area has more wind, solar power, etc.
#57 - Michael,
I'm well aware that we damage the environment and thereby cause suffering for others, and that we can lessen the damage with our choices. It's so good to see that some people recognize a connection between consumers and industry in this AGW problem! So many people demonize those who extract the fossil fuels, while they as consumers continue to use them for their own benefit. In regard to heating our home, natural gas is relatively "low carbon." It emits about 50% less carbon dioxide than coal and has the potential to be combined with CCS (when this technology is matured).
Right now, it would seem that a high-efficiency natural gas furnace is probably the best source of reliable heat for our existing home (currently - pun intended - electricity in our area doesn't come from renewables). We could use solar panels combined with GHSP if we saved up a LOT of money, but we'd likely still need a furnace, which is already a LOT of money.
-
denisaf at 15:58 PM on 1 February 2016The Little Ape That Could
In my writings on what has happened, is happening and will continue to happen in the operation of industrialized civilization, I use the term 'Tityas' for the vast inanimate organsim that is the infrastructure, from cities down to iPhones, that is carrying out nearly all of the deleterious operations in order to supply the needs and wants of the human population in an unsustainable process.
-
denisaf at 15:45 PM on 1 February 2016The Little Ape That Could
This is a typical anthropocentric discussion so conveys a false impression. Humans have done very little damage to the eco systems. It is the technical systems that have done most of the damage. The main impact of people is the decisions, good and bad, they have made about using the technical systems that irreversibly use up natural material resources, produce irrevocable waste material and degrade the environment, including causing climate disruption and ocean acidification and warming, during their limited lifetime.
Conveying the false impression that people have done the physical damage does not contribute to the understanding of what humans should decide to do with the existing infrastructure to cope with the inevitable powering down.
-
michael sweet at 02:49 AM on 1 February 2016The science for climate change only feeds the denial: how do you beat that?
Chriskoz,
Did you read the referenced paper to see what they found?
-
Johnb at 22:41 PM on 31 January 2016'If the world ends in 2100, we’re probably OK'
It's the 'baked in' bit that is going to prove most troubling as anything we do now is only going to show any effect some 40/50 years or more down the line and current societies look for an instant response to any action/policy. Baked in lag timing and the absence of an immediate response is also going to generate a series of magic cures and all the dangers they potentially carry. Some of the geo-engineering proposals currently thought up carry a huge potential for catastrophe never mind any future Dr. Strangelove's magic elixir that gets promoted as an instant cure.
-
chriskoz at 20:12 PM on 31 January 2016The science for climate change only feeds the denial: how do you beat that?
Given that the authors employed "machine learning algorithms that automatically detected clusters of words", it's not immediately obvious how they determined the subects articles to be in the denial of climate science. Words themselves such as "climate" "temperatures", "CO2" do not imply the denial. We should be looking for frases such as "hide the decline" or "it's the sun" (insert the title of any climate myth here) to find the hints of science denial.
I wonder if such frases were indeed found by the authors. If the "clusters od words" they were looking for were just unrelated, then they possibly jumped to premature conclusions. I want to see the evidence their conclusions were justified (e.g. sample analysis showing strong correlation between the use of certain words and science denial).
-
POJO at 17:57 PM on 31 January 201610 Indicators of a Human Fingerprint on Climate Change
@Tom #90
thanks To for the response and the net surfing. Great work :)
Regards to OLS. Must be honest, that is escaping me at this stage. Need to know what that is before proceeding
Thank you Tom
-
Tom Curtis at 16:01 PM on 31 January 201610 Indicators of a Human Fingerprint on Climate Change
POJO @89, briefly:
1) Thankyou for acknowledging and apologizing for your error.
2) Annual data is already smoothed from the montly data, so the claim of "no smoothing yet" is false.
3) Alexandar et al examine frequency of warm or cold, night and days. That frequency can not be identified from monthly data, let alone annual data. Further, Alexandar et al examined the percentage of the Earth covered by warm or cold, nights and days. For that you need the full gridded data, not a time series. It follows that your analysis above is in no way a replication of Alexander et al. Rather, it is only another shot at replicated Braganza et al.
4) I do not trust a decadel smooth that returns "observational" values for 2018 from data that terminates in December of 2014. Ergo your second graph is near to useless. (I am aware that may not be your fault.)
5) Regardless of the merits of the smooth, you appear to back at the game (already refuted) of using smoothed data to discuss the causes of trends in a noisy data set obviously significantly effected by a variety of factors. However, it may be that you are only trying to illustrate the broad trends. That being the case, the period of the smooth is appropriate, but the method is dubious, both because of the spurious years added to the tail of the smooth, and because that tail hides a downtick at the end visible in the 10 year running mean data.
6) There is nothing odd about cross checking an analysis by checking what happens in an obviously correlated variable. The relative frequency of warm nights and days is not DTR, but is obviously related.
7) Extreme events are weather. So are daily or monthly measurements of mean temperature or DTR. Climate, however, is the statistics of weather. Alexander et al test to see if the statistics of warm or cold, nights and days changes over time. It does, and with a consistent long term trend. That later represents a change in climate.
More detailed comment:
A) Here, and in comments elsewhere, you talk about refuting a fingerprint. If you look at the original post, and the accompanying illustration, it talks about the pattern of 10 features being a fingerprint. By that analogy, an individual item among those ten may be shared with other sources of warming (as individual details may be common between two peoples fingerprints), but the overall pattern of all 10 is unique. Consequently, as it stands you have not refuted any fingerprint. You have not even refuted the DTR detail. At best you have shown this particular detail to have multiple causative factors (as was already known, and is the actual IPCC science, contrary to your claims), and so that its weight in contributing to the overall "fingerprint identification" is small.
B) The OLS DTR trend since 1980 is flat and not significant (0.01 +/- 0.12 C per century). As twice explained above, and twice ignored, that has a prima facie explanation in the two large volcanoes in the late twentieth century, the two super El Nino's in the same period, and the two large La Nina's late in the data period.
I can now add to that that if you cherry pick your start period to coincide with the 97/98 El Nino, you can just squeeze a positive statistically significant trend out of the data (0.45 +/- 0.32 C per century). In all other periods less than 30 years I have checked for a trend, the trend has not been significant. Further, the data is obviously autocorrelated, so the OLS trend calculation will overestimate statistical significance. Using a more appropriate model, it may well be that even the 1997-2014 trend is not statistically significant. I have not checked that, however, as the maths is beyond my pay grade. Further, the most recent trend from 2012 is strongly negative (-3.03 +/- 4.63 C per century). That is entirely unsurprising considering the visible relationship between DTR and ENSO states. Of course, so short a trend is just weather, but that relationship does suggest the 2015 data will eliminate any statistically significant trend from 1997. In other words, trends since 1997 are too short to be representative or changes of climate in regards to mean temperature, and are certainly too short to represent changes in climate in DTR (which typically has a lower trend).
More later.
-
nigelj at 12:53 PM on 31 January 2016'If the world ends in 2100, we’re probably OK'
Paul @2
I agree. Our minds are only focussed on the next 85 years, and struggle even with that time frame. This may be because our minds are not wired up to deal with long term problems. We are programmed to deal with short term threats.
Of course some people may be better at grasping long term issues than others. The article below is an interesting discussion of scientific evidence of how our minds deal with different time frames and the relation to climate change.
http://www.theguardian.com/sustainable-business/2014/nov/10/brain-climate-change-science-psychology-environment-elections
-
Paul W at 09:26 AM on 31 January 2016'If the world ends in 2100, we’re probably OK'
What a great article. This small minded focus on the current 85 years ahead has been causing me concern for many years.
Its as if our watch ends at that point and to hell with the future after that.
When the ice sheet data is added into the mix with sea level rise over the comming many centuries the future looks much more of a concern.
Why it matters is that the Coal mine policy of the current Australian Government is at complete odds with statements made at the recent Paris talks.
Wanting to keep warming to 1.5 degrees C means no more new coal mines in Australia and a rapid wind back of current mines.
-
barry1487 at 08:15 AM on 31 January 2016Climate scientists' open letter to the Wall Street Journal on its snow job
ryland @13
1998 (or 97) is the critics go-to simply because that's a good year to begin an analysis to get a slower or non warming trend, depending on data set. Starting at this point in the temp record coincides with the largest el Nino of the 20th century. Critics initially were not phased by that.
Now that we're having another large el Nino and a record year, critics are suddenly interested in this short-term effect, and use it to downplay the heat of 2015, and any resulting uplift in trend (soon to be seen in the satellite record, which has a longer lag to el Nino than surface, and which they're already downplaying).
If you want to remove the el Nino effect, then do it for all years and then rank the hottest years. There will be less variation and more overlap of the uncertainty intervals year to year. The trend, however, becomes less suceptible to interannual variation for the short periods critics are interested in. With ENSO removed, there is no pause. That's what selecting 1997/98 as a start point did for their arguments, and why they do not like to remove the effect, even though it's currently a hot topic to downplay 2015.
HadCRUt4 and NOAA have 2015 at 1st rank even factoring the uncertainty. GISS has a very small overlap - 2015 is the hottest year to only 94% confidence.
To repeat - remove ENSO from the record and there is no pause. Leave it in and 2015 is the hottest year beyond uncertainty in 2 out of 3 surface data sets (the Japanese global record looks like clearing this hurdle to, for 2015), and very nearly for the 3rd.
I'm not sure what you're interested in, but I hope these comments help.
-
richardPauli at 05:07 AM on 31 January 2016'If the world ends in 2100, we’re probably OK'
This is a great subject. Possibly the most important aspect of the entire issue. Thank you and more please.
-
richardPauli at 04:54 AM on 31 January 2016Climate scientists' open letter to the Wall Street Journal on its snow job
I think we are too kind and tolerant of deniers. Buzz Aldrin handled deniers differently https://www.youtube.com/watch?v=1wcrkxOgzhU
We should remember this is not just impish public relations squabbling about history, this is vital information to be used for future survival - and deceivers should not command our respect, nor our attention. Such named obstacles should be routed around or ignored, but their actions not forgotten.
-
michael sweet at 03:54 AM on 31 January 20162016 SkS Weekly News Roundup #5
The article in Newsweek about FLorida is very strongly worded. More of this type of article in the mainstream press will catch the general public's attention. From the article:
"South Florida business leaders and even many local Republican politicians are no longer in climate change denial. Now, deep in the fine print of resolutions and memoranda being passed around among the various task forces in the area, one sees the mantra “Elevate. Isolate. Relocate.” Abandonment of some parts of the community to water is now accepted as unavoidable. Even the most conservative estimates assume that a percentage of the next generation of Floridians will become internally displaced Americans, climate change refugees."
The author uses high estimates of sea level rise and gives examples of people currently dealing with floods today. Republican politicians Jeb Bush and Marco Rubio are referred to as deniers.
I think articles like this impress people more in the long run than scientific articles becasue they are easier to read. Everything helps.
-
Eclectic at 23:51 PM on 30 January 2016The Quest for CCS
Thanks, Sharon, for your expanded comments.
I would still be interested to know your estimate (or better, an authoritative figure) for the number of Canadian households that are off the electric grid. But please don't trouble to dig that out, if you feel my request is onerous for you!
My own region is known for its 100% lack of skiing . . . and 100% of households possessing air-conditioning. So if I may make an easier request . . . and ask you what your local electricity cost [marginal cost] per Kw-hour averages out as. And also ask you a more personal question ~ how many Kw-hours [alternatively: BTU's] does your house require in total year-round heating? And how that compares in oil cost for you.
I hope that there may be some marginal but significant scope for your local houses to "super-insulate" ~ but I realise we are talking multiple thousands of dollars, there, for the upgrade (if any possible!). Of course, the whole question here is the long term alterations that will happen in energy supply in Canada (and worldwide).
As a partial comparison : a relative of mine living in Germany, has changed houses, and, although grid-connected, he uses the previously-installed oil heating. I presume that this is because his marginal (oil) cost is lower ~ without accounting for the externalized costing of the oil. His immediate overall heating costs have dropped, since he installed triple-glazing in the windows and super-high insulation in ceilings/walls. The installation costs were high ~ many thousands of Euros ~ but that amount was supplied as an interest-free loan (from the German government) specifically ear-marked for house insulation upgrades.
That seems an enlightened policy by the government ~ and I hope your recent "governmental upgrade" may bring similar policies to Canada. Certainly we need that sort of change too, right where I live !
-
michael sweet at 20:23 PM on 30 January 2016The Quest for CCS
Sharon,
It seems to me that the only reason natural gas is cheaper for you to use is because you do not pay for the very large damages that you cause when you use it (this applies to all fossil fuel use, I don't want to pick on you). If you have to pick up your portion of the cost to move Miami, Norfork and Bangladesh you might find out that methane is not as cheap as renewable electricity any more. If we build a power system that does not use fossil fuels (wind, solar and nuclear if it is economic) than you can be warm and not contribute to the distruction of others homes at the same time. Andy's link provides one alternative for you that is hopeful.
The issue with AGW is that a small amount of CO2 from me does not seem all that bad. When we add up all those small contributions humans are damaging the global commons. In order to fix the problem of damaging the commons everyone must move to low carbon technology.
If a carbon fee is implemented that covers the damage carbon does than we can see what is really the cheapest way to go. Fortunately, alternatives have been developed that can produce all our energy without damaging the climate.
-
gregcharles at 19:15 PM on 30 January 2016Study finds slim odds of record heat, but not as slim as reported
I take "13 of the past 15 years were hottest on record" to mean that 13 of the past 15 years are in the top 15 hottest years of the temperature record. Including 2015, it's 14 of the past 15. Another way to put it is that every single year of the 21st C. (which started in 2001) was hotter than every single year of the 20th C., with the single exception of 1998.
-
BBHY at 17:56 PM on 30 January 2016Climate scientists' open letter to the Wall Street Journal on its snow job
"the post-1998 regime", in other words, abnormally warm.
The "coolest" year of the 21st century, 2008, was still warmer than all but one year of the 20th century.
I don't think people realize that a year which last century would have been warmer than 99 out of 100 years now counts as a very "cool" year. That's how much warmer the Earth is now. So, I don't think that's what they were trying to say, but yes, without the El Nino of 2015 we would still be having very abnormally high global temperatures.
-
Andy Skuce at 17:41 PM on 30 January 2016The Quest for CCS
Sharon, thanks for your thoughtful comments.
I admit that I was a little snarky referring to Shell "boasting" about their CCS project, but I was annoyed at the fact that they were giving themselves a big pat on the back for operating what is largely a taxpayer-funded project.
I didn't intend to scare people about having CCS in their neighbourhoods and the Shell Quest project appears very safe from what I have read about it. However, if CCS is deployed at the massive scale that is required to make a dent in climate change, there are bound to be accidents as companies try to cut costs and are eventually forced to use less-than-optimum sites.
In sedimentary basins that have been pierced by tens of thousands of oil and gas wells, some of them leaking methane today, it may prove hard to find good disposal sites.
My main point, though, was that CCS in populated areas is bound to run into public opposition. The recent events in California with the uncontrolled blowout at the methane gas storage site are not helpful at all, even if the possibility of a CO2 blowout happening is much lower.
I'm not anti-CCS, by the way, just skeptical that it can deployed as a silver bullet at scale and in time to solve the climate crisis. There probably are places (eg, in the oil sands or at gas-fired power plants) where CCS could play a useful role.
I lived in S Alberta for twenty-five years and I'm well aware of how long and hard the winters can be (and that N Alberta has it much worse). Home heating in the Great White North does indeed seem to be a difficult problem to solve without fossil fuels. I was encouraged to read recently about the Drake Landing project in Okotoks. See comment #9 on this thread on the Alberta carbon tax. Solutions like that, along with retrofitted, super-insulated homes might get us a long way there. Still, when it's -40C for a weeks-long cold snap, some form of furnace inside the house is likely required.
-
ryland at 14:55 PM on 30 January 2016Climate scientists' open letter to the Wall Street Journal on its snow job
That should be WoI@15 not @13
-
ryland at 14:23 PM on 30 January 2016Climate scientists' open letter to the Wall Street Journal on its snow job
WoI@13 I don't think 1998 was chosen because it was an El Nino year per se as you suggest by your comment "What was so special about 1998? Oh yeah, an El Nino year." but because the El Nino in both 1997 and 2015 were very large. From comments above it may be that the 2015 El Nino, like the 1997 El Nino, will have a greater effect on the global temperatures in the following year.
It has been estimated by Gavin Schmidt (here) using the Oceanic Nino Index (ONI), that the 2015 El Nino contributed about 0.07C to the increased temperature. Excluding that the temperature would have been 0.8C greater than the 1951-1980 average. Others, using the Multivariate ENSO Index (MEI), calculated that El Nino contributed about 0.09C. All that said, after removing the El Nino contribution, 2015 was the hottest year by only 0.06C This is less than the margin of error for estimates of the global temperature between the 2015 temperature and the next hottest year 2014 which iself had only a 38% probability of being the hottest year ever. Claiming hottest year ever, based on differences from the mean that are less than the error of estimate may be one of the reasons for the comment of alogar @10.
This has been countered by climate scientists who claim 2014 had a greater chance of being the hottest year ever than did 2005 or 2010. Prtesumably the same claim will b made for 2015.
-
POJO at 12:58 PM on 30 January 201610 Indicators of a Human Fingerprint on Climate Change
Tom @88
Yes my apologies for getting the decadel wrong. That was a bad error. So I am now using the annual data,
Note that Alexender etal data was based on data from 1951 to 2003
So i have now accuired the annual (yearly) data from KNMI / CRUTEM4. No smothing applied yet
The story does not change. DTR saw a rapid decline and has since stabalised and even increased

Now below the decadal smooth is applied. And it is evident as per ALexander etal that infact the trend remained intact until 1998-2003.
Since then the decadal DTR has since increased.

I find it odd that the DTR is now being assessed in terms of cold nights and warm night extremes.
The science is clear that as GHG's increase so to does DTR decrease. Extrene events are termed weather by many!!!!!
No matter what variation is done to the monthly data it is evident that the change has at the very least increased from 2000 ish. Which coincides with available data at the time that Alexander etal had.
As you alluded to my earlier comment cherry picking short events is weather.
So I have now heard what you have said and now have attached the climate charts as per above.
Perhaps this change in DTR also can be used to best highlight the current pause.
As per Brazanghi final summary that DTR can be used to
....Diurnal temperature range appears to be a suitable
index of climate variability and change,......page 4 of 4 SUMMARY
-
Wol at 12:30 PM on 30 January 2016Climate scientists' open letter to the Wall Street Journal on its snow job
@ 1:
>>Michaels: “Without El Niño, temperatures in 2015 would have been typical of the post-1998 regime.” There's that stubborn obsession with 1998 as a start date again. What was so special about 1998? Oh yeah, an El Nino year. Michaels now intends, for his business audience, to shackle 2015 with the same provision he just spent the last 18 years asking them to ignore of 1998.<<
I forecast some weeks ago here that the denialists would argue that the present el Nino is unusual and shouldn't count: the only thing that surprises me is that it took them so long to come up with it!
-
Digby Scorgie at 10:41 AM on 30 January 2016The science for climate change only feeds the denial: how do you beat that?
jipspagoda
The gridlock might remain, but we are comparing people who view the real world through the lens of science with people who believe in fairy tales. The latter are welcome to call the former fanatics, but the real world is the ultimate arbiter.
-
Tom Curtis at 10:17 AM on 30 January 201610 Indicators of a Human Fingerprint on Climate Change
POJO @86 and 87, evidently you do not know the difference between climate and weather.
Braganza et al were looking for the effects of change in climate on DTR, not looking for the effects of short term fluctuations on DTR. Therefore they chose a smoothing value that eliminated such fluctuations, but left the climate effects unaltered. The effect of that was to weaken the correlation of DTR to Mean temperature from to -0.37 using the montly data, relative to their reported -0.24. It leaves the trend in DTR unchanged at -0.36 C per 50 years (slightly misreported by me in error in my prior post, for which I am sorry).
In contrast to Braganza et al, you were looking at the effects of fluctuations over a short interval, particularly highlighting a fluctuation whose total duration in the smoothed data was just 10 years. That is, you were looking at weather. Yet you chose a smoothing window that largely obscured the short term fluctations.
With regard to Alexander et al, they used unsmoothed daily data. In the timeline graphs, they showed the annual data along with a smooth. In the mapped graphs they showed the decadal trends. The difference between a decadal trend and an annual trend is just that the former is the later multiplied by 10 (ignoring rounding issues). That is, the difference is merely a matter of the unit chosen to report the result - not the value of the result. In other words, what Alexander et al did was nothing like what you did.
To summarize, you apparently do not know what was wrong with your smoothing, despite my having pointed it out. In defense of that, you point to a greater smoothing by Braganza without noticing their very different purpose to yours. You compound your error by accusing Alexander of making a similar error, when they did nothing of the sort. (The later strongly suggest incompetence rather than deceit as the reason for your inappropriate smoothing.)
Finally, inorder to check Braganza's result against the monthly data, I downloaded the monthly Crutem 4 data. As a result I was able to compare the normalized inverted DTR data to the Mean data and can confirm that the sudden change in slope is a feature of both. The difference in the two largely arises because the effect of the two large volcanic erruptions (El Chichon in 1982; and Pinatubo in 1991) have same sign on DTR and Mean temperatures. That artificially flattens the rapid slope visible from 1960-1980. The trend from super El Ninos (1983, 19897/98) to large La Ninas (2008, 2011/2012) artificially reduces both the positive trend in Mean temperatures and the negative trend in DTR.
-
sailingfree at 08:04 AM on 30 January 2016Models are unreliable
Can someone update this to show the 2015 data?
Can I help?
Prev 498 499 500 501 502 503 504 505 506 507 508 509 510 511 512 513 Next


