


 Arguments


Recent Comments
Prev 520 521 522 523 524 525 526 527 528 529 530 531 532 533 534 535 Next
Comments 26351 to 26400:
-
chriskoz at 12:40 PM on 2 December 2015How much does animal agriculture and eating meat contribute to global warming?
IMO, lifestock methane should be treated differently to other sources of methane (e.g. fugitive emissions from mining) because their carbon is part of C exchange within OA reservoir. But statements like this:
ruminant animals like cattle produce methane, which is a greenhouse gas about 20 times more potent than carbon dioxide
if taken out of context, create confusing scare campaign.
Apart from short CH4 lifetime, (subject to oxidation to CO2 by hydroxyl radicals within a dacadal timescale) I would like to add that the resulting CO2 does not contribute atmospheric CO2 rise. The carbon that ruminants expell, comes from vegetation that grew by assimilation of CO2 by photosynthesis in the first place.
It would be a different story if said CH4 came from the "old carbon" (e.g. milion y old fossil fuels). And this is the case of fertiliser input that comes from fussils. This is what really counts in the long term. So, livestock input to global warming (also manure and rice cultivation) is really exaggereted in the figure IMO. Oil/gas extraction and coal mining (fugitive emissions) are of much more dire consequences.
With the above in mind, in response to foolonthehill@17: if your "fertiliser input is almost zero" (I guess zero fossil fertiliser), then you are fine, nothing to feel sorry with respect to C emissions. Of course, you need to follow other sustainable practices to make sure your land is not dagraded but that is outside of the scope of this forum.
-
Tom Curtis at 12:34 PM on 2 December 2015The Road to Two Degrees, Part Two: Are the experts being candid about our chances?
Digby Scorgie @35, in principle that is correct. In practise it is not so clear. In particular, the time line over which we must drop to zero net emissions is approximately equal to the design lifetime of most power plants and significantly larger than the design lifetime of most other infrastructure. Consequently a carbon tax introduced now which will predictably be maintained or increased into the future will not have to deal with sunk costs on current infrastructure which will be replaced over the relevant timescale in any event. Further, so long as its long term imposition is predictable, it will be factored into any new construction thereby limiting any new construction of fossil fuel infrastructure, and ensuring such sunk costs are factored into the investment decision on any such infrastructure. That is, any future fossil fuel power plants will be built and costed with a reduced lifetime expectancy if reasonable certitude of a carbon price can be generated.
In addition to that, the effect of sunk costs will be limited by the ability to retrofit carbon sequestration technology and/or the ability to gain "carbon credits" for paying to more rapidly decrease emissions, or sequester emissions elsewhere at lower cost.
Having said that, as we delay taking adequate action to reduce emissions (as we appear to be doing even with optimistic estimates of the outcome from Paris), the time scale required for decarbonization sinks and sunk costs become a much larger factor. Put another way, the more we delay implimenting a carbon price, the larger the carbon price will need to be to move us to zero net emissions in a timely manner.
-
RedBaron at 12:10 PM on 2 December 2015How much does animal agriculture and eating meat contribute to global warming?
While I certainly agree with the gist of the article, the Vegan sites have grossly exagerated the effect of animal husbandry, even this article is probably exagerating the impact somewhat due to flaws inherent in a methodology that primarily focuses on emissons rather than complex biological cycles. Emissions focussed methodology works great when we talk about fossil fuels and concrete, because those sources of carbon are from stable pools. The active pools act in a fundamentally different manner. For example, counter intuitively, land use change from forest to pasture can actually can actually have an overall cooling effect rather than a warming effect. http://blogs.uoregon.edu/gregr/files/2013/07/grasslandscooling-nhslkh.pdf
http://www.airseadalian.com.cn/Column/UploadFiles_7536/200703/20070302104207896.pdf
What matters is the net flux from stable to active carbon cycles. Basically we are talking the stable soil carbon fraction and fossil fuels as the stable pools, and the rest of the carbon that cycles actively is just part of life. There are frozen methane clathrates in the ocean and permafrost that can be a concern should they melt rapidly, but that's more of a feedback concern, if we fail to get the other pools stabilized. More of a symptom that magnifies, not an initial cause. This is one of the things, that if it happens, will dramatically amplify the seriousness of AGW.
Any agriculture of any type that increases the stable carbon pool in the soil is not creating AGW, but rather is helping mitigate AGW.
So when you discuss the issue with Vegan advocates intent on humanity giving up animal foods, point out that rather the solution is using agricultural methods that increase soil carbon at a higher rate than they use fossil fuels, for a net reduction in atmospheric greenhouse gasses back into the stable pools.
If anyone wants to help mitigate AGW by giving up certain foods, give up foods produced from land decreasing in soil carbon, and replace it with food produced from land increasing in soil carbon.
-
Digby Scorgie at 11:09 AM on 2 December 2015The Road to Two Degrees, Part Two: Are the experts being candid about our chances?
Tom Curtis
I've thought some more about carbon taxes. They not only have to make fossil fuels more expensive than alternative fuels, they also have to make it more economical to decommission the fossil-fuel infrastructure while introducing and developing the infrastructure for the alternatives. The net effect is therefore likely to be a carbon tax much greater than anticipated.
-
Tom Curtis at 10:29 AM on 2 December 2015How much does animal agriculture and eating meat contribute to global warming?
saileshrao @19:
"The 1.8ppm of methane that existed in the atmosphere 12 years ago has added 1.8ppm of CO2 to the atmosphere this year, which is a significant fraction of the 2.34ppm of CO2 added to atmosphere from Oct 2014 to Oct 2015."
That is not correct. The 12.4 years "lifetime" of CH4 in the atmosphere is the "e-folding time", designated by the unit τ (greek lower case tau). That means of the 1.8 ppmv of CH4 in the atmosphere 12 years ago, approx 1.1 ppmv will have decayed to CO2 over the intervening 12 years. A further 0.4 ppmv will decay over the next 12 years, and another 0.2 ppmv in the twelve years after that. As CH4 emissions are sufficient to maintain and even increase CH4 concentration against this rate, a better way of looking at it is that CH4 emissions contribute 1.8 ppmv every 12.4 years (assuming equilibrium has been reached), or 0.15 ppmv per annum. More accurately, at equilibrium the contribution to CO2 from CH4 decay equals the CH4 emission rate.
Further, you have assumed that 100% of CO2 from CH4 decay is retained in the atmosphere whereas in fact, just like direct CO2 emissions, the airbourne fraction will be about 50%.
If atmospheric CH4 was allowed to rise to equilibrium concentration with current emission rates, the CO2 concentration per annum (0.017 PgC) would represent 0.425% of current direct CO2 emissions. That is small enough to be inconsequential except in the very long term (and possibly even then).
Turning to Pierrehumbert's claim - his point is that in the long term, and assuming CH4 emissions are stabilized, the anthropogenic effect on Earth's temperature is entirely governed by CO2 emissions - which to a first approximation is correct. CH4 emissions strongly influence how we approach that long term temperature increase. With initially high CH4 emissions we will approach it rapidly and then possibly settle back down to it. With low CH4 emissions we will approach it slower. Therefore, in Pierrehumbert's opinion tackling direct CO2 emissions is the first priority. He is mounting a counter argument to the claim that industrial emissions of CH4 and black carbon represent "low hanging fruit" that can be tackled cheaply and quickly while largely ignoring the CO2 problem. Pierrehumbert is correct in rejecting that approach - but I (and no doubt he) believe that we can tackle both at once.
-
scaddenp at 10:07 AM on 2 December 2015Heat from the Earth’s interior does not control climate
Even doubling crustal heat flow is utterly insignificant compared to other climate forcings. Changes in heat flow leave their mark and are a critical input to petroleum models used to determine when and where sediments heat to the point that oil and gas are expelled. (I maintain one of these models). At least over the last 180million years, there is no evidence for any cycle or significant change in these heat flows, let alone something that could have climatic effect. Because of the importance of heat flow to petroleum, measurement and analysis is ongoing throughout the world.
I also do not see any period in earth climate history over last 500my where change cannot be explained by the existing well-understood physics.
-
DrT at 09:38 AM on 2 December 2015Past 150,000 Years of Sea Level History Suggests High Rates of Future Sea Level Rise
One of the problems with "correlations" especially serial (time related) correlations is that they do not prove cause and effect. A large amount of effort goes into "proving" a causation using correlation, multiple regression, etc., but consider that when the rooster crows, the sun comes up, but that certainly does not mean that he rooster causes the sun to rise.
Also, other factors are raising sea levels, including Plate Tectonics, the continental shift that is impacting the depth of the ocean floor where one plate moves under another. It causes earthquakes, it releases heat into the ocean that cause frozen methane to become gaseous and rise to the surface (a far more potent greenhouse gas than CO2), but most important, it raises the ocean floor.
Imagine the same amount of water in the oceans, and the sea floor rising, it clearly would raise the level of the surface of the water.
There is also Solar output, the orbital radius from the sun, the "tilt" of the axis that changes over thousands of years, all impact climate (the weather).
Be very careful about assuming that scientists have "proven" anything if they rely on correlations of any kind, and ignore some clear and obvious geological issues that have a large impact on ocean levels, and the release of methane into the atmosphere.
Dr. T — A scientist interested in factual analysis, not correlations that are not proof of cause and effect.Moderator Response:[PS] You appear to be engaging in a straw man. Nowhere is correlation being used to imply a cause and effect. However, if your model predicts a correlation (and the physical models most certainly do make these predictions), then an important test of your model is see that such correlations do in fact exist. If they dont, this is evidence against a model. If they do exist, then it strengthens the model. In science, nothing is ever "proven" (you can only do that in maths) and noone has suggested it has. The other factors you mention are already part of standard climate theory, and taken into account in models. Eustatic changes in sealevel have been known and accounted for since the 1980s eg (http://www.earth.ox.ac.uk/~tony/watts/downloads/WattsThorne84.pdf)
-
michael sweet at 09:31 AM on 2 December 2015Heat from the Earth’s interior does not control climate
Maaark,
This web site has all the information that you ask about. It is not the responsibility of posters here to spoonfeed you the answer to your questions. It is your responsibility to look for it and inform yourself.
I typed "climate in the past has changed before" into the search box above and got this post which addresses your first question. Please read that post and then follow up with questions there where they will be on topic.
The OP here addresses your other question. It states:
"The net increase in the amount of planetary energy flow arising from human activities (mainly the greenhouse effects from emissions of carbon dioxide) since the industrial revolution is more than twenty times the steady-state heat flow from the Earth’s interior. Any small changes in the Earth’s heat flow over that time period—and there is no evidence for any change at all—would plainly be inconsequential."
If you have a question that is not addressed by this quote about mantle heat you need to be more specific about the changes you suggest which would increase heat flow by a factor of 20 without anyone noticing. The method of measuring the heat flow is described in the OP, it is not necessary for NOAA to install additional thermometers.
If heat from the mantle was warming the ocean, the ocean would warm from the bottom up. Extensive data shows clearly that the ocean is warming from the top down which contradicts your hypothesis.
Please make use of the search box, your questions will be better after you read more.
-
saileshrao at 09:25 AM on 2 December 2015How much does animal agriculture and eating meat contribute to global warming?
This "rebuttal" misses several key aspects of the contribution of animal agriculture to anthropogenic greenhouse gas emissions:
1. As Tom Curtis (#4) points out, methane is a significant player in the short term. Over a short term horizon, say 20 years, methane has a CO2 equivalence factor of 86. Even if each molecule of methane becomes a molecule of CO2 with a half-life of 12.4 years, the fact that atmospheric concentrations of methane have been monotonically rising over the past century shows that the arguments of Pierrehumbert etc., are shooting false straw men. The 1.8ppm of methane that existed in the atmosphere 12 years ago has added 1.8ppm of CO2 to the atmosphere this year, which is a significant fraction of the 2.34ppm of CO2 added to atmosphere from Oct 2014 to Oct 2015. This is significant.
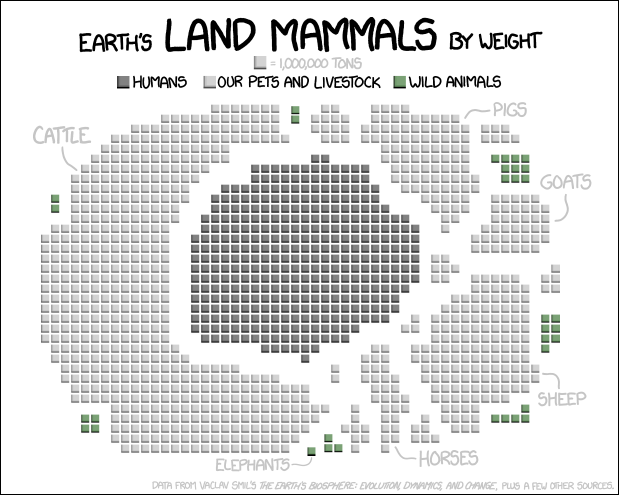
2. As Andy Skuce (#3) points out with the XKCD graphic, the biomass of livestock grossly exceeds the biomass of humans and wild mammals. Livestock are an invasive species in most ecosystems and as Anthony Barnosky shows, our use of fossil fuels has allowed us to increase the biomass of megafauna from 200Mt to 1500Mt, most of which is livestock. Therefore, the breathing contribution of livestock should be considered an anthropogenic addition to the carbon cycle. Livestock is estimated to cause 8.7Gt of CO2 emissions through breathing alone. This is significant.
3. Finally, animal agriculture uses 35% of the ice-free land area of the planet for grazing alone. The foregone carbon sequestration from the potential reforestation of this land is calculated to be at least 265 GtC (please note, this is C not CO2) as we show in our upcoming paper to be presented at the AGU Fall Meeting in a couple of weeks. This is significant. -
Maaark at 08:39 AM on 2 December 2015Heat from the Earth’s interior does not control climate
Glen and Tom thank you both. I think that my hypothesis may be over simplified. I am not addressing the possibilty of the tidal energy. That discussion may be valid for some but that is far removed from my points so I will state very slowly.
Premise #1: if earth has a history of heating/cooling cycles then we should be seeking a pattern that explains those and also is somehow connected with today's situation. Example: I have had 7 migrane headaches in the last month. Today I ate icecream so that must be the source of my headaches = poor science. Good science would seek to find a common factor in all 7 headaches. Therefore we should find common patterns in the previous cycles. Does anyone agree? Are there theories on past cycles?
If greehouse gases were the causes before fine, but we should see some science on this. There are some books that speculate that one cycle may have been triggered by an asteroid in the Yucatan area of Mexico.
I do not propose that earth's core is increasing in heat. So I accept what Tom says but it does not adress my question.
Hypothesis: I propose that due to continual movements of tectonic plates areas of the upper mantle engage the crust as the lithospheric plates move allowing variations in the way that heat reaches the surface. In a very primitive example it would be like sliding a pan over the stove burner so different parts of the pan are exposed and heated even though the burner itself is constant. The plates are constantly moving some diverging down to be reheated while others move nearer to the surface.
Maybe a constant temperature is maintaned because while some submerge others emerge in equilibrium. However, what if there are cycles where large portions of hot mantle emerge under large portions of the sea? This hypothesis would at least be reconciable with cycles prior to human contributions.It seems prudent that NASA and NOA should place thermometers a couple meters deep incrementally across our seas to monitor changes in crust temperatures.
Thanks for your patience gentlemen. I should learn to explain myself in my best scientific language in this type of setting. Please address both issues: premise of cycles and plate tectonics as related to heat movement.
-
lorainel at 08:35 AM on 2 December 2015How much does animal agriculture and eating meat contribute to global warming?
Can someone specifically discuss the points made in this report by the Worldwatch Institute?
http://www.worldwatch.org/files/pdf/Livestock%20and%20Climate%20Change.pdf
-
foolonthehill at 07:04 AM on 2 December 2015How much does animal agriculture and eating meat contribute to global warming?
Thank you so much for this post Dana. I have been waiting for a post on agricultural emissions for some time and was at the point of requesting that you address this gap in the SKS resource library.
I am particularly interested in this topic as I own a grass fed beef farm. I have been struggling to find a sensible discussion forum that concentrates on the problem that I am contributing towards (searches on this topic primarily direct to the work of Allan Savory, about which I am rather sceptical).
On a personal note, I have begun the process of reducing my stock numbers by 40% on 1990 levels by 2030. I have set up a nursery to grow native trees for revegetation of land that is not grazed (my land is not suitable for arable production). Fertiliser input is almost zero. I am fortunate to have a secondary income that allows me to make these changes - other farmers around me do not have that luxury.
I am happy to discuss these choices.
-
Tom Curtis at 06:48 AM on 2 December 2015Murry Salby finds CO2 rise is natural
InnocentSmithReturns @17, I have a very low opinion of Murray Salby's honesty, for reasons partly explained here and here. He immediately shows, in this new video, why that low opinion is justified. He begins by referring to is sacking by Macquarie University (0:30). He says:
"If I am in retirement, let there by no doubt, it is forced retirement. After being prohibitted from teaching climate, and then having my research files confiscated."
He must have had a sense of deliberate mischief in making that claim, which makes it appear as though he was prohibitted from teaching prior to his dismissal. In point of fact, he was dismissed, in part, because he refused to teach:
"Professor Salby’s employment was terminated firstly, because he did not fulfil his academic obligations, including the obligation to teach. After repeated directions to teach, this matter culminated in his refusal to undertake his teaching duties and he failed to arrive at a class he had been scheduled to take."
Salby demonstrates incredible chutzpah in accusing the University of preventing him from teaching, whereas in fact he was dismissed because he refused to teach.
Of coure, that was only part of the reason. A further reason was his undertaking a trip to Europe when his class schedule required him to be in Australia, and paying for that unauthorized trip through the unauthorized use of university funds. Nor was that misappropriation the first by Salby, who ceased employment in the US because he had been found to undertake conduct that "...reflects a consistent willingness to violate rules and regulations, whether federal or local, for his personal benefit."
Fast forwarding to 1:06:06 on the video, Salby shows a graph the obsolute HadCRUT3 data set. Leaving aside why he uses the obsolete data set rather than the current HadCRUT4 data set, he shows two apparent trend lines on the graph at that point. Careful examination shows that they are not in fact trend lines, but pseudo-trendlines. They are intended to look like trend lines, but are not. The periods are from 1877-1910 (actual trend: - 0.0089 C per annum), 1910-1945 (actual trend: 0.0159 C per annum). This gives a mean change in temperature between start point and end point of the intervals of -0.3 C and 0.4 C respectively. Salby shows them as -0.7 and 1 C instead, inflating the values by 133% and 150% respectively.
Earlier, in discussing the HadCRUT3 data he asserted that the warming post 1910 was "just as long and even faster" (1:05:00) than the warming post 1976. His highlighted area for post 1976 actualy ends in 1998, but I have taken it to 2001 to cover the same period ("just as long"). That reduces the trend for the period. Nevertheless the trend from 1976 to 2001 is 0.0172 C per annum, 8% faster than the earlier period. That difference may not be statistically significant, but that does not justify claiming the period with the lower nominal trend had the higher nominal trend which is a direct falsehood. Even that leaves aside the fact that Salby cherry picked the earlier period to give the maximum trend, but excluded years ('74 and '75) that would have resulted in an increased trend for the later period.
(Analysis made using the Wood for Trees resource. All trends calculated from January of the initial year through to December of the final year.)
Clearly Salby has not abandoned the dishonest presentation of data on which so much of his argumenation depends in earlier videos.
This may seem like shooting the messenger. It is not. The paradox of internet "experts" is that they seek tirelessly to convince the generally uniformed and inexpert public that what they say is true, while scrupulously avoiding putting their arguments before genuine experts who are long familiar with the relevant arguments, and the relevant data. Specifically, while rusing to convince the uninformed public, they avoid peer review. Somebody truly convinced of their theories would take the opposite approach. There confidence in the soundness of their arguments should result in equal confidence that they will be able to persuade the majority of domain experts as to the truth of what they say. Conversely, when a supposed expert insists in presenting their "revolutionary" theories time again to an uncritical public, while avoiding opportunties to present them before the well informed - you should take that as in indication of their confidence, or rather their lack of confidence, in the soundness of their arguments.
That is particularly the case when they repeatedly (as Salby does) choose obsolete data over current data, cherry pick, use misleading presentations of the data, apply statistical tests to theories they oppose while avoiding similar tests for their own theories, and repeatedly misrepresent the nature and substance of the theories they criticize. (The later is very evident in this video in Salby's complete failure to acknowledge the many other forcings other than CO2 that the IPCC recognizes and discusses, in addition to more pointed examples I may discuss later.)
The scope of Salby's video is so broad that your request for a point by point rebutal amounts to a request to be given a free Climate Science 101 course; with the added onus on your respondents that they have to correct Salby's misleading presentations of data and theory at the same time. It is a big ask. It is not something I am inclined to do unless I see clear evidence of good faith in the form of an ability to recognize Salby's shoddy practise for what it is.
-
scaddenp at 06:08 AM on 2 December 2015Murry Salby finds CO2 rise is natural
Leaving aside Salby's nonsense, it is worth noting that the over very long time scales (100s of million years), the trend in CO2 has been downward. Just as well because the sun is gradually getting hotter over similar time scales. At about end of Pliocene, CO2 got low enough for Milankovitch cycles to induce ice ages. With our massive release of millions of years worth of stored hydrocarbons, we have kind of reset that cycle.
-
Jim Eager at 03:42 AM on 2 December 2015How much does animal agriculture and eating meat contribute to global warming?
Re the "documentary" Cowspiracy, it includes every possible factor related to animal agriculture to arrive at their cited percentage of emissions, from land use changes and deforestation, to production of fertilizers for feed crops, to transport of those chemicals and feeds, etc, etc, factors that are already accounted for in other categories. They then compare their resulting aggregate figure to just the direct emissions of transport, which is a rather dishonest slight of hand.
A proper and honest comparison would be to include a portion of the many factors related to transport, including the overwhelming bulk of petroleum extraction and refining emissions, perhaps the bulk of cement production (roadways, runways, canal locks, etc), a portion of deforestation and land use changes (construction of roadways, airports, docklands), a large portion of steel and aluminum mining and refining and chemical and machinery manufacturing (cars, trucks, busses, trains, planes, ships).
Doing so would obviously make for a much more apples to apples comparison, but it would hardly serve the purpose of the film, which is promoting veganism.
For more see:
https://www.quora.com/Cowspiracy/How-accurate-is-the-movie-Cowspiracy
and
http://www.fao.org/news/story/en/item/197623/icode/Moderator Response:[RH] Hotlinked URL's.
-
Murry Salby finds CO2 rise is natural
InnocentSmithReturns - The current science on CO2 indicates that the recent warming of 0.8C over pre-industrial levels has released an additional ~10-12 ppm of CO2 from the oceans. Salby claims that _all_ CO2 increase from pre-industrial levels comes from ocean warming, a rate of perhaps 120 ppm per degree. And not from our (well known) emissions.
If that relationship held true, given that the ice ages perhaps 6-7C cooler globally, CO2 levels during the ice ages would have gone to zero (-300ppm or so by that relationship, in fact!), killing all life on Earth. That's absolutely not the case, and the failed relationship of Salbys presents a reductio ab adsurdum failure of his arguments.
Salby's arguments are nothing but nonsense.
-
Murry Salby's Correlation Conundrum
InnocentSmithReturns - The earth system is a net sink now, as it accomodates the extra fossil CO2 we've put into the carbon cycle. If we were to stop emitting CO2 right now, that sink would draw atmospheric CO2 down to perhaps 20-35% over pre-industrial levels over several centuries, to the point where the oceans, biosphere, and atmosphere exchange rates balance. Longer term processes such as weathering and CaCO3 formation would draw down the remainder over perhaps 3-7 thousand years. This is the "long tail" commitment we're making with our current emissions.
See Archer et al 2009 for a discussion of this topic.
-
Rob Honeycutt at 23:44 PM on 1 December 2015How much does animal agriculture and eating meat contribute to global warming?
I don't know if this comes from that Cowspiracy movie, but on another website I saw someone make the comment that we're projected to use up all of the 565GT of remaining budgeted carbon emissions through livestock by 2030. It's a completely absurd statement, but there it was. I asked where they got the information but the person didn't respond.
-
Alexandre at 23:32 PM on 1 December 2015How much does animal agriculture and eating meat contribute to global warming?
Those flow charts are a great visual resource. Very informative. It's a great way to communicate that any single solution would only tackle a small part of this huge problem. We need lots of these solutions.
Any idea if there's an updated version of it? Would the SkS team consider doing it?
-
How much does animal agriculture and eating meat contribute to global warming?
Nice post.
Can you please just clarify how are trucks, tractors and other machinery included in this analysis? Are they part of the transportation or animal and plant production.
-
johncl at 23:25 PM on 1 December 2015How much does animal agriculture and eating meat contribute to global warming?
Ok, I saw the "documentary" called Cowspiracy a while back, and although it paints the silly black and white picture that "meat is a big problem hence one should ignore all other emissions" I wondered a bit about their numbers. I see they have a number of cited sources on their web page. 18% of all greenhouse gases. I would assume they then also mean the production of food for the meat industry itself as well. How about transportation, does the chart above separate transportation within the agriculture or does it add that to the agriculture number? I do however think the film has a valid point about water usage which adds up a lot for every kg of beef compared to just eating the vegetables ourselves.
-
MA Rodger at 22:28 PM on 1 December 2015Murry Salby finds CO2 rise is natural
InnocentSmithReturns @17.
You ask about "a mistake" but appear to ask for a detailed blow-by-blow rebuttal. Don't hold your breath on the latter. You may consider the following a response to the former and a taste of what the latter would contain.
The first of Salby's graphics plots global CO2 emissions from fossil fuel & cement and onto this trace Salby draws two period trends and annotates the annual rate of change for these periods. He says this rate of change grew massively between the 1990s and the 2000s. The rate of change has changed! This is fine. The rate of change of fossil fuel (&cement) emissions increased during the 1960s, fell back through the 1970s, bulged up and down through the 1980s, stayed low through the 1990s (averaging 80Mt(c)/y/y) then rising again through the 2000s and staying high to 2013 (averaging 240Mt(C)/y/y 2002-2013). These therefore are probably what Salby means by "the growth of fossil fuel emissions increased by a factor of 300%." It is however messy data, something Salby rather ignores.
Where Salby is also silent here is the change in CO2 emissions between these two periods1990-2001 & 2002-2013. Between the two periods, the annual emissions rose from 6.4Gt(C)/y average to 8.6Gt(C)/y average due to FF+cement, a rise of 33%, but more correctly, including net land use emissions these figures are 7.9Gt(C)/y to 9.5Gt(C)/y a rise of 20%.
Salby's second graphic is MLO CO2 data. When he claims the rate of change in atmospheric CO2 is "exactly" the same for the period 1990-2001 as it is to 2002-2013 (he may be using slightly different periods but the outcome would be the same) he is simply lying. For the two periods, the average annual increases were 1.6ppm/y and 2.1ppm/y respectively, a 40% increase. A least squares through the MLO data yields a 1.57ppm/y(+/-0.1) for the first period and 2.01ppm/y(+/-0.1) for the second, a 28% increase.
So that's the first 3 minutes of the 70 minute presentation. Selby compares 300% with 0% and says science is wrong and ignores this mismatch. But the 300% is not what he should be comparing and the 0% is a lie. You can even spot the lie on the next graph he presents. While the remaining 67 minutes of Sably's analysis does get more complex, it fails to get more truthful.
-
InnocentSmithReturns at 22:24 PM on 1 December 2015Murry Salby's Correlation Conundrum
Thanks for patience with a very basic question:
If the earth system is a net sink for CO2, and if human contribution prior to the industrial revolution was insignifigant, then shouldnt the long term trend of atmospheric CO2 prior to that point in time be headed towards zero ? But that is not what our historical data shows is it ? Or would it head towards a steady state where whatever is produced is constantly being completely absorbed (averaged over the long run)? But again is that what the historical record shows ? Thanks.
-
Jonas at 21:18 PM on 1 December 2015How much does animal agriculture and eating meat contribute to global warming?
Very interesting graphics, but please SkS, turn off the enhancing glass: it hinders me from taking the link of the graphics .. (anybody who wants to see bigger graphics use the browsers Ctrl/Cmd-"+" key: it's a nice looking gimmick, but for me it's disfunctional).
-
meher engineer at 19:14 PM on 1 December 2015How much does animal agriculture and eating meat contribute to global warming?
@2 C B Dunkerson, Regarding the futility of mitigating short lived Greenhouse Gases like CH4:
"A re-examination of the issues shows that the benefits of early SLCP mitigation have been greatly exaggerated, largely because of inadequacies in the methodologies used to compare the climate effects of short-lived substances with those of CO2, which causes nearly irreversible climate change persisting millennia after emissions cease. Eventual mitigation of SLCP can make a useful contribution to climate protection, but there is little to be gained by implementing SLCP mitigation before (my emphasis) stringent carbon dioxide controls are in place and have caused annual emissions to approach zero." the quote is from Short-Lived Climate Pollution, by R.T. Pierrehumbert http://www.annualreviews.org/doi/abs/10.1146/annurev-earth-060313-054843. the paper is wprth reading.
-
eschwarzbach at 18:37 PM on 1 December 2015Tracking the 2C Limit - October 2015
To the CFSv2 Forecast Model: I also was wondering about the V shaped peak in the graph, present for a couple of months. Being not a climatologist, but understanding a bit of statistics, the repeated V-shape indicates, that for a couple of months the observed SST were far outside the plume of the model forcasts, i.e. the SST were much higher than all the models predicted. Something must be wrong with the models.
Erik
-
Digby Scorgie at 18:03 PM on 1 December 2015The Road to Two Degrees, Part Two: Are the experts being candid about our chances?
Tom Curtis @24
I didn't want to initiate a discussion of alternatives to fossil fuel, but in broad outline what I believe would be feasible, though not at all easy to implement, is the following:
Gradually change over to renewables for all electricity production, with some nuclear power to handle the baseload. At the same time increase the efficiency of electricity use. In addition, people need to scale down their consumption and expectations.
For transport, gradually change over to synfuels for aircraft and ships, but also reduce the amount of flying people do and the quantity of goods needing to be shipped. For land transport switch to both electricity and synfuels for vehicles and to electricity for trains. Rely on telecommunications more and forgo cheap holidays overseas.
Regarding synfuels, I have been told elsewhere at this website that these are indeed feasible. This was after I discovered that ammonia has already been shown to work in both vehicles and aircraft (but with reduced efficiency) and that ammonia can be produced using renewable sources of electricity. There is no carbon in ammonia. Presumably the synfuels under investigation are better.
I have also discovered that, while the foregoing seems reasonable to me, people will inevitably poke holes in it. Never mind, I can take it!
-
Timothy Chase at 15:03 PM on 1 December 2015G R A P H E N E
In #13, scaddenp mentioned biofuels as a source of energy for jets. The following may be of interest...
"We used a chemical process called olefin metathesis, which earned its developers, Robert Grubbs and Richard Schrock, the Nobel Prize in Chemistry in 2005. In our newly published study, we showed that it selectively cleaves carbon-carbon double bonds of alkenones. The double bonds—and hence the cleaving—are ideally positioned in alkenones to produce fragments with shorter lengths similar to compounds used for fossil-based jet fuels."
Jet Fuel from Algae?
Scientists probe fuel potential in common ocean plant
By Chris Reddy, Greg O'Neil :: Originally published online January 28, 2015
http://www.whoi.edu/oceanus/feature/jet-fuel-from-algaeAnd yes, currently price would appear to be a bit of a problem:
"So we have isolated alkenones as a product with biodiesel oils and can use these unusual compounds made by a common algae to produce jet fuel. But based on the current cost of Isochrysis sold by a handful of vendors for purpose of shellfish feed (about $400 per kilogram), the fuels we have produced would cost at least $10,000 per gallon."
O'Neil, Gregory W., et al. "Production of jet fuel range hydrocarbons as a coproduct of algal biodiesel by butenolysis of long-chain alkenones." Energy & Fuels 29.2 (2015): 922-930.
http://pubs.acs.org/doi/abs/10.1021/ef502617z -
wili at 14:14 PM on 1 December 2015How much does animal agriculture and eating meat contribute to global warming?
Another thing that this piece overlooks is the degree to which people can alter their ghg emissions of one sort or another. Many people are stuck with, say, long commutes to work, required trips to conferences, appartments where they can't completely control the heat...
But diet is something that pretty much everyone has some ability to control by themselves. If it is one or one of the few things someone has control over, then it doesn't really matter how it stacks up against other contributors. If you can't change those, but can change your diet, everyone who can should be encouraged to do so.
-
scaddenp at 13:06 PM on 1 December 2015How much does animal agriculture and eating meat contribute to global warming?
TomR - this 2014 study attempted to estimate GHG emissions of various diets, standardized to 2000kcal/day. Their conclusion was that meat-eaters produced about twice as much GHG as vegan diets.
-
TomR at 11:24 AM on 1 December 2015How much does animal agriculture and eating meat contribute to global warming?
Your greenhouse gases for foods chart is grossly misleading since it lists by weight instead of by calorie and protein content.
For instance, one pound of dry beans contains five times as much protein and calories as tofu and costs much less, yet your graph makes them equals in global warming gases. Milk and yogurt have many fewer calories per pound and grams of protein per pound than nuts. Fat free, sugar free yogurt has only 200 calories per pound while nuts come in at roughly 1900 calorie. Thus, on a per calorie basis, yogurt is ten times more polluting than nuts and seven times world than rice or beans/lentils. That's huge.
Many vegetables don't do well on a per calorie basis, but to have some health benefits, while beef and pork definitely do not. Canned foods also have a much higher footprint due to the canning, so dry beans are several times less polluting than canned and, of course, have no BPA. Medical care has a carbon footprint, too.
-
wili at 11:06 AM on 1 December 2015The Road to Two Degrees, Part Two: Are the experts being candid about our chances?
Thanks, Tom. Was the other study you were thinking of the one discussed here?: www.skepticalscience.com/Macdougall.html
-
wili at 10:55 AM on 1 December 2015How much does animal agriculture and eating meat contribute to global warming?
(About 10 million pounds of beef from Brazil per month, for example.)
www.ers.usda.gov/data-products/livestock-meat-international-trade-data.aspx
-
wili at 10:51 AM on 1 December 2015How much does animal agriculture and eating meat contribute to global warming?
I'm wondering about the country-by-country comparison. Specifically, when the claim is made that "in the USA, fossil fuels are responsible for over 10 times more human-caused greenhouse gas emissions than animal agriculture," does that include all the cattle that are imported from other countries where forests are being destroyed to support them?
-
Tom Curtis at 08:04 AM on 1 December 2015Welcome to Skeptical Science
Bobbi @4, if you don't mind my saying so, you have made two of the classic errors of AGW denialism. The first is that you assume existing rates of a natural process represent the change in rates of the natural process. That is important in that we are trying to explain not the long term stable background concentration of CO2 (280 ppmv) but the recent rapid increase of the CO2 concentration by 120 ppmv. Background rates of processes in the CO2 cycle clearly cannot change the current rapid rise, for if they did there would also have been a rapid rise at similar rates over the whole of the holocene. It follows any background emissions of CO2 from wild fire are matched by background sequestration of CO2 so that the net longterm change in CO2 concentration in the atmosphere is zero. So, before taking your argument any further, you need to indentify the increase in CO2 emissions due to wildfire relative to background rates. As wildfire and controlled burnoffs due to Land Use Change (LUC) are already included as anthropogenic emissions in IPCC calculations, you also need to specifically identify how much of the increase in wildfire is not due to LUC.
The second classic error is to ignore the fact that any biological emissions of CO2, including by wildfire, comes from CO2 originally drawn down from the atmosphere by photosynthesis. That does not mean automatically that an increase in wildfire will not result in an increase in atmospheric CO2. Such an increase, with no matching increase in photosynthesis and with no matching decrease in respiration (either by animals eating the plant matter, or through natural decay of plant matter) could result in a decrease in carbon stored in plant matter and a consequent increase in CO2 in the atmosphere. But because of the close connection between photosynthesis and combustion, you need to look at the relative rates of each (and respiration) to determine what the net effect is.
As it happens, combustion of plant material from all sources including as a fuel, only accounts for about 2.4 PgC/yr emissions. Further, not only has the combined emissions of combustion of plant material plus respiration increased, but so also has photsynthesis by a larger amount (see chart below):

As a result the combined effect of photosynthesis plus respiration/combustion is to take 2.6 PgC/yr out of the atmosphere if we ignore LUC (ie, the natural effects only), or 1.5 PgC/yr including anthropogenic LUC. Both are a relatively small fraction of the 7.8 PgC per year from industrial emissions (fossil fuels pluc Cement) or 8.9 PgC/yr from all anthropogenic sources.
-
InnocentSmithReturns at 07:59 AM on 1 December 2015Murry Salby finds CO2 rise is natural
What I am about to ask may seem unfair, but it would be very helpful to me. As a former Process Control engineer I am very interested in where you see a mistake or error in the presentation at https://www.youtube.com/watch?v=K_hBOU26F5o I know you have posted arguments against Salby in the past, but what I am looking for is not counter arguements, but rather something like "At time frame 50:45" his math is wrong as follows..." or "At time frame 50:45, the assumption he makes is wrong based on the following research data [with reference to study data ] I want to keep the arguement tight and specific. I realize this is a lot of work, but you might gain a convert (me) if you can show me specifically where he goes wrong in this presentation. I am putting questions to Salby as well. Thanks!
-
scaddenp at 07:55 AM on 1 December 2015Welcome to Skeptical Science
Since you dont supply link for forest fire Co2 release nor show us your calculation, I cant comment except that your numbers seem at odds with other sources. The isotopic composition of excess CO2 in our atmosphere is consistant with FF (which have no C14 whereas forest do).
Forest fires dont produce long term change in CO2 concentration unless the forest is not replanted in something with similar carbon capture rates. Land use changes are an issue of course and you will see the accounting for that in IPCC reports.
Cutting CO2 emissions significantly means switching energy use to non-carbon sources. Using less also helps. The best way to make the cut is simply to ban building new power stations that emit CO2 - let the market figure out the best replacement technology as FF stations age out. That doesnt go well with right-wing "govm't restricting freedom" types so second best way is Friedmann economics and impose cost on the externality (the effect of CO2 emissions). In practise this is some sort of carbon trading or carbon tax which prices FF-generated power more expensively than non-carbon sources.
You dont need to reduce CO2 to pre-industrial age. You only need to slow climate change to a rate at which economic and human systems can adjust.
-
Tom Curtis at 07:41 AM on 1 December 2015How much does animal agriculture and eating meat contribute to global warming?
CBDunkerson @2, here is the CH4 cycle as estimated in AR5:

The important factors are the annual increase (17 Tg CH4/yr) and the cumulative increase (2970 Tg CH4/yr). As each molecule of methane (atomic weight 16) gets converted to a molecule of CO2 (atomic weight 44), these need to be multiplied by 2.75 to get the decay emission at Tg CO2, or by 0.75 for Tg C. To convert to Petagrams, we need to multiply by 0.00275 and 0.00075 respectively, giving a cumulative emissions after decay of 2.2275 PgC, and 0.01275 PgC/yr.
For comparison, here is the CO2 cycle from AR5:
The cumulative emissions after conversion amounts to 0.9% of CO2 emissions, and is well within error. The annual emissions amount to 0.3% of annual CO2 emissions and again is well within error.
The upshot is that methane can in fact be ignored for longer term planning (>200 years). Its decay time of 12.4 years, however, means it will take approximately 50 years to effectively remove the excess CH4 with no further emissions, meaning it is a very substantial player over the coming century.
-
ECLife at 06:48 AM on 1 December 2015Sea level rise due to floating ice?
Thanks for pointing out my quick assumption. I repeated the experiment with a balloon floating in 5% and 15% salt solutions and because it wasn't frozen, less dense, the balloon almost appeared neutrally buoyant in the 5% but more so in the 15% but the mass would be the same, displacing it's mass. When I popped the balloon, the change in the 5% was not really noticeable but was in the 15% solution.
Conversely, I would say that as sea ice is formed, the ocean will get more briney and levels would drop. It helps to think it through and realize our level is due to the floating and subsequent melting of ice, not the addition of 2 liquids.
-
Andy Skuce at 04:27 AM on 1 December 2015How much does animal agriculture and eating meat contribute to global warming?
Thanks for putting this in perspective, Dana.
I think that the point of focussing in on beef and dairy is not so much that we can solve the climate crisis this way, but that avoiding beef or just cutting down is something that everyone can do that will make a small difference to emissions, a significant improvement to personal health and a reduced impact on the land.
I should admit at this point that I am a non-observant vegetarian.
XKCD has a cartoon that nicely illustrates the disproportionate mass of the world's cattle, with the implication that they have an outsize ecological hoofprint. George Monbiot also has a recent article on what species is causing the biggest contribution to the population crisis.
-
Andy Skuce at 04:07 AM on 1 December 2015The Road to Two Degrees, Part One: Feasible Emissions Pathways, Burying our Carbon, and Bioenergy
I didn't include any discussion of biochar because I have yet to see a proposal that can scale up to the problem we face. ELIofVA, if you can provide a link that quantitatively lays out a program to solve the climate crisis through mixing charcoal into the soil, I would be happy to read it.
I don't doubt that biochar is a useful and sustainable practice in organic farming. It should improve the soils and it will help reduce emissions a little.
Perhaps I have been too much influenced by George Monbiot's assessment.
-
CBDunkerson at 03:45 AM on 1 December 2015How much does animal agriculture and eating meat contribute to global warming?
Given that methane in the atmosphere breaks down to carbon dioxide and water (CH4 + 2O2 -> CO2 + 2H2O) fairly quickly, shouldn't increased methane levels be considered as increased CO2 levels for longer term planning?
Basically, it seems to me like that whole '20 times more potent' bit on methane may inflate it's relative importance. Yes, in the short term one molecule of methane may be 'as bad' as 20 molecules of CO2... but the short term impacts are miniscule. In the long term that one molecule of methane is going to be one molecule of CO2... and thus methane emissions are, for practical purposes, equivalent to CO2 emissions.
Put another way... should the 14% global GHG impact from methane be viewed as a short term mathematical construct, with the actual long term impact actually more like 0.7% (14% / 20) once that methane becomes CO2?
-
ELIofVA at 03:34 AM on 1 December 2015The Road to Two Degrees, Part One: Feasible Emissions Pathways, Burying our Carbon, and Bioenergy
Why is there no discussion of biochar as Carbon Capture and Store technology. Making charcoal has been proven to capture carbon for at least thousands of years as proven by precolumbian cultures that made marginal rain forest land highly productive for growing foods. This technology creates charcoal by burning organic material in the absence of oxygen. The good part is that the charcoal has a great benefit in the short run increasing water retention, bio-organisms and micronutrients to improve food production and re-carbonize the soil. This gets around the problem of where to put the sequestered carbon. It still depends on plants sequestering the carbon from the atmosphere. However, unlike reforestation alone, it prevents much carbon from re-emitting co2 from decomposition in a short time frame. Finding immediate benefit for the uses of biochar gives a short term economic incentive that could eventually be of measurable benefit to the atmosphere. Just like a bleeding patient, stopping the bleeding (burning) is the most critical. However, the nurturing the conditions to increase new blood (sequestration) is a much slower but important process.
-
Bobbi at 02:16 AM on 1 December 2015Welcome to Skeptical Science
I've done two calculations to determine the contribution to atmospheric CO2 from wildfires, compared with burning fossil fuels. I did not include Volcanoes or other natural CO2 sources. When I estimated forest density, I came up with wildfires producing 88 times fossil fuel CO2 production. When I found pre-computed numbers, I found that wildfires and fossil fuel burning are comparable.
Assuming that forest fires produce the same amount of atmospheric CO2 as burning fossil fuels, and the half-life of atmospheric CO2 being 500 years, even if the entire WORLD shut down all fossil fuel burning (impossible!), the reduction in atmospheric CO2 would take centuries. And, since making more than a 25 cut in global fossil fuel use is unlikely, we are in this mess for the long haul. So, my questions to you are:
1. What do you propose to realistically cut CO2 significantly?
2. How long will it take to reduce CO2 levels to pre-industrial age amounts?
Thank you in advance,
Bobbi
Moderator Response:[RH] Changed all-caps to italics. Please avoid all-caps, per commenting policies.
[edit] Also, please show us your calculations that estimate forest fires produce 88 times the CO2 as FF emissions.
-
Cooper13 at 01:34 AM on 1 December 2015How much does animal agriculture and eating meat contribute to global warming?
Excellent post.
The flow charts are a fantastic visualization of the ratios for various energy uses and related emissions. This really points to the core targets that Americans can work on for overall emissions reductions, and where they can make the biggest impacts.
-
Miriam O'Brien (Sou) at 01:25 AM on 1 December 2015A Buoy-Only Sea Surface Temperature Record Supports NOAA’s Adjustments
A big thank you to you both, Zeke and Kevin. This is really useful and not a surprise, given the work I know went into preparing ERSSTv4. I like it that you've now included a comparison with Argo data, which contradicts what some people have been claiming. I'll be referencing this article from time to time.
-
Tom Curtis at 00:29 AM on 1 December 2015The Road to Two Degrees, Part Two: Are the experts being candid about our chances?
RickG @31, unlike CO2, aerosols do not become well mixed in the atmosphere. As a result the negative forcing in relation to US/European aerosols was largely confined to the North Atlantic region, while those from China are largely confined to China. That is significant because there is evidence that the North Atlantic region is more sensitive to forcings than most other regions of the globe. This is most obvious with the impact of the milankovitch cycles forcing the glacial cycle due to strong NH summer insolation despite near zero global forcing. (Note, nearly all the major glacial ice sheets are associated with the North Atlantic.)
The upshot of this is that it is not a given that a given aerosol concentration over China will have the same masking effect as the same aerosol concentration over Europe/NA. So while increases aerosol emission will mask some warming, it is difficult to determine how much.
-
RickG at 00:22 AM on 1 December 2015The Road to Two Degrees, Part Two: Are the experts being candid about our chances?
I wonder, with respect to the cooling period from 1940 to the mid 1970s, which masked actual warming due to sulfate emissions; are there any projections as to what increased sulfates in Asia may be masking?
-
Tom Curtis at 00:20 AM on 1 December 2015The Road to Two Degrees, Part Two: Are the experts being candid about our chances?
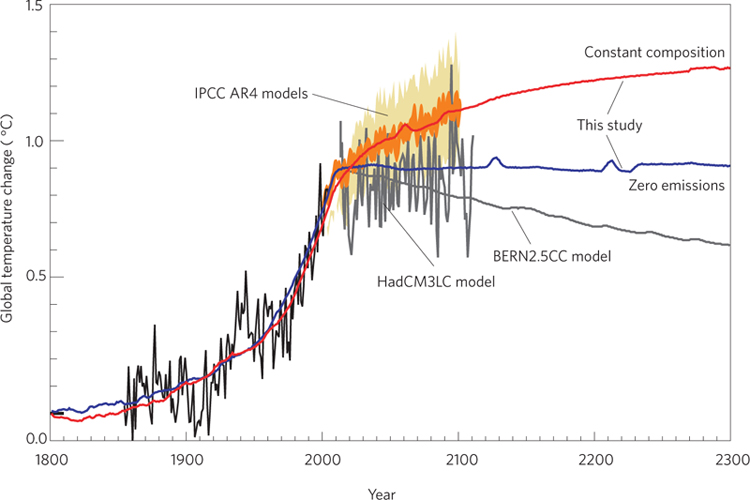
wili @28, no we have not. The reason is that, with zero net emissions, CO2 concentrations in the atmosphere will be drawn as excess CO2 is taken up by the ocean. This process is fairly rapid and occurs on approximately the same timescale as the rise in temperature from the Transient Climate Response to the Equilibrium Climate Response. It follows that, with zero net emissions, temperatures will remain approximately constant, as shown in this graph from Matthew's and Weaver (2010):
Although Matthews and Weaver show a constant or slightly declining temperature with zero net emissions, a more recent study (not to hand at the moment) has shown the possibility of a slightly rising temperature as well, although this is most probable with low ECS so the rise in that case would be gradual and restricted. In any event, so long as we achieve zero net emissions before we reach 1.5 C, and possibly 1.9 C, we can prevent mean decadal temperatures rising above 2 C above the preindustrial average.
That's the good news. The bad news is that even continuing emissions as low as 5% of current emissions may (and certainly emmissions at 10% of current levels will) be enough to kick us into the constant CO2 concentration path (red line above). In that case whether or not we exceed 2 C depends on whether the ratio of 2 C divided by current temperature above preindustrial is less than, or exceeds the ratio of ECS to TCR, which means even another 0.2 C rise will make us 50/50 to avoid 2 C at best. Further, ongoing emissions at the 5% rate will in the long term (400 plus years) result in an ongoing gradual rise in temperature for up to tens of thousands of years into the future (or until we reach zero net emissions).
Further, this analysis ignores the effect indicated @15 above. That probably means we require slightly negative net emissions of CO2 to achieve zero net CO2eq emissions. (Note, for the long term, multi-centenial temperature rise, it is zero net CO2 emissions that matter, not zero net CO2eq emissons, due to the relatively short atmospheric lifetime of WMGH gases other than CO2.)
-
wili at 23:19 PM on 30 November 2015The Road to Two Degrees, Part Two: Are the experts being candid about our chances?
On feedbacks, see most recently this: GW will be faster than anticipated (because of methane feedbacks from lakes)
Prev 520 521 522 523 524 525 526 527 528 529 530 531 532 533 534 535 Next


