


 Arguments


Recent Comments
Prev 524 525 526 527 528 529 530 531 532 533 534 535 536 537 538 539 Next
Comments 26551 to 26600:
-
Tom Curtis at 10:02 AM on 17 November 20152015 SkS Weekly Digest #46
RobH @1, from page 10 of the Pew Article, we find the number of respondents by discipline:

Running the percentages, that is 49.5% from biological or medical, 13.7% from chemistry, 6.1% from geosciences, and 9% from physics and astronomy. From the first table on page 3 we find that 497, or 19.6% are in some other discipline, with 50 not responding to this question. Further, from first table on page 3, only 66% of respondents were actively involved in research. From those figures it is uncertain how many of those surveyed were actual climate scientists but it was certainly significantly less than 50%. Further, around 50% are from a discipline from which we would not expect any significant background knowledge to assist in understanding climate science.
These results are very similar to the Doran (2009) survey of Earth Scientists, of which 8.5% of 3,146 respondents published on climatology, 5% were climatologists, and 2.5% where climatologists actively publishing on climatology. Doran (2009) showed the following results on the attribution question:
That shows an 88% 'consensus' among active publishers on all topics (ie, actual research scientists) when restricted to earth scientists only, but only a 76% 'consensus' among nonpublishing, non climatoligists. Famously it found a 97% consensus among actively publishing climatologists on attribution. That is, as expertise declines as measured by either discipline, or area of research so does confidence in the consensus on attribution - but among those who are most expert as measured by both discipline and research activity, there is a 97% consensus. The results of the 2009 Pew survey of scientists are quite consistent with this.
While on the topic, the actual climate change questions in the survey were:
"Which of these three statements about the earth’s temperature comes closest to your view?
1 The earth is not getting warmer2 The earth is getting warmer mostly because of natural changes in the atmosphere [OR]
3 The earth is getting warmer mostly because of human activity such as burning fossil fuels
9 Don’t know/Refused"and
"In your view, is global warming a very serious problem, somewhat serious, not too serious, or not a problem?
1 Very serious
2 Somewhat serious
3 Not too serious
4 Not a problem
9 Don’t know/Refused"There is no ambituity in these questions on which the deniers can play their typical word games to avoid the results of a survey - though no doubt they will try.
-
bibasir at 02:56 AM on 17 November 2015Exxon climate revelations are just part of a long history of science misinformation
The New York Times article referenced below details how Exxon's own research in 1995 concluded CO2 emissions were causing global waarming. The link still works.
http://www.nytimes.com/2009/04/24/science/earth/24deny.html
“Back in the 90s, the Global Climate Coalition, led by ExxonMobil, did fund scientists to determine the cause of global warming. GCC’s own scientists concluded that human emissions of GHGs were responsible so they promptly squelched that report and began funding front groups to deny the science and to confuse the public.
But a document filed in a federal lawsuit demonstrates that even as the coalition worked to sway opinion, its own scientific and technical experts were advising that the science backing the role of greenhouse gases in global warming could not be refuted.”
“The scientific basis for the Greenhouse Effect and the potential impact of human emissions of greenhouse gases such as CO2 on climate is well established and cannot be denied,” the experts wrote in an internal report compiled for the coalition in 1995.
Moderator Response:[PS] Fixed link
-
wili at 01:36 AM on 17 November 20152015 SkS Weekly News Roundup #46
For the next news roundup?
According to the JMA, October 2015 (+0.53C) is a new record, beating the record set last year by whopping +0.19C. This makes is just the second month on record, and second month in row, with an anomaly of at least +0.5C above the 81-10 average. This is now also the largest anomaly for any month on record.
-
Joel_Huberman at 01:25 AM on 17 November 2015G R A P H E N E
I want to reinforce the comment of Mark Welsch @15. There's no need to wait until graphene is commercialized. In some locations, renewable energy with current technology (wind, solar) is already better than fossil-fuel energy in terms of price. With a gentle push from a steadily rising fee on fossil fuels, based on their CO2 emissions, and with all of the fee revenue (minus a few percent for administration) being returned to legal residents on a per capita basis to cushion against the rising price of energy, renewable energy will gradually become the superior energy choice throughout the world. By joining and working with Citizens' Climate Lobby (CCL), everyone reading this post can contribute to this essential acceleration of the transition away from fossil fuels. Since I joined CCL last April, I've been increasingly impressed by the quality and effectiveness of its work. It's a non-partisan, international organization that, in the United States, works constructively with both Republicans and Democrats. I'm optimistic that it will succeed in getting "carbon fee and dividend" legislation passed in the United States, even in a Republican-dominated Congress, within the next few year. By joining and working with CCL, you can help accelerate this process.
-
RobH at 00:13 AM on 17 November 20152015 SkS Weekly Digest #46
Good Grief! Who are the 3 to 16% of global scientific community who dont accept that humans are causing climate change?
-
CBDunkerson at 22:53 PM on 16 November 2015Exxon climate revelations are just part of a long history of science misinformation
ryland, what "for-hire think tanks" do you believe "proponents of AGW" employed? NASA?
What industry do you believe has been 'funding a public misinformation' campaign to promote the existence of global warming? Where is your evidence of the big payments this group (the Illuminati?) has made to Fourier, Tyndall, Arrhenius, Callendar, Keeling, and other scientists who have been building this 'false story' for the past 200 years?
As to NSW, the article you linked requires a site-subscription to view, but others on the subject quote the same man as saying, "Changes to climate are likely to intensify our existing hazards", and give the impression that what he is advocating (and it is apparently being hotly disputed, rather than the settled government policy you suggest) is a change to local beach maintenance regulations from the 70s - rather than anything to do with the IPCC at all. Which makes sense, given that the IPCC reports don't even have that kind of district planning guidance in them. Basically, it looks like you have just fallen for yet more propaganda... frauds recasting an announcement about local government organizational minutiae into a slam on the IPCC.
-
Eclectic at 20:26 PM on 16 November 2015Exxon climate revelations are just part of a long history of science misinformation
Not quite sure what point you are aiming to make there, Ryland @ #1.
If you are stating that promoting a lie is no better or worse than promoting truth . . . then you are simply being absurd. If you are stating that knowingly promoting a lie is no better or worse than unwittingly promoting a lie . . . then you are simply being absurd, also.
For a quarter-century or more, there has been "nowhere to hide" for the climate-science deniers who would wish sincerely to consider their viewpoint somehow valid. And even a half-century or more, for the tobacco-science deniers.
Being duped by propaganda is a separate matter ~ but nobody is seriously suggesting that it is the "dupes" who are deliberately funding the science-denying propaganda.
-
ryland at 20:14 PM on 16 November 2015Exxon climate revelations are just part of a long history of science misinformation
My apologies for not putting this snippet of news in the above post but I have only just become aware of it. It appears the NSW government is advising councils to no longer follow the predictions of the IPCC on climate change and sea level rise when considering applications for building. The Planning Minister has advised he will be announcing “a much more scientific and evidence-based approach … it reflects recognition that what is happening on the coast is a product of what is happening to the sand off the coast,” he said.
“We will be integrating coastal management and planning with what is happening in the adjacent seabed.” The reference is here.
It will be interesting to see if similar changes to other IPCC predictions result in changes in the public viewpoint.
Moderator Response:[JH] Here is Ryland's "above post". I deleted it by mistake. My apologies to Ryland and everyone else reading this thread.
Mr Cook, you make this comment with regard to the Tobacco and Fossil Fuel industries:
"Both had excellent lobbyists. Both employed front groups and for-hire think tanks as those grew in the 1990s. Both used whatever media were available, starting with print and radio, and now the Internet".
Isn't this exactly what the proponents of AGW also do to get the message across? Isn't it rather hypocritical to condemn the tobacco and fossil fuel industries for doing what the IPCC and sites like this also do?
In fairness, you do go on to say "Both funded public misinformation campaigns long after their own scientists had discovered the truth". There are many outside the community of climate scientists, who, while perfectly sure climate change is happening, are not convinced humans are as much to blame as is suggested by politicians and climate scientists. See examples here and here. These people may well be and from their comments indeed are, of the opinion that they are subject to "public misinformation campaigns" and that the truth has yet to be discovered
-
Tom Curtis at 12:43 PM on 16 November 2015Why were the ancient oceans favorable to marine life when atmospheric carbon dioxide was higher than today?
bozza @3, geological events are not timed based on "acceptable error values". They are timed using the means available to as high an accuracy as is technically feasible. Errors in the hundreds of thousands of years in the mid phanerozoic are achievable in some circumstances (example), and of one to three million years in many circumstances (example).
Further, uncletimrob's claim that dating uncertainty makes answering the question in the OP's title impossible is simply false. First, the answer has been given by detailed computer modelling as shown in Fig 3. Second, the answer has been confirmed by a large number of emperical studies where relative dating based on stratigraphy is sufficient to distinguish later from earlier times and provide an answer, even if precise absolute dating is impossible.
-
bozzza at 00:40 AM on 16 November 2015Why were the ancient oceans favorable to marine life when atmospheric carbon dioxide was higher than today?
...by definition the error is atleast tens of millions of years assuming an acceptable error value of +/- 5%!
-
bozzza at 00:28 AM on 16 November 2015Video: Drought, Climate, Security, and Syria
@1,
The difference between 'direct' and 'indirect' causation is not as big as the language might have you believe.
Words do not contain the truth according to some interpretations of eastern scriptures... suffice to say: when Bruce Lee narrated that when he points at the moon he also narrated that you and all others concerned should not look at his finger or you will miss all the heavenly glory!!!
-
braintic at 22:47 PM on 15 November 2015CO2 effect is saturated
Rob Honeycutt:
Mike Sanicola is Morgan Wright. He runs the Hyzer Creek Disk Golf course in New York. His YouTube ID is hyzercreek. "Mike Sanicola" is actually the name of a baseballer who was drafted to the Yankees in 1983, was seriously injured, then went into the ministry.
As Morgan Wright, he claims to be an optometrist. In his most recent YouTube comments, he made the mistake of mixing the two identities, which tipped me off to the Sanicola identity.
He says "I'm an opticist, who specializes in optics and IR. I worked for GE's infrared department and designed infrared telescopes for GE that were used by NASA in outer space. I invented the ambient temperature microbolometer."
Also, no proof yet, but I am beginning to wonder if he is actually Steven Goddard. He regularly links to Goddard's site, and their manner of speech and desire to advertise dual occupations are eerily similar.
-
chriskoz at 10:26 AM on 15 November 2015Video: Drought, Climate, Security, and Syria
michael sweet@3,
Sport is entertainment while AGW is a battle for survival in increasingly hostile environment. So different situations are and so different moods in them, that the same subjective perceptions (as you would imagine) will never apply.
In an entertainemnt, the culprit is saught because the good time was "spioled".
In a battle for survival, a denial (sometimes deep rooted) is the first and someimtes only response, from both victims and vested interests causing it. Also note that as AGW is a major cause of war in Syria, the media try to ignore that link (denial at that level), instead trying to inflate the attribution of other causes: religious conflicts, military intervention by West, etc.
-
shoyemore at 01:48 AM on 15 November 2015Video: Drought, Climate, Security, and Syria
Another good analogy I read is the role of speed in motor accidents.
Speed (driving faster than the conditions warrant) may not directly cause road fatalitities, but it reduces the options, increases the risks and makes deaths or serious injuries more likely. A "threat multiplier", in other words, much like climate change and geopolitics.
-
MA Rodger at 23:03 PM on 14 November 2015Climate's changed before
NN1953VAN-CA @508.
Your observation that there have been large variations in temperature as reconstructed by the Vostock ice core data does not contradict "GHG theory". You point to a 3.17°C variation over the 163 year period 397-234ybp within that Vostock data. And if you examine the GISP2 data, there are variations of a similar scale, for instance a 3.7°C variation over a 393 year period.
As Tom Curtis @507 pointed out, a single location will show greater variation in temperature than will a global average. And the poles will be the places where such local variations are expected to be the greatest. Also mentioned @507, the graph shown @507 does contain the Vostock and GISP2 data but the data are strongly smoothed so only longer-lasting wobbles will appear at full size.
Sadly the different shades of blue used in the graph @507 are not particularly clear. In the graph, Vostock is one of the two dark blue traces. Your -3.17°C variation being a very sudden variation (the preceeding 155 years show a +2.9°C variation and the following 44 years a +2.2°C variation), it is dramatically smoothed out in the graph and appears as a dip of -0.2°C. GISP2 is one of the light blue traces and for the most recent millenium it is the bottom trace on the graph. The GISP2 data contains variations that are far less sudden than with Vostock so less of the GISP2 wobbles are smoothed out.
But let us here use the un-smoothed data as provided. While the period 397-234ybp show a -3.17°C variation at Vostock, the GISP2 data over the same period shows a maximum variation of just -0.15°C. If we take just these two temperature records as a very crude global average, we get a variation of -1.66°C. Add in further variations from elsewhere in the globe (which even if of the same sign we would expect to be yet smaller) and the Vostock data becomes less prominent still. Simply, the Vostock variations are not at all a good representation of global average temperature variations over the time periods you are examining.
And to repeat this exercise for the biggest GISP2 variation, the +3.7°C variation over the 393 year period 8210-7817ypb. This appears strongly on the graph @507 as a +2.5°C variation. Over this full period 8210-7817ybp period the Vostock temperature ends at a similar temperature to the period start. Thus the two records average out as a +1.35°C variation and again would be diluted further when more temperature records are included. There is a complication with this data as the 8210-7817ybp period does include a 2.9°C Vostock deviation during part of the the 393 year period. When Vostock & GISP2 are average out, that deviation reduces to +2.2°C variation over a 91 year period. This is by far the most dramatic variation for an average of Vostock & GISP2 over the 10,000 years. Add in more data to get a better global average and it will certainly flatten out but probably still be visible. In the graph @207, this period shows a +0.4°C variation despite the smoothing, but in this 8-series global average the polar regions are grossly over-represented. (If Vostock & GISP2 were taken as representing respectively the whole antarctic & arctic, that would be only 7.5% of the globe.)
Thus we can conclude that over the last 10,000 years when CO2 has been comparatively unchanging, there have been only small wobbles in global average temperature, as the graph @507 crudely demonstrates. Yet, as "GHG theory" predicts, now that CO2 is increasing there will be (and indeed is) a much larger increase in that global average temperature.
-
michael sweet at 21:55 PM on 14 November 2015Video: Drought, Climate, Security, and Syria
I like the analogy of AGW as being like a baseball player on steroids. Say a pllayer hits 20 home runs in a season. After steroids he hits 40 home runs. How many should be attributed to the steroids? All the sports fans I know say all the tainted home runs should be disqualified. For AGW that would mean that the entire Syrian war was due to AGW.
It is interesting to me that for AGW the standard is set so high for the question "did AGW cause this affect". Hansen has show that 99% of all hot summers are caused by AGW Scientists still say we do not have enough data to attribute the Syrian drought to AGW. If it were sport we would dismiss all other contributions to the war and just say it was drought from AGW.
What fraction of the cause needs to be AGW for AGW to be assessed as the main cause? Since everything has multiple causes, it seems to me that AGW will never take the blame since there are always other contributors. The Syrian war would not have occured without the record droght that preceeded it. The drought was a record because of AGW.
-
0^0 at 20:24 PM on 14 November 2015The Skeptical Science temperature trend calculator
Okay - I guess that was a bit trivial question.. In the output
ar1 ma1 intercept time(ds_hadcrut4_global_yr_subset$value)
-0.5092 0.7643 -0.2845 0.0168
s.e. 0.2951 0.2214 0.0351 0.0018I get 0.0168 ==> 0.168 C/decade and s.e. 0.0018 ==> +- 1.96*0.0018 = 0.035 C/ decade which is close to what I get now from calculator here for the 1980-2013 period (using the same for autocorrelation period)
Trend: 0.164 ±0.044 °C/decade (2σ)
β=0.016402 σw=0.00067164 ν=10.771 σc=σw√ν=0.0022043Using sarima(ds_hadcrut4_global_yr_subset$value,1,1,1) based on some ideas in a tutorial I get even more close to that
ar1 ma1 constant
0.2161 -1.0000 0.0165
s.e. 0.1753 0.0999 0.0020Need to recheck my input data to find in which detail of my excercise the devil is..
-
NN1953VAN-CA at 18:16 PM on 14 November 2015Climate's changed before
Response to moderator
Reference are Ice core tables:
Vostok
Greenland
Historical Isotopic Temperature Record from the Vostok Ice Core
Deuterium
Age of content Temperature
Depth the ice of the ice Variation
(m) (yr BP) (delta D) (deg C)
0 0 -438.0 0.00
1 17 -438.0 0.00
2 35 -438.0 0.00
3 53 -438.0 0.00
4 72 -438.0 0.00
5 91 -438.0 0.00
6 110 -438.0 0.00
7 129 -438.0 0.00
8 149 -442.9 -0.81
9 170 -437.9 0.02
10 190 -435.8 0.36
11 211 -443.7 -0.95
12 234 -449.1 -1.84
13 258 -444.6 -1.09
14 281 -442.5 -0.75
15 304 -439.3 -0.22
16 327 -440.9 -0.48
17 351 -442.5 -0.75
18 375 -436.6 0.23
19 397 -430.0 1.33
temperature variation from -1.84 at year 234 BP
to 1.33 at year 397 BP
temperature variation 3.17 time 163 years
for Grenland ice core measurements temperature/ time variation takes longer, it is some 2K years for 3 degrees in temperature difference.
The only reason I reference those two is that there temperature difference is the smallest at those points. Global temperature was different but variation may have been close to those changes.
Sorry if my sentence:
'I do understand nature around me' sounded dismissive as to reply to your statement:
'Just because you don’t understand something doesn’t mean that science doesn’t either.'
your opinion on my understanding.
I was not intended to be dismissive, just stating that I do look around and look for reasons beyond.
Why I mentioned C02 content as stable, for long period of time is to question statements that with present C02 content, GT is expected to be higher, and it is not.
There are other factors as Milankovitch’s cycles, dust in the atmosphere as of volcanic activity or due to meteor hitting the earth, proportion variation in sea/land as at ice age or warm periods. etc
I was not dismissing all other factors which are affecting GT change.Present C02 concentration in the atmosphere is not reflecting GHG theory and that is what I was trying to express.
Moderator Response:[PS] In the role of moderator, my intention is provide guidance on what is acceptable on this site in terms of comments policy, constructive argument, and also to point to appropriate source material that should be considered. Please respond to the points made by other commentators that have addressed your argument directly. You would make discussion of your case against 'GHG theory' better if you did the following:
1/ Outline your understanding of what science predicts. References to at least the IPCC if not primary literature preferred for this prediction.
2/ Present the observations that you think contradict that prediction.
As it stands at the moment, we believe you are mistaken about what GHG predicts and mistaken in your interpretation of ice-core observations. A clearer statement would both will help clear confusion.
-
Digby Scorgie at 12:06 PM on 14 November 2015Video: Drought, Climate, Security, and Syria
The video was interesting but did they have to use the horrible head-thumping background music?
Is it because people today need this awful music to focus scarce mental resources on the task of understanding verbal messages?
-
Riduna at 11:12 AM on 14 November 2015G R A P H E N E
MA Rodger @ 18. … Graphene is a technology that is still in the laboratory
Difficult to say because for commercial reasons, its users tend not to announce their activities. Market demand for significantly improved energy storage and the huge profits to be made from its provision, makes it likely that commercial use of graphene technology will occur sooner than later. A 15 year time span for its wide commercialization is an informed guess. It may be wrong.
That Tesla batteries will use graphene technology is speculative – we don’t know. That Porsche will use graphene in batteries for its ‘Mission E’ (2018) sportscar is more likely given its claim of a 15 minute recharge time (1). The explicit statement of Sunvault-Edison that it will use graphene technology to power its Electron-1 car, (2016) if true, may indicate early commercialization (2).
(1) http://www.drive.com.au/it-pro/porsche-unveils-allelectric-mission-e-sports-car-20150916-gjog22.
(2) http://www.teslamotorsclub.com/showthread.php/52844-Edison-Electron-One
-
Tom Dayton at 10:42 AM on 14 November 2015Models are unreliable
Hawkins and Sutton are about to publish a peer-reviewed article explaining why and how choice of reference period is important when comparing model projections to observations. A pre-publication version is available now.
-
sifeher at 03:43 AM on 14 November 2015Video: Drought, Climate, Security, and Syria
Thank you for citing this interesting and timely article. The Middle East wars may not have been caused directly by global warming, but it is certainly contributing to the migration of millions from that region and also from Africa. It would be good to call this to the attantion of the G20 meeting in Istambul next weekend and before the Paris climate summit.
-
Lloyd Flack at 20:10 PM on 13 November 2015G R A P H E N E
I'm worried by the possibilty that cells could be damaged by the phsical presence of sharp particles in similar ways to asbestos. For now I think it wight be a good idea to use similar precautions to those used in dealing with asbestos. There is the potential for cancers which take a long time to develop,
-
Trevor_S at 18:24 PM on 13 November 2015Lamar Smith, climate scientist witch hunter
The strain of anti-intellectualism has been a constant thread winding its way through our political and cultural life, nurtured by the false notion that democracy means that 'my ignorance is just as good as your knowledge.” ― Isaac Asimov
-
0^0 at 17:21 PM on 13 November 2015The Skeptical Science temperature trend calculator
I'm still a bit new to R and ARIMA - and I have quite some difficulty in locating where in arima output you actually get those values "1.52+-0.404"
"Nick Stokes at 09:13 AM on 29 August, 2013
KR,
Thanks, I should have looked more carefully at the discussion above. I did run the same case using ARMA(1,1)
arima(H,c(1,0,1),xreg=time(H))
and got 1.52+-0.404, which is closer to the SkS value, although still with somewhat narrower CIs."
I may have problems in getting my input data right - or processing / reading it.. Or both.. :(..
Should those numbers be available from someplace here in this output?
Call:
arima(x = ds_hadcrut4_global_yr_subset$value, order = c(1, 0, 1), xreg = time(ds_hadcrut4_global_yr_subset$value))Coefficients:
ar1 ma1 intercept time(ds_hadcrut4_global_yr_subset$value)
-0.5092 0.7643 -0.2845 0.0168
s.e. 0.2951 0.2214 0.0351 0.0018sigma^2 estimated as 0.00739: log likelihood = 35.09, aic = -60.18
ds_hadcrut4_global_yr_subset$value contains - or at least should- yearly averages from monthy anomalies 1980 - 2013..
Thanks!
-
uncletimrob at 17:07 PM on 13 November 2015Why were the ancient oceans favorable to marine life when atmospheric carbon dioxide was higher than today?
Sorry, but your question asks the impossible because 300 million years is so big compared to anything we as humans have experienced.
Its the same scale as saying something happend 1 year ago, and then asking about a year and 1/10th of a second ago.
Geologic time scales are hard to comprehend and of course can only be very general and never down to the nearest year. I'd suggest that the "error" is a few tens of millions of years, but will be happy to be corrected by somenone with more expertise than me.
-
Tom Curtis at 16:26 PM on 13 November 2015G R A P H E N E
Some graphene related MSDS:
"Potential Acute Health Effects: Slightly hazardous in case of skin contact (irritant), of eye contact (irritant), of ingestion, of inhalation.
Potential Chronic Health Effects:
CARCINOGENIC EFFECTS: Not available.MUTAGENIC EFFECTS: Not available.
TERATOGENIC EFFECTS: Not available.
DEVELOPMENTAL TOXICITY: Not available.The substance is toxic to upper respiratory tract. The substance may be toxic to cardiovascular system. Repeated or prolonged exposure to the substance can
produce target organs damage."Graphene films on SiO2/Si substrate:
"Potential Health Effects: Generally not hazardous in normal handling, however good laboratory practices should always be used."
"EMERGENCY OVERVIEW: THIS MATERIAL MAY BE AN IRRITANT TO EYES, SKIN OR RESPIRATORY TRACT.
Potential Health Effects: Eyes – may cause eye irritation. Skin – may cause skin irritation. Respiratory tract/inhalation – may cause irritation.Ingestion – not hazardous in normal industrial use circumstances. Cancer – natural graphite may contain small amounts of impurities of 0% - 1% crystalline silica, which is listed as a Group 1 carcinogen by IARC and as a suspected human carcinogen by ACGIH. Inhalation of high concentrations of crystalline silica over prolonged periods of time has been linked to an increase in lung cancer. Inhalation of high concentrations of crystalline silica over prolonged periods of time may also cause silicosis. Inhalation of high concentrations of graphite dust over prolonged periods of time may cause pneumoconiosis.""EMERGENCY OVERVIEW: THIS MATERIAL MAY BE AN IRRITANT TO EYES, SKIN OR RESPIRATORY TRACT.
Potential Health Effects: Eyes – may cause eye irritation. Skin – may cause skin irritation. Respiratory tract/inhalation – at high concentrations may cause irritation. Ingestion – not
hazardous in normal industrial use circumstances. Cancer – natural graphite may contain small amounts of impurities of 0% - 1% crystalline silica, which is listed as a Group 1 carcinogen by IARC and as a suspected human carcinogen by ACGIH. Inhalation of high concentrations of crystalline silica over prolonged periods of time has been linked to an increase in lung cancer. Inhalation of high concentrations of crystalline silica over prolonged periods of time may also cause silicosis.
Inhalation of high concentrations of graphite dust over prolonged periods of time may cause pneumoconiosis.
Physical Hazards: Graphite is electrically conductive. Care should be taken, therefore, to avoid accumulations of graphite dusts or powders in places where these accumulations could cause shorting of electrical switches, circuits or components.""Potential Health Effects: Generally not hazardous in normal handling, however good laboratory practices should always be used."
The upshot appears to be that there is no evidence of significant toxicity from graphene itself, although doping agents can make it toxic. It does act as an irritant (as does any fine dust), but that is not a major problem.
-
Riduna at 12:55 PM on 13 November 2015G R A P H E N E
Katesisco @ 9– The US Materials Safety Data Sheet warns against inhalation of pure graphine particulates (dust) which causes cellular damage in the lungs resulting in emphysema. It describes skin and eye contact with dust as a mild irritant and gives no information on carcinogenic effects, if any. More work on its industrial use is needed since it does not address graphene compounds.
Moderator Response:[PS] A reference would help please.
-
Digby Scorgie at 11:25 AM on 13 November 2015Lamar Smith, climate scientist witch hunter
Science-haters in positions of power imperil democracy.
-
wili at 08:41 AM on 13 November 2015Why were the ancient oceans favorable to marine life when atmospheric carbon dioxide was higher than today?
" As far as we can tell, looking back over the last 300 million years"
When I see these kinds of claims, I always want to know--was there a more rapid acidification event 301 million years ago? Or is this just as far back as we can accurately reconstruct acidification events at this point?
Does anyone know which of these scenarios we are dealing with here?
-
G R A P H E N E
Regarding ultracapacitors, batteries, etc - the best solution for electric transportation will likely be a mix. Hybrid electric storage designs have a lot of advantages.
- High energy density but slow storage: Li-Ion batteries, Zinc-air batteries (very high density), fuel cells, whatever comes down the road. These have limitations on charge and discharge rate, which among other things really limits regenerative braking. If the batteries cannot accept energy at the rate of braking, that energy is lost (to normal brake pads, big resistors, etc) as heat.
- High power density but limited storage: ultracapacitors can charge/discharge in milliseconds, but with lower energy density they aren't good candidates for primary storage (yet).
A combination of the two permits complete regenerative braking and avoids oversizing battery packs for acceleration - a win-win situation.
Ultracapacitors are currently in use on about 1 million 'micro-hybrid' cars to run stop/start cycles, where the fossil fuel engine is shut down when stopped instead of idling in traffic.
-
MA Rodger at 20:28 PM on 12 November 2015G R A P H E N E
Graphene is a technology that is still in the laboratory and like so many similar technologies is surrounded by all the hype which is employed to attract the attention of the movers & shakers. The technology is at the point of demonstrating laboratory devises comparable in weight to lead-acid batteries but being capacitors rather than batteries they have blindingly fast charge/discharge rates. This achievement allows talk of matching lithium-ion batteries for weight, although such batteries are themselves also a developing technology. Yet rapid charging rates make the total on-vehicle capacity of graphene capacitors (and thus its weight) a different priority than it is for batteries. I don't think graphene is being seen anywhere as powering airliners. However there is another very interesting applcation mentioned in this SkS post. Being made of carbon rather than lead, the technology could be more amenable to scaling up in capacity to allow the useful storage of renewable power and enabling that 24/7 supply.
-
bozzza at 19:50 PM on 12 November 2015G R A P H E N E
@ 11,
So not even graphene will make electric airplane travel possible?
-
bozzza at 19:46 PM on 12 November 2015G R A P H E N E
The issue with subsidies for fossil fools is: ..THAT OF GREASING THE PALMS OF INDUSTRY...aka: TOO BIG TOO FAIL!
Power runs industry and prevents anarchy and holds all borders etc...(.. not to mention preventing house, and therefore massive city-wide, fires from candle-lit after dark shin-digs!!_
Moderator Response:[JH] The use of "all caps" constitutes shouting and is prohibited by the SkS Comments Policy.
-
ubrew12 at 14:50 PM on 12 November 2015Lamar Smith, climate scientist witch hunter
If Lamar Smith has a problem with the modern temperature record, he should contact the BEST survey. Easiest way to do so is to contact their funders: the Koch Brothers. Surely Smith has the Koch Brothers on his speed-dial...
-
Mark Welsch at 13:54 PM on 12 November 2015G R A P H E N E
If we could get rid of subsidies for coal and other fossil fuels, this and other types of green electric generation and storage would happen more quickly. Or, we could help Dr. James Hansen.
Dr. James Hansen, from NASA says, “Most impressive is the work of Citizens’ Climate Lobby… If you want to join the fight to save the planet, to save creation for your grandchildren, there is no more effective step you could take than becoming an active member of this group.”
A revenue neutral fossil fuel tax (that increases every year) and dividend law would create 2.1 million jobs in ten years - not hurt the economy.
To learn more about the tax carbon, pay people plan, (and hopefully join us) click here: https://citizensclimatelobby.org/carbon-fee-and-dividend/
-
michael sweet at 12:04 PM on 12 November 2015G R A P H E N E
Andrew:
The fastest trains in the world are electric. You just have to think differently. Many jobs currently done by trucks could be done using electric trains. Trucks could do the short haul. Just because it is not how we do it now does not mean that it cannot be done.
-
scaddenp at 11:49 AM on 12 November 2015G R A P H E N E
" FFs are the only realistic sorces of energy in those scenarios."
If you are only going to liquid fuels for planes and trains, then biofuels are an alternative. Lot of work going into woody feedstock. Just a little matter of pricing...
-
AndrewMF at 10:55 AM on 12 November 2015G R A P H E N E
"The Oil Industry will only flourish as long as constraints on use of EV’s remain in place. They are vehicle price (at present often double for EV’s), refueling time (over 40 hours from standard mains) and kilometres per charge (usually under 200 km."
Here in Australia, there are a few EV's at attainable prices: The Leaf and the BMW i3 for example. Both of those vehicles charge to full in a few (6-8) hours from standard 240v 10A power points, so easily overnight. Not sure where you found 40 hours? With a 32A EVSE, the i3 charges in under 4 hours, and with the DC charge option it charges to 80% in 20 minutes. (well, once DC chargers become common)
Less than 200km range is the current norm, and it does cause range anxiety until you actually use an EV. Most commuters travel way less than 100km in a day, so having less than 200km is hardly a big issue for most. The owner involvement in refuelling the EV is a minute at home (just plug it in) Compare that to your FF vehicle. If your trip is 50-60km, why would you need to lug around a large vehicle with a 450km battery like the Tesla?
I'm sure that as battery tech improves we will see greater range on these EV's. Nissan is apparently about to release an extended range Leaf to solve the range anxiety issue.
-
chriskoz at 10:21 AM on 12 November 2015G R A P H E N E
Ken in Oz@8
I would not be so optimistic about all electric transport including trucks & planes.
For starters, the energy density of 10kF supercapacitor weighing as muchs a "paperback book" (let's give it a mass of half pounr or 250g) and maximum voltage say 3V (most supercapacitor support even max breakdown voltage of 2.7V and this one seems no exception, Riduna please confirm), the energy yield is:
1/2 * 10kF * (3V)2
which is 45kJ per 250g or 0.18MJ/kg (I think I've overestimated it but Riduna might provide that detail, missing in the original OP)
which is still behind the existing battery technologies (e.g. Li-Ion up to 0.875MJ/kg) and far behind the miraculous energy density of burning petrol (44.4MJ/kg) or gas or other liquid FF.
https://en.wikipedia.org/wiki/Energy_density
So while graphene may be an important step forward in energy storage technology (I'm especially excited about the prospect of superfast recharge of say 15mins in an average EV), it is not a universal solution to all transportation at this stage. You cannot load 100 tons of charged graphene on board of a jumbo jet and expect it to fly a few Mm between continents or fill in a 100t truck or 1000t train and expect it to roll for 1 Mm accross the desert. There is simply not enough energy for that. FFs are the only realistic sorces of energy in those scenarios.
-
Riduna at 09:16 AM on 12 November 2015G R A P H E N E
chriskoz – I don't know. The literature does not show how graphene mass is calculated. It may be as you suggest that mass can only be calculated for a 3D material, or it may be due to each hexagonal containing only 2 atoms. I have e-mailed Manachester University seeking clarification.
-
katesisco at 00:10 AM on 12 November 2015G R A P H E N E
http://www.nano.northwestern.edu/research/carbon-nanotubes-and-graphene
Perhaps I am mistaken but if carbon nanos are graphene, then how is the toxicity to human cells going to be overcome?
Moderator Response:[PS] fixed link, but carbon nanotubes are not graphene. A link concerning potential toxicity from applications as discussed would be more useful.
-
Ken in Oz at 21:06 PM on 11 November 2015G R A P H E N E
When coated with Lithium it becomes a superconductor, having no resistance to an electric current at room temperature.
As Ed pointed out - 5.9K - a wee bit cooler than most rooms. Still, it's good to know there is innovation in the pipeline with the potential to make electric ships, trucks and planes as well as cars, solar homes and businesses not merely possible but the superior option. Not all innovation makes it to commercialisation let alone ubiquitous utilisation but there is no sign that the well is drying out.
-
Tom Curtis at 19:28 PM on 11 November 2015Climate's changed before
JH inline @506, NN1953VAN-CA previously linked to the data Alley et al (2000), ie, GISP2, and Petit et al (1999), ie, Vostok, as the data justifying the claim. However, he clearly misrepresents it. Specifically, he claims temperature variations of 3 degrees for Vostok, GISP2 and global temperature series within the last 300-400 years. Vostok shows a maximum 0.36 and minimum -1.84 variation from the most recent value after 1600 AD, giving a maximum variation over that period of 2.2 C. GISP2 shows a maximum variation from the most recent value of 0 C and a minimum -0.4985 C over the same period, giving a maximum temperature variation of 0.5 C. The average** of the two shows a maximum 0 C and minimum -1.1412 C, giving a maximum variation of 1.14 C.
Of course, had he said 500 years, he would have shown a 3.17 C decline in temperature between 1553 and 1716 (163 years) for Vostok, but still not for GISP2 or the average value.
That is, of course, irrelevant as you know. Both GISP2 and Vostok are regional temperature indices, and regional temperature fluctuations are expected to be much larger than global temperature fluctuations. That is particularly true at the poles, where we expect higher value fluctuations than at the equator. If we expand the number of proxies to just eight, any notion of large scale global temperature fluctuations over a short the centenial scale in the holocene is clearly unwarranted:

Note, the eight temperature series include both Vostok and Gisp2. As this is very well known, the question for NN1953VAN-CA is, why are they excluding data to make plausible a clearly falsified claim?
** Average taken by infilling a value for all dates by persistence within each data series, then taking the mean at each date.
Moderator Response:[JH] Thank you for the clarification.
-
NN1953VAN-CA at 14:08 PM on 11 November 2015Climate's changed before
responding to moderator,
In my comment NN1953VAN-CA @504 I was not being dismissive and I do understand nature around me.
There is no politics in my comment, unless … mentioning that CO2 is taxable??
I was trying to point out proportions in atmosphere content and emphasize proportional influence.
Somehow present content of CO2 concentration in the atmosphere does not produce mathematical models calculated temperature raise. That is point and lacks reasonable explanation.
IPCC prediction quote:
The average predicted temperature increase over the next 100 years is around 3 degrees centigrade
Looking at previous measurements – Antarctic or Greenland Ice core – Global temperature, recently (300 – 400 years ago) varied within 3 degrees in span of 200 years without significant CO2 change.Moderator Response:[JH] Please document the sources for the assertions that you have made.
[PS] Yes, your comment on tax was a completely political insertion. And your last sentence would certainly be dismissive hand-waving to me. Furthermore, your comments so far contradict your assertion "I do understand nature around me." For instance the comment "Looking at previous measurements – Antarctic or Greenland Ice core – Global temperature, recently (300 – 400 years ago) varied within 3 degrees in span of 200 years without significant CO2 change." only makes any sense if you somehow believed that science asserts that only CO2 can change the global temperature. It does not (eg see here) as both the above article and the pointers I provided indicate. Furthermore you continue to conflate local temperatures with global. A better way to assess climate sensitivity from glacial cycle (using all forcings), is discussed here (note Fig3)
-
villabolo at 13:05 PM on 11 November 2015G R A P H E N E
And what will the Koch brothers do to stop this technology?
-
chriskoz at 12:57 PM on 11 November 2015G R A P H E N E
Typo in my previous post: of course Avogardo constant is 6.022E23 atoms per mole
-
chriskoz at 12:53 PM on 11 November 2015G R A P H E N E
...one atom (0.35 nm) thick. 1 gram of graphene is sufficient to cover an area of 2,630 square metres and one square metre weighs 0.77 milligrams
2,630 m2/g seems ~right based on the calculation I've done using Avogardo constant (2.022E23 atoms per mole, i.e. 12g in case of C)
But 0.77 mg per m2 looks like a mistake. 1000mg over 2,630 m2 reduces to 0.38mg over 1 m2. Unless "1 m2" cannot exist in a single layer but for a strange reason, two layers are needed.
-
Tom Curtis at 11:44 AM on 11 November 2015Water vapor is the most powerful greenhouse gas
The misnamed "old sage" (@ 222) asserts that raindrops are "... the only generator of radiation of any significance in the atmosphere". That is, he claims the vast majority of radiation in the atmosphere comes, not from water vapour, but from water in a liquid (or, presumably, frozen) state. He provides no source or data for the claim. It is, however, a claim shown easily to be false by clear sky surface, downward IR spectrums such as this one from Wisconsin:
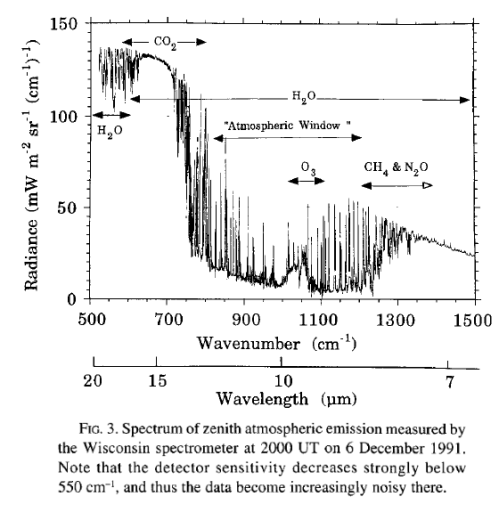
Note that the H2O lines shown are for water vapour, not liquid water which has a different spectral signature, being effectively a black body in the IR spectrum.
The relative contribution of liquid water to atmospheric radiation can be checked by comparing the cloudy and clear sky radiation using a radiation model. Using modtran, with tropical atmosphere, 0 km altitude looking up, but otherwise default settings, the back radiation is 347.91 W/m^2 in the clear sky state, and 418.25 W/m^2 with a low cumulus cloud cover. That is, the low cloud cover increases the backradiation by 70.34 W/m^2 or by 20.2%; but that liquid water contributes >50% of the total radiation where it is present.
It contributes greater than 50% because the other radiation is still emitted, but then absorbed by liquid water drops. Indeed, where present, if we consider all the radiation emitted by liquid water drops and then absorbed by other drops before escaping the cloud layer, the total emission by liquid water, where present is >> 50%, but how much greater would be very difficult to determine (and beyond the capabilities of public access radiation models). It may be this fact that "old sage" is relying on in his claim. If so, it still does not justify the claim as it only applies where the liquid water (ie, clouds) is present.
A full examination of the issue using global cloud cover and allowing for all emissions may justify the claim that liquid water in the atmosphere is responsible for the vast majority of all emissions in the atmosphere - or not. That however, is irrelevant to "old sages" specific claim, however, which was that it was "the only generator of radiation of any significance". As seen above, under some circumstances adding the cloud layer only increases backradiation by 20%, so that emission from liquid water in those circumstances is of significantly less (approx a quarter of) significance than emission by gases (including WV), because it only makes about a 25% difference to the total backradiation.
Even that, however, is overly generous to "old sage". An increase in backradiation makes no net difference to the surface energy balance because it will be balanced by increased evaporation, or increased convection (as we have all seen in the formation of cumulo-nimbus clouds). In contrast, a TOA energy balance is, in the end, only eliminated by a change in surface temperature. Therefore it is the TOA energy balance which determines the effect on GMST of changes in radiative components of the atmosphere. And there we are fairly confident about the relative effects. Specifically, CO2 contributes about 20% of the total greenhouse effect, clouds (liquid and frozen water in the atmosphere) about 25% and WV about 50%.
So, in the end, what "old sage" says may be true if "significance" is interpreted purely in terms of quantity of emission (although he has not shown it). If that is how he intended it, however, it is doubly misleading. Misleading because, by focussing on emission only and ignoring absorption, he grossly overstates the relative impact on daily weather (backradiation); and misleading because by focusing on backradiation he completely ignores the primary factor effecting global climate change.
-
Tom Curtis at 10:49 AM on 11 November 2015By rejecting Keystone, President Obama cements his climate legacy
ryland @4, another way of saying there is an increase in transport complexity is to say that the cost of the tar sands oil, delivered to market, will be greater. And if the cost is greater, sales will be less. From that it follows that, on your own assumptions, less tar sands per unit time will be consumed, because of the pipeline ban. As other, renewable energy sources become cheaper and more available, that in turn means that less tar sand oils will be consumed overall. So, from your own assumptions, it is clear that your first claim is mistaken.
Apart from that consideration, in moral issues (and the bringing of new sources of CO2 emissions to market is definitely a moral issue in todays world), that the immoral act will be done anyway by some other never excuses doing it yourself. The appeal that the tar sands oil will be transported by some other means is just the naked claim that moral considerations should be excluded from economic considerations. It do not subscribe to that sociopathy.
Prev 524 525 526 527 528 529 530 531 532 533 534 535 536 537 538 539 Next


