


 Arguments


Recent Comments
Prev 527 528 529 530 531 532 533 534 535 536 537 538 539 540 541 542 Next
Comments 26701 to 26750:
-
FrankShann at 15:27 PM on 20 February 2016Republicans' favorite climate chart has some serious problems
Thank you for an informative post. However, it does not seem very convincing to use CMIP5 (that appears to have been published in 2014) to support the claim that "climate models have done an excellent job *predicting* how much temperatures at the Earth’s surface would warm". CMIP5 may provide excellent *retrospective* modelling, but that is not prediction - or am I missing something? [Note also that Mann (2015) was formally published on 25 Jan 2016.]
-
Increasing CO2 has little to no effect
Fred Steffan - See this video for just such an experiment. The candle disappears as intervening CO2 increases.
-
Tom Curtis at 13:01 PM on 20 February 2016Increasing CO2 has little to no effect
fred.steffen @200, my assumption is that the IR camera was tuned to a specific wavelength (probably 15 micro-meters). That being the case, the experiment would indeed show the same thing.
"3 and 4 micron are centered around 451c and 693c respectively and the earth's black body curve doesn't hit that much."
Here is an observed IR spectrum with black body curves for various temperatures overlaid:
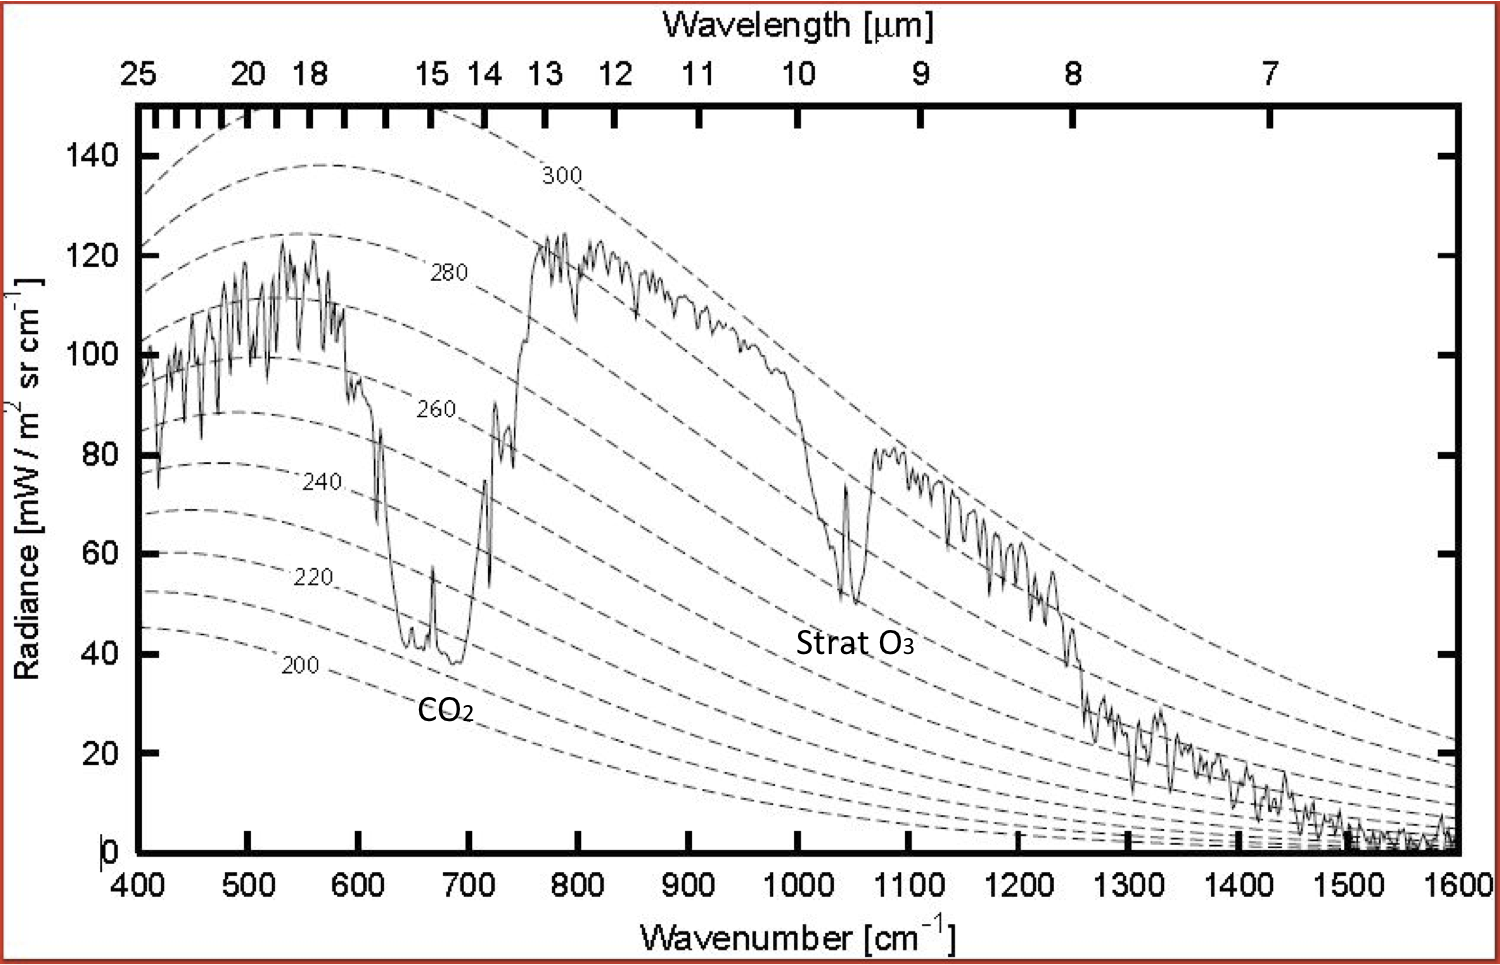
As you can see, the back bodies radiate even at 6 micro-meters, even at 200 K. Indeed, using a radiance calculator, we can determine that even at 2.5 micro-meters, a black body at 200 K still radiates 0.00039 mW/m^2 sr per micro-meter. At 240 K, that rises to 0.047 mW/m^2 sr per micro-meter. At 288 K, to 0.26 mW/m^2 sr per micro-meter. At 288 K, that rises to 2.9 mW/m^2 sr per micro-meter at 3 micro-meters, and to 43.8 mW/m^2 sr per micro-meter. You will note the different unit to that used on the chart. In any event, it is fair to say the Earth's black body radiation is inconsequential at those wavelengths, but not that it does not exist.
Further, CO2 absorbs at more than just those wavelengths. Specifically, the small notch in the observed chart at 12.5 and at 11.5 micro-meters are both due to CO2. What is true is that only at those wave-lengths (and a significant band on either side of them) is the optical depth of the atmosphere due to CO2 greater than 1 (ie, all IR radiation of that wavelength from the surface is absorbed before it reaches space, but not all that is emitted in the atmosphere).
"Earth's blackbody curve is around 10 microns"
Using Wien's Displacement Law, the peak radiation for 255 K (Earth's effective radiative temperaure), peak intensity is at 11.36 micro-meters, while for the 288 K (approximate Global Mean Surface Temperature) it is 10.06 micro-meters. However, the term "around" us excessively vague in this context. At 288 K, the IR radiation at all wavelengths lower than 10.06 micrometers is stronger than the equivalent radiation for any lower temperature, even if their radiation is "around" that particular wavelength; and as can be seen on the chart above, the Earth's black body radiation is still significant out to 6 to 7 micrometers.
"Toward the tail is where CO2's absorption kicks in"
That is entirely an artifact of the units used on the x-axis. If a unit of frequency is used (as above), the 15 micro-meter absorption band is located near the point of peak emission. The difference in unit also makes a difference of the location of the peak (which is a measure of intensity per unit on the x axis). Using wavelength, it is shifted further to the left, and spread out because of the large number of wavelengths covered. The crucial point is the area of the 'absorption band', which is the same regardless of units on the x-axis. Averaged across the Earth, and across all weather conditions, that represents about 20% of all absorption (25% exlcluding the H2O overlaps).
"But once a CO2 molecule absorbs a 15 micron photon, wouldn't it either re-emit at the bbr curve of it's temperature, far more likely to be centered around 10 micron, or shed the extra energy as heat transfered to another molecule?"
Once a CO2 molecule absorbs a 15 micro-meter photon it is far more likely to distribute the energy to the rest of the atmosphere by collissions than to re-emit it, but once it absorbs energy by collisions it is just as likely to emit it as a 15 micro-meter photon as if it has originally absorbed the energy as a photon. If the temperature of the gas is the same as that of the incoming radiation, the net effect will be that CO2 will emit just as much radiation as it absorbs. If the CO2 is warmer than that radiation, it will emit more than it absorbs; but if it is cooler it will emit less than it absorbs. Crucially, the atmosphere gets colder as you get higher, so CO2 is a net absorber of IR radiation in the atmosphere. That is how the greenhouse effect works.
(As an aside, I have often seen it argued that because CO2 will dissipate energy gained by radiation through collisions, there can be no greenhouse effect. It is a bizarre argument. If it did not dissipate the energy, it would of necessity emit as much as it absorbs thereby preventing any greenhoue effect. Ignorance is used to turn a cause of the greenhouse effect into a pseudo-argument against it.)
"Eventually heat is emitted as radiation, but wouldnt' the odds be against that energy being re-emitted at 15 microns?"
Again, look at the observed spectrum above. There is no absorption band at 10 micro-meters, which means no molecule in the atmosphere absorbs at 10 micrometers. Ergo no molecule emits at 10 micrometers. In fact, in the troposphere, except for clouds (that do absorb and emit at all frequencies), all IR emission is done by CO2, H2O, CH4, NO2, O3 or one of the other minor greenhouse gases. Because or the strength and relative abundance, almost all of that remission is by H2O or CO2.
"Also, wouldn't each molecule (at 0.04%) essentially have to absorb 2,500c of energy and transmit that heat to other molecules in the atmosphere to increase the atmosphere's temperature 1c?"
No because - energy increases with the fourth power of temperature - because CO2 is not the only GHG - and most importantly, because IR radiation represents only 69% of energy flow into the atmoshpere:

"Also, considering water vapor overlap, even at 10% humidity at 70f, there's a lot more water vapor than CO2 in the atmosphere. Wouldn't that skew the numbers for the 15 micron range?"
This is the crux of the issue, and related to the most common misunderstanding about the greenhouse effect. The greenhouse effect is first, and foremost, a theory about preserving conservation of energy for radiation between the Earth and space. Therefore it is the radiation from the level where the energy actually reaches space that is crucial to the strength of the greenhouse effect. The back radiation (the "thermal down surface" in the above diagram) is often taken to be the greenhouse effect, but it is in fact a secondary consequence. If it was stronger or weaker, there would merely be a shift in the rate of convection counterbalancing that effect until the actual radiation to space was equalized.
Now, the crucial thing about H2O is that if it gets cold, it precipitates out of the atmosphere. As a result, at the altitude at which CO2 radiates to space there is almost no H2O. Consequently the entirety of the notch around 15 micrometers in the first graph in this post is due to CO2, even though almost the entirety of the back radiation (except at the poles and in deserts) is due to H2O. The overlap is significant relative the situation with no CO2 because in that case H2O would preserve 20% of the greenhouse effect of CO2 in its absence (along with its own effect from the areas with no overlap). Taking that into account, it has been determined that 20% of the total greenhouse effect is due to CO2 determined on a counterfactual basis. If it was determined on a basis of molecule of last emission, that would rise up towards 25%.
Finally, even with only 20% of the effect, if you removed CO2, things would get a lot colder. Somewhere on the order of 9 K colder globally averaged with no feedbacks. Because water precipitates out when it gets cold, that would reduce the H2O greenhouse effect, making it colder again. Once the cycle repeats through to its assmptote, the net effect is that close to 100% of the greenhouse effect would be eliminated.
-
Glenn Tamblyn at 12:15 PM on 20 February 2016Increasing CO2 has little to no effect
fred.steffen
Here is the actual infra-red spectrum for a point on the earth. Taken by the Nimbus 3 satellite in 1969. The top curve is what the satellite observed, the bottom was calculated from radiation transfer theory. The top curve has been shifted up for clarity. In fact they match almost perfectly. The graph shown by Tom Curtis at comment 163 shows the left hand half of this curve without the offset, and also the Planck curves associated with different temperatures. You could also look at the full curve from theory shown by Tom at comment 154.
The peak of the curve is at a wavenumber of around 600 cm-1. That's a wavelength of around 17 microns. And as you can see from the graph below, emissions have dropped away to virtually nothing at 3 and 4 micron's so CO2's absorption peaks there have virtually no effect.
So sorry, firstly, Tim Ball is just flat out wrong.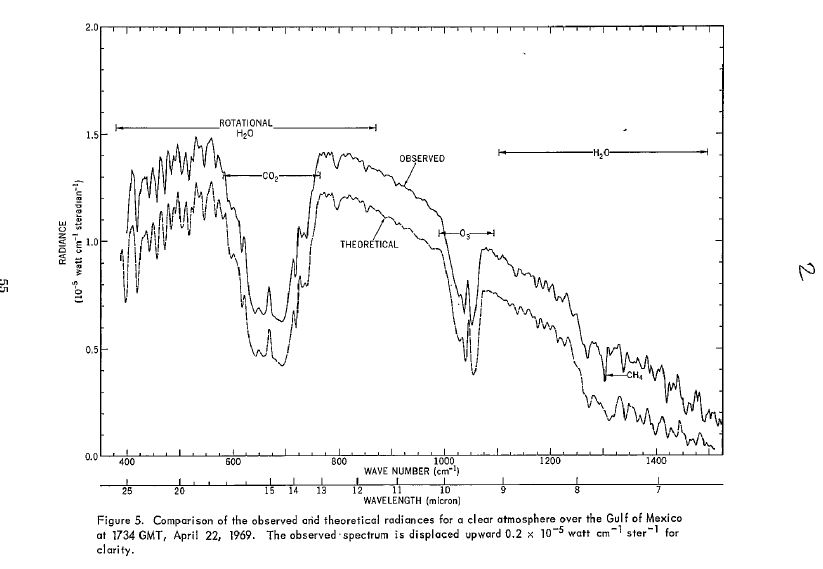
Next, the large notch at around the 15 micron point, due to CO2, is close to the peak of the emission curve, so CO2 is active in some of the most important part of the spectrum.
Water vapour across most of the spectrum we are interested in here is a weaker absorber proportionally than CO2, except at the far right. However, as you point out, H2O is far more abundant in the lower atmosphere and this makes up for that so that H2O is a significant absorber across the spectrum at low altitudes. Importantly however, H2O concentrations drop sharply as one goes to higher altitudes because it condenses. By the time one reaches the stratosphere water vapour is almost non-existant - 0.0001% or less. So this reduces the contribution possible from water hugely.If water didn't condense, and water vapour was several % of the atmosphere right up into the stratosphere then most of the regions on this graph showing H2O absorption would be down at the same levels as the bottom of the CO2 notch. Much less energy would be able to get out to space, the GH effect would be very much hotter, and the Earth would be an inferno.
So the common figures estimated for the relative contributions of different things to the GH effect are around :
H2O - 50%
Clouds - 25%
CO2 - 20%
Other gases - 5%
Also, look at the graph I have posted at comment 191. That is the raw data for how absorbent CO2 is across the wavelengths we are interested in. Spectral Intensity is the raw number that is the starting point for calculating absorptivity, but the relative strengths at different wavelengths are still a strong indicator of the relative absorptivity of CO2 at different wavelengths. Not that the vertical scale is logarithmic so 6 orders of magnitude variation.
However at sea level pressures and temperatures, due to the speed molecules are moving at and the frequency of collisions, this spectrum gets smeared out and CO2 absorbs quite well over most of the range indicated by the notch in my diagram here. It doesn't just absorb at 15 microns.
As for what happens when a molecule absorbs a photon. It takes many, many milliseconds before the molecule can re-emit a photon. However that molecule will undergoes billions of collisions a second with other molecules. So mostly the absorbed energy is transferred to surrounding molecules in the air rather than re-radiated. It is 'thermalised'.
So how does any re-radiation occur? Absorbing a photon isn't the only way a GH molecule can become more energised. Through the continuous collisions between molecules a proportion of all the GH molecules are in a higher energy state naturally. The vast majority of high energy GH molecules are energised because of collisions, not by absorbing a photon. And from this very, very much larger pool of energised GH molecules a small percentage do manage to de-energise by emitting a photon.
So there is no coupling between the wavelength of a photon absorbed, and the wavelength of a photon emitted. It isn't the same molecule involved. -
fred.steffen at 09:44 AM on 20 February 2016Increasing CO2 has little to no effect
@Tom Curtis
Very cool video... However, since CO2 absorption happens at 3, 4 and 15 microns (3 and 4 being centered around 451 and 693) doesn't it make sense that a very hot flame giving off heat around there would disappear in IR when CO2 is pumped in? Simply because it absorbs at temperatures much higher than our atmosphere normally is?
If they did that experiment in a freezer, and held up a human hand, would we see the same thing?
-
Tom Curtis at 09:35 AM on 20 February 2016Greenhouse Effect Basics: Warm Earth, Cold Atmosphere
cdbenny @119, that is a well phrased question. To answer, if there have been not feedbacks or temperature responses to the change (other than some rapid adjustements in the stratosphere) the reduction in energy leaving the troposphere by radiation for a change in CO2 concentration is 5.35 x ln(CO2/original CO2) +/-10%. The top of the troposphere is used for this calculation as it greatly increases the convenience of the calculation. LBL models, however, are validated against radiation to the specific height of the observing platform (most often satellites). For an increase from 280 to 400 ppmv, that amounts to 1.9 W/m^2 (or 3.06 x 10^22 Joules per annum for the whole surface of the Earth).
However, that is the change only prior to any temperature changes or feedback in the troposphere or at the surface. Conservation of energy will result in changes in the troposhere and at the surface that will reduce that temperature energy imbalance over time to zero. As temperature drives the feedbacks, that means there must be some increase in temperature, and there is very good reason to think the increase will be about 3 C per 3.7 W/m^2 energy imbalance (or 0.8 C per W/m^2) with a significant margin of error which is biased towards higher values.
-
fred.steffen at 09:35 AM on 20 February 2016Increasing CO2 has little to no effect
Hi... This is my understanding of how CO2 in our atmosphere works. Was hoping y'all could tell me where I'm off.
CO2 makes up about 0.04% of our atmosphere. It absorbs infrared in the 3, 4 and 15 micron ranges. 3 and 4 micron are centered around 451c and 693c respectively and the earth's black body curve doesn't hit that much. The 15 micron blackbody curve centers around -79c (from what I understand).
Earth's blackbody curve is around 10 microns (http://drtimball.com/2011/the-greenhouse-effect-everybody-talks-about-it-but-few-know-what-it-is/). Toward the tail is where CO2's absorption kicks in, overlapped by water vapor.
So, there's some absorption by CO2 for the amount of blackbody radiation molecules give off in that range (since bbr is a curve).
But once a CO2 molecule absorbs a 15 micron photon, wouldn't it either re-emit at the bbr curve of it's temperature, far more likely to be centered around 10 micron, or shed the extra energy as heat transfered to another molecule? Eventually heat is emitted as radiation, but wouldnt' the odds be against that energy being re-emitted at 15 microns?
Also, wouldn't each molecule (at 0.04%) essentially have to absorb 2,500c of energy and transmit that heat to other molecules in the atmosphere to increase the atmosphere's temperature 1c?
Also, considering water vapor overlap, even at 10% humidity at 70f, there's a lot more water vapor than CO2 in the atmosphere. Wouldn't that skew the numbers for the 15 micron range?
I don't have the math background to calculate this stuff, I'm really a noob, but I just don't understand how CO2 can contribute that much.
-
Tom Curtis at 09:18 AM on 20 February 2016Greenhouse Effect Basics: Warm Earth, Cold Atmosphere
MA Rodger @118, specifically regarding the question, "For 220 ppmv man-made CO2 in Earth atmosphere, how much real energy does that amount of CO2 absorb from the Sun, or from 15 micro-meter wavelength IR radiated back from the Earth?" it is difficult to answer. Even if we clarrify the ambiguity as to whether it is asked how much 500 ppmv (280 preindustrial plus 220 anthropogenic) would absorb, or how much extra is absorbed by 500 ppmv relative to 280 ppmv, it is difficult to answer. That is because Line By Line radiation models, which would be used to answer that question, are designed to show the net upward and downward radiation at each level. They do not typically integrate total absorption over the whole atmospheric column. Instead, at each level they calculate the amount absorbed from the net upward (or downward) radiation from the next lowest level, and the amount emitted upward (and downward) from that level.
Further, they do not calculate the amount both emitted and absorbed within the same level, which constitutes a substantial fraction of the radiation, particularly at lower levels. Nor do they calculate the sidewards component of the emissions and absorptions (an even larger proportion of atmospheric absorption and emission) as they effectively cancel out. GCM's do calculate the sidewards component (but not the full spherical emissions and absorptions) but at a much coarser scale, thereby inflating the component of emissions and absorptions wihtin the same cell.
There are very good reasons for these limitations on LBL radiation models. The components that they do not calculate result in no net transfer of energy, and cannot be directly observed. In contrast, the components they do calculate do result in a net transfer of energy, and can be observed. As a result, they have been shown to be very accurate.
If we ask about the net transfer, we can answer the questions with LBL models (or more approximately with the University of Chicago's online Modtran model). Using the later, if we 0 all ghg components except CO2, and use the 1976 US Standard Atmosphere with no cloud, looking down from 70 Km we find total emissions of 358.274 W/m^2 with zero CO2, 325.618 W/m^2 with 280 ppmv, and 322.478 W/m^2 with 500 ppmv. That shows that the 280 ppmv absorbs approximately 33 W/m^2 more than it emits, vertically integrated in the upward direction. Increasing that to 500 ppmv results in both an increase in absorption and emission, but vertically integrated in the upward direction it absorbs approximately an additional 3.14 W/m^2 more than its increase in emissions.
Because of the vertical temperature profile of the atmosphere, while absorption dominates the net upward radiative energy flow, emission dominates the net downward energy flow. So, looking up from 0 Km, net emissions with no CO2 is 23.66 W/m^2, with 280 ppmv it is 82.205W/m^2 and with 500ppmv it is 87.606 W/m^2. Hence net downard emissions exceed net absorption of downward IR radiation by approximately 60 W/m^2 for 280 ppmv, and by an additional 5 W/m^2 for 500 ppmv.
Adding back the other GHG into the atmosphere will not change the total emission by CO2 (which is temperature dependant). It will result in a decrease in the net absorption relative to emission by CO2 as some of the absorption will be by other components. In particular, there is significant overlap between H2O and CO2. Overall, there will be an increase in net absorption relative to emission in the upward direction due to those additional components, and an increase in net emission relative to absorption in the downward direction.
Finally, to respond to another possible interepretation of the original question - at 280 ppmv, between 14.327 and 15.625 micrometers, all emissions from the surface are absorbed by CO2 (or CO2 and H2O in the actual atmosphere) before it reaches space, with the radiation to space in that band coming entirely from higher levels of the atmosphere. Increasing the atmospheric concentration to 500 ppmv increases the band of total absorption of surface radiation to 14.245 to 15.773 micrometers. The same bands will stop 100% of solar radiation in those wavelengths from reaching the surface.
-
cdbenny at 09:17 AM on 20 February 2016Greenhouse Effect Basics: Warm Earth, Cold Atmosphere
Increase of 200-220 ppmv CO2 in earth atm since industrial rev is incorrect. SkS "CO2 History" chart shows increase from abt 280 to 400ppmv. Question in #114: How much energy, Joules/year, is 120 ppmv man-made CO2 responsible for adding to earth atm/environment; can that be determined from IR radiation 'not exiting atm'?
-
One Planet Only Forever at 05:04 AM on 20 February 2016Republicans' favorite climate chart has some serious problems
This is a great presentation explaining how a 'supposed expert witness' has failed to most accurately and fully present what they are almost certain to be aware of. It does however explain why particular politically people would like such presentations.
It is more difficult to raise public awareness about, and build public support for, understanding the unacceptability of a person who would choose to mislead. It is especially difficult to 'reach' a person and help them better understand what is going on when that person is willing to be misled, because they sense that better understanding the issue would be contrary to their personal interests.
That type of common sense, sensing when to deliberately not pursue a better understanding, is a serious problem for the future of humanity. And the science of deliberately misleading marketing has developed significant understanding of how to exploit the many reasons people would be inclined to not 'better understand things in pursuit of the development of a lasting better future for all'.
-
Tom Dayton at 03:15 AM on 20 February 2016Republicans' favorite climate chart has some serious problems
Thanks Dana! Not mentioned is what I think is the biggest misrepresentation: Christy's four balloon indices are questionable, given that RATPAC-A seems to be the only gridded, global balloon dataset that is up to date.
-
michael sweet at 03:14 AM on 20 February 2016Tracking the 2°C Limit - January 2016
Franco72:
I think you are comapring different results. The NOAA site lists January as 1.04C higher than the average of 1900-1999. The NASA site lists January as 1.13 C higher than 1951-1980. The NOAA baseline is higher than the NASA baseline so the results are different. This does not indicate any problems with the data or indicate any cooling. NOAA has December as the hottest month by a small amount while NASA has January as hottest by a small amount. NASA includes more of the Arctic which may be why it is hotter than NOAA for this month.
El Nino causes an increase af 0.1-0.2C temperature. As the year progresses we expect the temperature to retreat from the current record high temperatures by a little as El Nino fades. This does not indicate any cooling of the globe it is just the normal pattern of El Nino.
-
Rob Honeycutt at 00:06 AM on 20 February 2016Tracking the 2°C Limit - January 2016
Franco... I'm sorry but I think Google Translate has turned your Italian into indecipherable English.
-
franco72 at 21:57 PM on 19 February 2016Tracking the 2°C Limit - January 2016
The data which, alas, I was told they were spurious, have been received the official NOAA and actually January globally showed a positive anomaly of not exceed the aforementioned value of +1.13 ° C but equal "only" to +1.04 ° C. Always a very high value, but not a record value so that it remains the prerogative of December. Hopefully it's started a slow descent linked to the mitigation of Nino, by 2016 I would love to see the heating resized below the degree Celsius.
http://www.ilforumditutti.net/t3919p40-monitoraggio-costante-global-warming#35468
-
MA Rodger at 21:34 PM on 19 February 2016Greenhouse Effect Basics: Warm Earth, Cold Atmosphere
Tom Curtis @117.
I think in treating cdbenny's question @114 literally, you are ignoring the assessment you made of the abilities of the questioner. His question as stated on first arrival @SkS was perhaps written with a little more care and is quite different. "For 220 ppmv man-made CO2 in Earth atmosphere, how much real energy does that amount of CO2 absorb from the Sun, or from 15 micro-meter wavelength IR radiated back from the Earth?" So this presumably concerns a level of CO2 elevated above the natural or pre-industrial level. I cannot think why the 220ppm value is chosen. Perhaps cdbenny could redeem himself by explaining. There is also the question of whether "amount absorbed" is literally that, or whether it is the 'amount absorbed and re-radiated back whence it came.'
-
Tom Curtis at 14:36 PM on 19 February 2016Greenhouse Effect Basics: Warm Earth, Cold Atmosphere
Glenn @115, that does not answer cdbenny's question, which was about a concentration of 200 ppmv of CO2, not an increase in concentration of 200 ppmv (which we have not experience yet in any event). But, yes, an ongoing increase, currently at 120 ppmv, is currently resulting in a 1.5*10^22 Joules per annum increase in surface energy, which is currently increasing because we are further increasing the CO2 concentration faster than the rate at which the surface temperature approaches the equilibrium value for the current concentration (at which point net energy flux would be zero).
-
Tom Curtis at 14:30 PM on 19 February 2016Greenhouse Effect Basics: Warm Earth, Cold Atmosphere
cdbenny @114, the question is nonsensical. If you change the CO2 concentration there will be a change in the energy flux to space. If the change is a decrease from 280 ppmv to 200 ppmv, it will result in a greater flow of energy to space; while if it is a change from 100 to 200 ppmv, it will result in a reduced flow of energy to space. In either case, the change in flow will gradually return to a value equal to and opposite in sign to the flow of energy from the Sun to Earth, at which time there will be equilibrium (averaged over a short period of years) and no net change in the quantity of energy at the Earth's surface.
Looking at your question, you ask for a rate (joules per year). So you are after a value where you need to specify an initial concentration and have not. Your question is therefore a version of "how long is a piece of string?" or "how deep is a hole?" or other such nonsense questions that only appear in jokes. But worse, even if you have an initial value, you are after a fixed value for a flux that changes over time, and where the change from the initial state tends to zero over time.
Further, you did not just ask a question. You repeatedly made nonsense claims about the greenhouse effect, and about the atmospheric absorption of CO2 which, among other confusions, revealed a deep misunderstanding of Wien's Law. Pointing out that these nonsense claims of yours are nonsense is not an insult. Only if I had no respect for intelligence would I be indifferent to the premises you use in argument - considering all equally valid. Your premises were sheer nonsense. Now, you can learn different and proceed accordingly (showing thereby intelligence and integrity); or not. In the later case, it is your response that condemns you - not my correctly pointing out that your premises were nonsense.
-
Glenn Tamblyn at 14:28 PM on 19 February 2016Greenhouse Effect Basics: Warm Earth, Cold Atmosphere
cdbenny
See here. Select panel 2 in the slide show.
That is heat accumulation in the top 2000 meters of the ocean. The largest build up of heat in the system, around 93%
By eyeball that is about 1.5 * 10^22 joules last year. That is due to the sum off the factors changing the climate of which CO2 is the biggest contributor.
To put that number into context, it is a rate of over 450 trillion watts. In contrast total human energy consumption is at around 18 trillion watts and total geothermal heat flows from within the Earth are at around 47 trillion watts. -
cdbenny at 13:55 PM on 19 February 2016Greenhouse Effect Basics: Warm Earth, Cold Atmosphere
So, you suppose personal insults are appropriate?(..sheer nonsense, ..abysmal ignorance). I am just looking for answer to question: "How much energy, Joules/year, is 200ppmv CO2 responsible for adding to earth environment/atmosphere?"
Moderator Response:[JH] Argumentative remarks are not acceptable on this website. Please keep it civil.
-
Trevor_S at 08:04 AM on 19 February 2016Tracking the 2°C Limit - January 2016
>We need to give ourselves a lot of room to slow down if we want to stay below 2°C.
Indeed. A great recent lecture here at the LSE by Professor Kevin Anderson on the 'slowing down problem' ie using up all the emisisons budget.
www.youtube.com/watch?v=-T22A7mvJoc&index=26&list=PLYrPyJ3sC_t8ycZyn843Kl57YazOISnWh
On a side note, at about 1:06, from, memory he talks about the importance of personal emisions responsibility, refuting the 'my emisisons don't matter' meme I see high emitters use, he's especially damming of climate scientists :)
-
Rob Honeycutt at 06:19 AM on 19 February 2016Tracking the 2°C Limit - January 2016
dagold... The 12mo average is probably a better number (1.13°C). And even that will probably fall back down close to 1°C over the coming few years. I'd say, rough guess, not counting heat in the pipeline, we're about half way to 2°C.
Problem is, like driving a large heavy vehicle at highway speeds, you have a lot of momentum and just can't stop on a dime. We need to give ourselves a lot of room to slow down if we want to stay below 2°C.
-
dagold at 04:35 AM on 19 February 2016Tracking the 2°C Limit - January 2016
Rob - thanks so much for this. I've been hunting for a couple days now, trying to determine the anamoly of this January's temp. compared to the "pre-industrial" baseline for an article I may write for Huffington.(It's a bit frustrating with all the different baselines that the different organizations use). So, to be clear, it is 1.38 C, correct? I am coming from the angle that Paris issued the "intention" to keep warming at or below 1.5C and, though it is only a single month, and probably an El Nino fueled "precursor", it nonetheless takes us quite close to that boundary.
-
Tom Curtis at 03:48 AM on 19 February 2016A Rough Guide to the Jet Stream: what it is, how it works and how it is responding to enhanced Arctic warming
Nylo @84, polar amplification means there is already a large AGW based reduction in the equator to pole gradient. Relative to a 1951-1980 baseline, the winter temperaure differential has already reduced by 1.8 C. That is, we have already seen a reduction in the temperature gradient approximatly 10% of the seasonal difference. Based on RCP 8.5, by the end of the century that could rise to 25% of the seasonal difference. And yes, the seasonal difference is very significant, as is shown by the far greater variability in NH temperate zone winter temperatures than summer temperatures.
-
Nylo at 02:18 AM on 19 February 2016A Rough Guide to the Jet Stream: what it is, how it works and how it is responding to enhanced Arctic warming
As the article says, the claim that the jet stream is stronger when the temperature gradient between North Pole and Ecuator is greater, is supported by the observational fact that it is typically stronger in winter than in summer. My question is: how much stronger?
In winter, the temperature gradient is of more than 50ºC (North Pole typically less than -30ºC, Ecuator over +20ºC). In summer, the temperature gradient is less than 30ºC (North Pole slightly over 0ºC, Ecuator still the same). The temperature gradient between Ecuator and Nort Pole has reduced to about HALF of what it was in winter, and in absolute terms, it has reduced by aproximately 25K. Does the jet stream change A LOT in response to this, or does it only change a little bit?
My main problem with this theory of our dangerous influence on the jet stream, is that it is true that we are reducing the gradient between North Pole and Ecuator, but we are talking about a reduction of what, half a degree? One degree? (it depends on which dataset you go to check) of this gradient, for the last 20 years. If this had the possibility of affecting the Jet Stream big time in any sense, then we should see HUGE differences in jet stream behaviour between winter and summer, every year. Is the difference in its behaviour, indeed, huge? We are talking of a seasonal variation of the temperature gradient that is roughly between 1 and 2 orders of magnitude bigger than the anthropogenic effect. In the months when the arctic is warming up, this gradient is reducing at a rate of one full centigrate degree every week!
So to get an idea of what we can expect, I would like to see a typical picture of the jet stream in winter, together with a typical picture of the jet stream in summer, to see the differences, divide the difference in its behaviour by 20 or 30, and then understand what kind of variation we are introducing with the anthropogenic warming of the arctic, quantitatively. Can anybody provide such pictures of the jet stream in summer/winter?
-
Rob Honeycutt at 00:31 AM on 19 February 2016Tracking the 2°C Limit - January 2016
Here's the same chart with a 5mo lag. The peak seems right but before and after just don't seem to fit. The numbers jump around at the peak, so who's to say exactly where that peak actually is? The 6 month lag seems (to my eyechrometer) a better overall fit.
-
Rob Honeycutt at 23:23 PM on 18 February 2016Tracking the 2°C Limit - January 2016
Barry... Yup. I thought the same thing and tried it. It's not as good a fit. I've always heard the 6 month figure quoted, and I initially questioned it. But working with this graph has caused me to accept that as the correct figure.
-
Kriss at 21:59 PM on 18 February 2016Antarctica is gaining ice
Awesome blog. I enjoyed reading your articles. This is truly a great read for me. I have bookmarked it and I am looking forward to reading new articles. Keep up the good work!
-
Glenn Tamblyn at 20:49 PM on 18 February 2016It's the sun
RockfordFile
I just skimmed the first 20 or so papers. Most seemed to be straight science on details of climate. A focus on sun climate links at regional scales, high atlantic/arctic/greenland patterns, solar impacts on the stratosphere, projections of past and future solar activity etc. or simply exploring things like variability of the Indian Monsoon. Nothing challenging the basics of CO2's role, just exploring subordinate mechanisms.Except for 3 red flags:
- The Soon and Connelly's paper,
- One from Adelaide University :-( concluding "This heating then explains why the earth’s temperature record so closely tracks solar flare counts. Fundamentally then it is implied that the Earth’s climate is controlled by a non-conservation of energy process." - WTF!
- A withdrawn paper. Claiming that Surface Air Temperatures for rocky planets can be predicted from just Top of Atmosphere Insolation and surface air pressure.
So broadly, standard detailed, regional mechanism, climate research. Not extraordinary or paradigm changing. Just the obvious that not all the details of the science is settled. Which of course it isn't.
Again a giant version of the 'the science is settled' strawman argument.But too detailed to try and rebut in depth.
Moderator Response:Welcome to SkS.
If you are interested in discussing this further the 'the science isn't settled' thread is the appropriate location. Others will follow you there.
[GT] -
Tom Curtis at 17:16 PM on 18 February 2016Greenhouse Effect Basics: Warm Earth, Cold Atmosphere
cdbenny @110, here is a graph of radiation intensity of a 'black body' (in this case a bolt of ligtning):
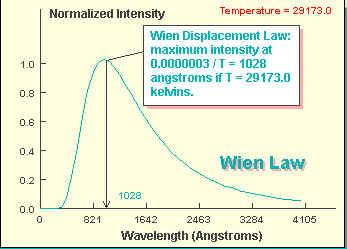
As the graph shows, Wien's Displacement Law determines the temperature of a black body from the wavelength of peak radiation, or the wavelength of peak radiation for the the black body radiation at a given temperature. It does not tell you the radiation intensity at that or any other point on the curve. That is determined by Planck's Law. Nor does it tell you the total radiation emitted (ie, the area under the curve). That is determined by the Stefan-Boltzmann Law.
Gases are not black bodies. They do not radiate at every wavelength. Rather, they radiate at specific wavelengths determined by the nature of their chemical bonds (at medium and long wavelengths) and the atomic structure of their components (at short wavelengths). They absorb radiant energy only at the wavelengths at which they would radiate if hot enough. The result is a unique emission spectrum for every gas, as illustrated below:

Here are the absorptivities (and hence emissivities, by Kirchoff's Law) of a variety of gases across a range of frequencies relavent to atmospheric processes:

Returning to Planck's Law, it tells us that as the temperature of a black body increases, the intensity of the radiation from that black body increases at every wavelength. This can be seen in the graph below.

If a gas is hot enough to radiate, it will radiate at a given wavelength at an intensity given by the black body intensity at that wavelength (as determined by Planck's Law) multiplied by the emissivity at that wavelength (as shown in the chart above). That means the wavelength of peak emission may not coincide with either the wavelength of peak emission of a black body (as shown by Wien's Law) or the wavelength of peak emissivity. Instead it is both a function of the intensity of black body at each wavelength and emissivity at each wavelength. Thus even though the emissivity of CO2 at aproximately 2.5 and 4 micrometers is just as great as that at 15 micrometers, at normal Earth temperatures radiation from those wavelengths is inconsequential, while that at 15 micrometers dominates.
Where the Earth's atmosphere warmer than 15000 K, so that the peak blackbody radiation occured at wavelengths of approximately 2 micrometers, far more energy emitted from CO2 would come from the 2.4 and 4 micrometer bands than the 15 micrometer bands. Fortunately for us, the atmosphere is much cooler than that and the 15 micrometer band dominates, but the only significance Wien's Displacement Law has with regard to that fact is that the peak radiation for atmospheric temperatures occurs around 20 micrometers, not around 5 micrometers.
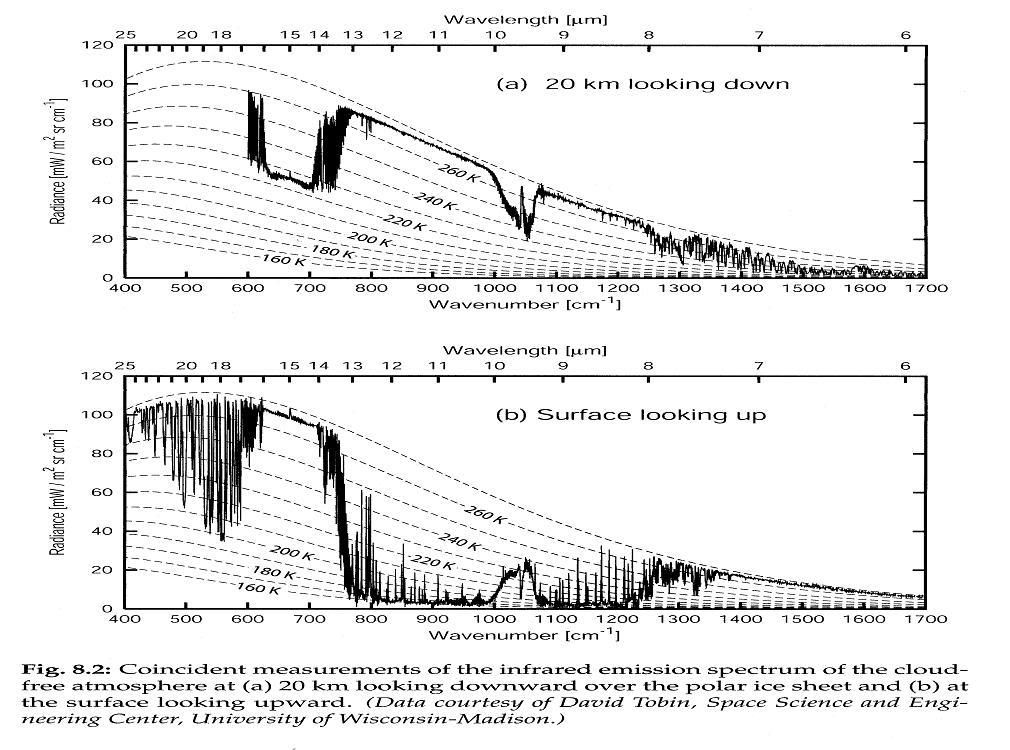
Combining these facts together, the fact that the wavelength of peak emission for CO2 coincides with the wavelength of peak radiation for a black body at 193 K is pure coincidence, and tells us nothing about the intensity of the radiation of CO2. This is clearly demonstrated by the back radiation from Barrow (on the north coast of Alaska) and Nauru, as shown below. The radiation intensity at 15 micrometers is from CO2. It is far more intense from the warmer Nauru than it is from Barrow. In both, in fact at 15 micrometers it approximately coincides black body curve for the surface temperature at the location. In Nauru, on the 15th of November, 1998, it readiates at a black body temperature of 300K at 15 micrometers, whereas at Barrow on the 10th of March, 1999, it radiates at a black body temperature of slightly less than 245 K at 15 micrometers (due to a temperature inversion).

In sum, the idea that CO2 radiation is "very, very low energy" because of the wavelength of its primary radiation is shere nonsense. At best it reflects abysmal ignorance for which there cannot be any possible further excuse.
Further, while it is true that all molecules in the atmosphere radiate at 288K, the intensity of radiation of all but the greenhouse gases is inconsequential relative to that of CO2 at that temperature, even allowing for relative abundances. Further, the radiation at 15 micrometers is inconsequential relative to that of CO2 for all atmospheric gases other than H2O. As it happens, because H2O is far more abundant than CO2 at temperate and tropical surface temperatures, and because it absorbes strongly at far more wavelengths, most radiative absorption in the lower atmosphere will be by H2O. That, however, is irrelevant to the greenhouse effect because the energy is transferred to CO2 by collision, and because at high altitudes, CO2 is far more abundant than H2O, and it is the cool temperature of CO2 radiating to space (and hence from high altitudes) that determines the strength of the greenhouse effect.
Moderator Response:[PS]I could be wrong but I suspect cdbenny may think that GHE is largely about warming of gases in atmosphere and missing backradiation to surface. ie see introduction here.
-
bozzza at 16:42 PM on 18 February 2016Record high snow cover was set in winter 2008/2009
Snowfall, for me, doesn't seem to prove AGW.
Am I missing something?
-
bozzza at 16:33 PM on 18 February 2016DMI show cooling Arctic
Ah, OK: I suppose I am making the general point about document shock making people sick of reading documents properly.
Sorry,.(.. whoah is us!)
-
bozzza at 16:30 PM on 18 February 2016DMI show cooling Arctic
Ok, well i am making a general comment about the issue of document shock.
Many diagrams or charts only show a slight result. Some might show more but the point I am making is about getting to the guts of it otherwise the groupthink of democracy will never be convinced enough to vote for action.
This, I suppose, begets the idea of the necessity of responsible leadership.
-
RockfordFile at 15:59 PM on 18 February 2016It's the sun
New user here. Just found this link being offered up by a denier running a blog called notrickszone.
http://notrickszone.com/2016/02/16/impossible-to-ignore-in-2015-alone-massive-250-peer-reviewed-scientific-papers-cast-doubt-on-climate-science/
It purports to tout 250 studies from 2015 that deny AGW. Having reviewed these lists from deniers before, I'm uh, skeptical, that many of the studies say what is claimed of them.
-
Glenn Tamblyn at 15:00 PM on 18 February 2016Greenhouse Effect Basics: Warm Earth, Cold Atmosphere
cdbenny
"All the molecules in the atm radiate, say at 288K, O2,N2,H2O,CO2,Ar, and would cool at same rate"
Incorrect. Only the GH gases - H2O & CO2 in your list - radiate in the infrared. O2, N2 and Argon can't radiate in the infrared - being symmetrical molecules (or atoms in the case of Argon) they are unable to generate a charge separatrion across the molecule and thus can't support emission or absorption of IR photons.
Radiation by gases is a very different process from radiation by solids or liquids. The main driver of what is going on once absorption has occurred is collisions. Absorbing molecules transfer the energy they have absorbed to other molecules around them through collisions.
And potential emitting molecules are energised to then be able to emit through collisions with non-emitting molecules. -
ryland at 13:49 PM on 18 February 2016Checking Ted Cruz's climate science denial howlers
knaugle@4 It's probably better to stay away from grammar etc as it leaves one open to humorous comment. Humerus is the long bone from shoulder to elbow. Although that said, it may well be your use of humerus, of which the funny bone is part, was a clever play on words.
The views on climate change of the current leading candidates for a republican POTUS may well change as the percentage of Republican voters accepting AGW is steadily increasing. It seems probable however that Ted Cruz' comment on the rescue of the exploration ship will hit home because the crew did need to be resued and it is unlikely many voters will pursue the matter beyond that.
-
cdbenny at 12:21 PM on 18 February 2016Greenhouse Effect Basics: Warm Earth, Cold Atmosphere
@110: 2nd para., 2nd line; "...and maintain same temp (convection) at any particular elevation (say 1 meter delta).
-
cdbenny at 12:14 PM on 18 February 2016Greenhouse Effect Basics: Warm Earth, Cold Atmosphere
Curtis @109: Your last paragraph "...IR absorbed by CO2 can be inconsequential...more important is avg.temp at which the heat stored in CO2 is radiated. That heat can come from collisions with other molecules (convection) and does not need to be specifically absorbed by CO2."
All the molecules in the atm radiate, say at 288K, O2,N2,H2O,CO2,Ar, and would cool at same rate, and maintain same temp (convection). The 'heat stored' in 200ppmv CO2, represented by its heat capacity, is abt 1/4,800th Joules/K compared to the rest of the atm components. So, if IR absorbed by CO2 'can be inconsequential' why is CO2 more-or-less important than the other atm components? (It is understandable that IR absorbed by CO2 can be inconsequential if it is very, very low energy.)
-
bozzza at 12:08 PM on 18 February 2016Checking Ted Cruz's climate science denial howlers
..a negative feedback mechanism!
-
barry1487 at 08:53 AM on 18 February 2016Tracking the 2°C Limit - January 2016
Just to confirm, you've offset (drawn back) RSS by 6 months relative to ONI? Looks like it should be 5 months, locking on peak warmth/el Nino. What drew you to choose 6 months? Better overall correlation?
-
ubrew12 at 08:16 AM on 18 February 2016Checking Ted Cruz's climate science denial howlers
Tamino (article here) has listed evidence that Antarctica's sea ice was much larger in the first half of the 20th century than at present: " These sources indicate considerably greater southern ice extent than at present, a conclusion which is supported by other studies (de la Mare 1997, Nature, 389, 57; Jones 1990, J. Clim., 3, 1193)." He then performs a reconstruction of Antarctic sea ice extent:
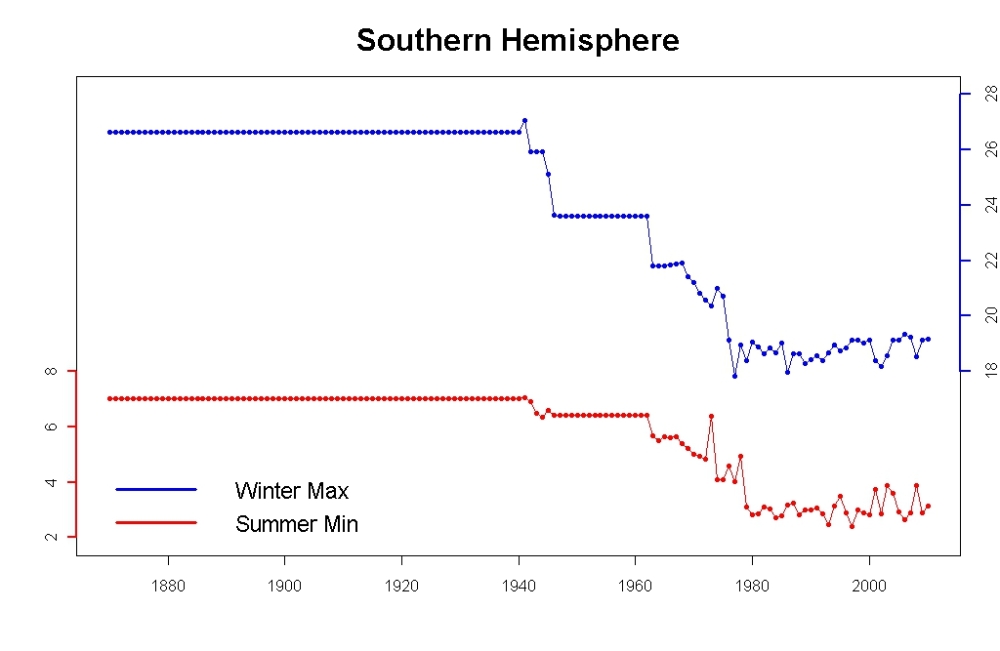
Looks like a substantial collapse occurred between 1940 and 1975. Is it possible that by 1975 the sea ice had 'nowhere to go but up'?
Moderator Response:[PS] Image resized in accordance with comments policy.
-
ubrew12 at 08:00 AM on 18 February 20162016 SkS Weekly News Roundup #7
For your readers edification: This article details the distance between what Exxon says about a carbon tax (it supports one) and what the Congressmen Exxon funds are doing about a carbon tax in the U.S. (blocking it at every turn).
-
knaugle at 05:31 AM on 18 February 2016Checking Ted Cruz's climate science denial howlers
#1
I hate grammer nazis with a passion. That said, the statement that Ted Cruz is "praying" upon the scientific weakness of the USA political right is a rather humerous pun. It highlights the unwillingness of many USA Southern Evangelicals to accept good science at face value. -
gregcharles at 04:42 AM on 18 February 2016Checking Ted Cruz's climate science denial howlers
What record shows 14 out of the hottest 16 years have been since 2000? I've asked this before, but never got an answer. I usually follow NASA GISS at http://data.giss.nasa.gov/gistemp/tabledata_v3/GLB.Ts+dSST.txt . Based on its Jan - Dec anomalies, all 15 years of the 21st Century would make the list of the hottest 16 years. 1998 is the one and only 20th Century year on the list, where it tied for the 7th hottest year.
-
PhilippeChantreau at 04:14 AM on 18 February 2016This climate scientist has tried really hard to get a date
Tom Curtis, your link to wikipedia does not clearly explain how the French Academy has not been or is not successful in maintaining standards for the language. Spelling is quite important in French, where mutiple different words can be spelled identically but take different meanings depending on type and position of accents, for instance. This is especially true for verbs, and is of concern regarding semantic. The Academy does produce changes, albeit not at the pace that the populace sometimes would like to see. Those of us who do not struggle with spelling are not bothered by its conservatism. Some minor controversies have been blown out of proportions by the mass media when they have nothing else to talk about. Whereas it is true that phonetic can and should change, I am not opposed to guard against change coming from a generic dumbing down. I find it inapropriate to use the word "tyranny" in these matters. Nobody is suffering much, really...
Now, back on topic before we get slapped by moderation...
Moderator Response:[PS] Indeed, lets not have a grammar/spelling discussion.
-
Tom Curtis at 02:43 AM on 18 February 2016This climate scientist has tried really hard to get a date
OPOF @5, you have it backwards. American English typically is more conservative than the English of Kent (ie, BBC English) just as Yorkshire English also tends to be conservative. Consequently where American English and "English" English differ, normally it is the language of England that represents the innovation. In this case, 'gass' may be a last remnant of the middle English spelling customs that gave us manne (for man).
As for an impossed tyranny of uniform spelling, that makes no more sense (and will be no more successful) than the French Academy. There are reasons why Chinese characters (at heart pictograms) should not vary over time, while the phonetic alphabet of English should. If it does not, it becomes arbitrary, and no longer a phonetic alphabet at all. We will have thrown away the Phonecian's great and lasting innovation in the pursuit of dogmatism.
-
One Planet Only Forever at 01:13 AM on 18 February 2016This climate scientist has tried really hard to get a date
My careless reliance on automated spell-checking resulted in the obvious gaff of 'will' instead of 'while'.
-
One Planet Only Forever at 01:10 AM on 18 February 2016This climate scientist has tried really hard to get a date
Digby Scorgie @4,
I would encourage you to discourage the use of 'gasses' as an alternate of 'gases'.
It appears the misuse of the spelling 'gasses' is rampant in the englishy speaking lands that rebelled and wanted to be different from original English (mainly the US, a place that even made up a different spacing between rails for trains just to be different, and comically continues to drag out the use of English weights and measures).
If 'gasses' has a use it clearly is as a verb, along with 'gassed' and 'gassing'.
Used in a sentence "Timmy often gasses a room to gross out others, and is amused (never to become amuzed) by the sound made will gassing and the look on the faces of others after he has gassed."
My basis for declaring that it is inappropriate to use gasses as the plural of gas includes the Scholastic Children's Dictionary 2002 edition which only lists gases as the plural of gas. The hope of that book appears to be to correct an incorrect development in the US.
Other spelling fads of the US rebellious phase should also be 'encouraged to fade away', such as their choice to spell colour as 'color' even though the ending sound of the word is more like fur than for so if they were to be reasonable in their rebellion they would have dropped the 'o' and spelled it 'colur'.
However, rebellious people often are not reasonable or rational. And pointing out that they are 'going through a phase (never to become faze) of irrationality' often angers them. So be careful how you discourage the use of gasses.
As for the evolution of language, the way a word is said and the meaning of a word can indeed change, but its written presentation should be a constant. The Chinese understand how important that is. And even English speaking people can understand the importance of always spelling 'roof' the same way even though it can be said in many ways including the 'phonetically spell-able' versions 'reuf' and 'roove'.
-
Jim Hunt at 23:20 PM on 17 February 2016Checking Ted Cruz's climate science denial howlers
It may surprise Ted Cruz to discover that a variety of Antarctic sea ice metrics have taken a terrible tumble this (Southern Hemisphere) summer.
Messrs Monckton, Soon and Legates also seem remarkably reluctant to discuss this perhaps surprising turn of events:
http://GreatWhiteCon.info/2016/02/for-life-on-earth-ice-is-not-generally-a-good-thing/ -
bozzza at 16:33 PM on 17 February 2016Checking Ted Cruz's climate science denial howlers
Deliberatley taking science out of context has to be a concern for any serious person appealing for political capital. I would expect this weakness to be prayed upon by way of forcing an extended debate on the matter.
-
Mal Adapted at 12:02 PM on 17 February 2016No climate conspiracy: NOAA temperature adjustments bring data closer to pristine
OPOF:
The greatest threat to humanity is "Misleading Marketing".
OPOF has identified the fundamental reason why AGW is an existential threat. Scientists are constrained to let facts speak for themselves, or they are subject to severe professional sanction. The people who stand to lose the most if the world stops burning fossil carbon are, OTOH, not subject to penalty for misleading the public by the clever use of language. They are willing to pay top dollar for skilled professional disinformers, because it takes money to make money Hence, the doom of the world.
Prev 527 528 529 530 531 532 533 534 535 536 537 538 539 540 541 542 Next


