


 Arguments


Recent Comments
Prev 535 536 537 538 539 540 541 542 543 544 545 546 547 548 549 550 Next
Comments 27101 to 27150:
-
Tom Curtis at 06:29 AM on 1 October 2015CO2 lags temperature
tatelyle @476, the Earth is effectively a sphere. No amount of rotations, changes of tilt or axial wobbles will change the total amount of energy recieved by a sphere by radiation from a distant source. All that will change is the location on the surface that recieves the insolation. It follows that while changes in obliquity and precession may change the insolation in July at 65 degrees North substantially, it cannot change the total amount of energy recieved by the Earth anymore than the day night cycle can. Thinking that it can is just a more subtle version of the error that thinking that just because it happens to by night time at my current location, therefore the global average energy recieved from the Sun at the moment is zero.
In contrast, changes in eccentricity can change the annual average insolation. That is because with a more eccentric orbit, the Earth spends more time at a greater distance from the Sun. That more than compensates for the briefer time spent closer to the Sun. This effect, which is the only Milankovitch cycle that actually changes global, annually averaged insolation, is very small. If my calculations are correct, the maximum change is of the order of 0.2% or about 0.5 W/m^2, and is typically much smaller than that.
That being the case, milankovitch cycles can only significantly effect global temperatures if there are, not just feedbacks, but differences in th feedbacks that depend on location and season. If the winter feedback to the change in insolation in the NH was as strong as the summer feedback, milankovitch cycles could not result in glaciations. Likewise, if the NH feedback was as weak as the SH feedback, the milankovitch cycles could not result in glaciations.
And of course, if there were no feedbacks, there could be no variation in the strength of feedbacks based on latitude and season.
As it happens, the feedback that shows the most seasonal and latitudinal difference is the albedo feedback. This is, primarilly because in the NH, lower latitude snow falls on land and can accumulate, wheras in the SH it falls on water and melts. As a result, the NH albedo feedback is stronger. Further, because of seasonal variation in insolation, the albedo feedback is also seasonal, being stronger in the summer than in the winter. That means that an albedo feedback by itself could, in principle, induce glaciations from milankovitch cycles. In practice, however, the size of the albedo feedback is fairly well known from knowledge of the size of glaciation. It turns out to be about half of what is needed to actually explain the temperature variations. The total temperature variations can be fully explained only by assuming an additional, greenhouse feedback. As that feedback is predicted by radiative theory in any event, it would be obtuse to insist that it does not exist, thereby requireing a new radiative theory (which has not been supplied by the "deniers") and that we add significant complications to our theory of milankovitch cycles to make room for this non-existent new radiative theory.
-
Tom Curtis at 05:28 AM on 1 October 2015Was Broecker really the first to use the term Global Warming?
I do not know what source Tor B reffers to, but google n-gram shows "climactic change" first appearing in books in 1942; "climate change" first appearing in 1776 and becoming increasingly popular after the 1960s, before skyrocketing in use from the late 1980s; and "global warming" first occuring in 1869, becoming increasingly popular from 1977 onwards, before skyrocketing in the late 1980s as well.
On a related myth, "climate change" was initially more popular, and has been the more popular of the two terms, "climate change" and "global warming" since 1994 (significnatly so since 1996). "Global warming" was the most popular only from 1990 - 1993.
-
rocketeer at 05:26 AM on 1 October 2015Was Broecker really the first to use the term Global Warming?
Semantics aside, if you look at the global temperature graph published in Broecker's letter, It predicts the global average temperature in 2015 to within 0.1C as best as I can measure it. Not bad for a napkin-quality projection. I also find it interesting to compare this plot wiht the Berkeley BEST reconstruction. Shockingly similar.
-
Tor B at 03:29 AM on 1 October 2015Was Broecker really the first to use the term Global Warming?
I know this is in ‘English language books’ and not ‘scientific papers’, but
show the term “climatic change” showing up regularly since about 1850, “climate change” since the 1920s and “global warming” since the late 1950s. “Climatic change” usage peaked in the 1990s, and “global warming” and “climate change” took off in 1986. In British English, “Climate change” became significantly more used than “global warming” after 1992.
Moderator Response:[Rob P] - The string you pasted, and now edited out, was breaking the page layout.
-
ranger001 at 02:43 AM on 1 October 2015Eocene Park: our experiment to recreate the atmosphere of an ancient hothouse climate
Question: Since we don't really understand why the Eocene Epoch cooled could it be that global warming of the Earth will cool again due to the same factors that made the climate cool after the Eocene?
-
PhilippeChantreau at 01:08 AM on 1 October 2015CO2 lags temperature
tatelyle, you're talking about a runaway warming or cooling, which can happen only if the feedbacks are greater than 1. It is obviously not the case. See the "positive feedback means runaway warming" post, use the search engine.
-
sailingfree at 00:21 AM on 1 October 2015Temp record is unreliable
Deniers use the arguement that the data are fudged to cast doubt on the rising temperatures. This acticle should show Zeke Huasfather's work, that shows that the raw data has MORE warming, that because of adjustments over the oceans, the estimate of global warming are LESS than the raw data.
-
MA Rodger at 00:19 AM on 1 October 2015CO2 lags temperature
The graphic which tatelyle was trying to post @477 is below.

-
tatelyle at 00:11 AM on 1 October 2015CO2 lags temperature
And other question, if I may.
If the world warms, and increasing CO2 acts as a positive feedback, why does the temperature eventually stop increasing, and reverse? Surely more CO2 means ever increasing temperatures.
Especially as Milanokovitch cycles are not very influential, and need a feedback, as many commentaters have said here.
Conversely, when the world cools and reducing CO2 is less able to warm the world, why does the temperature not continue cooling and end in a snow-ball Earth?
Surely a strongly positive feedback CO2 would be very unstable, leading to runaway temperatures both ways. But this is not what we see, because temperatures are tightly controlled withing 10ºc.
Thanks
Moderator Response:[Rob P] - The flaw in your reasoning is the assumption that CO2 would keep increasing. The leading hypothesis is that carbon stored in the Southern Ocean is released by warming. Once that ocean carbon store is exhausted, no more extra CO2 is reaching the atmosphere. So no more push in the direction of warming.
There is a recent paper that seems to be making a stronger case for this hypothesis: Southern Ocean buoyancy forcing of ocean ventilation and glacial atmospheric CO2. Here's some slides from a lecture given by the papers authors. -
tatelyle at 20:23 PM on 30 September 2015CO2 lags temperature
Let me see if I can make that graph display properly:
[img]https://www.cabrillo.edu/~rnolthenius/climate/Denialists/D-Ruddiman/milak&temp.jpg[/img]
-
tatelyle at 20:21 PM on 30 September 2015CO2 lags temperature
The article states that CO2 is a feedback that assists Milankovitch cycle warming / cooling. Many commentaters here have also stated that Milankovitch influences are weak, and need a feedback to have any effect on climate. Can someone explain why?
The following graph is of Milankovitch forceing changes in the all-important high latitudes, and they are up to 100 wm2, or 25% of the average insolation strength. In what way is this large change in insolation 'insignificant', requiring a feedback to assist it?
https://www.cabrillo.edu/~rnolthenius/climate/Denialists/D-Ruddiman/milak&temp.jpg
Moderator Response:[Rob P] - See this post: Milankovitch Cycles, by Chris Colose.
-
One Planet Only Forever at 13:07 PM on 30 September 2015Is the fossil fuel industry, like the tobacco industry, guilty of racketeering?
In 1987, about the time of the 'change of mind' of the leadership of Exxon, the UN published "Our Common Future". It presents in detail many of the ways that development had been headed in an ultimately unsustianable and increasingly damaging direction, including the problem of excess CO2 from burning fossil fuels.
The following explanations of he unacceptable irresponsible developments are presented in the document: "We act as we do because we can get away with it." "Future generations do not vote; they have no political power or financial power; they cannot challenge our decisions."
The Exxon executives and investors may have felt threatened by the document and the actions towards reducing CO2 emissions which were mentioned as a needed change. Or they could have been encouraged by the awareness that they could get away with behaving less acceptably.
Either way, those executives and those investors all those years ago would be the ones to remove wealth from and put in jail. Which is proof positive that deliberately irresponsible cheaters can and do prosper in the democratic free-market (and they also prospered in communist ruled nations and in dictatorships). Those people gamble that they will get away with what they want without being caught and penalized, and even if they are caught they could consider that they had a better time for several years that others will never ever get to have (in other words they may consider themselves to be the winners even if they are caught).
-
swampfoxh at 10:02 AM on 30 September 201510 Things We Learnt From Reddit About Understanding Climate Change
A risk of failure in promoting actions mitigating climate change involves, especially, the Christian religion's belief in two central dogmas: 1. The idea of the Second Coming and its corrollary belief that we are in the End Times. 2. The notion that God is in control of everything and he surely will not harm his beloved. Christians recognize that "bad things happen to good people", but it doesn't "happen to everybody and it surely wouldn't happen to me if I remain sin free and obedient to my Lord." The recent Papal expression on climate change is, as usual, not enough to change the hearts and minds of most Christians, so how do we handle this problem? It might be easier if the majority of the Christian world lived in Third World countries where political and economic power is (relatively) inconsequential, but they don't.
-
Alexandre at 06:25 AM on 30 September 2015Is the fossil fuel industry, like the tobacco industry, guilty of racketeering?
This deserves a huge lawsuit against Exxon.
-
william5331 at 01:45 AM on 30 September 2015Drought stunts tree growth for four years, study says
Perhaps it takes that long to recharge the water table that the trees access.
-
One Planet Only Forever at 23:36 PM on 29 September 2015Climate change set to fuel more "monster" El Niños, scientists warn
grindupBaker,
The Denial 101 content includes presentations of other factors that significantly affect the GMST like volcanic releases, and not just the number or volume of release but how high the volcanic gases go.
The amount of such volcanic cooling may be skewing the trends you are looking at. The amount of volcanic cooling was particularly low during the 1997/98 El Nino event.
-
cleanshirt at 21:25 PM on 29 September 2015It hasn't warmed since 1998
Hi, The link to the ECMWF analyis of the HadCRUT data is broken. Any chance of a link to this study? Have Googled but can't find anywhere.
Moderator Response:[DB] An archive copy of the study can be found here. I've also updated the rebuttal with this same link.
-
Tom Curtis at 19:29 PM on 29 September 2015So what did-in the dinosaurs? A murder mystery…
grindupBaker @92, the "ejecta" consists of the rock ejected from the crater by the impact. Viewed logically, and given the size of the impact, at least some of the ejecta must have escaped to space, ie, achieve orbital velocity. That being the case, then some portion of the ejecta must have acheived a just suborbital velocity with the result that it would have been deposited very distant from the crator, and hence logically, ejecta should be found world wide.
In fact, geologically, the Cretaceous-Tertiary (K-T) boundary is characterized an iridium enriched layer containing micro-tektites:

If I remember correctly, this K-T layer was first found in Italy, but has been found world wide:
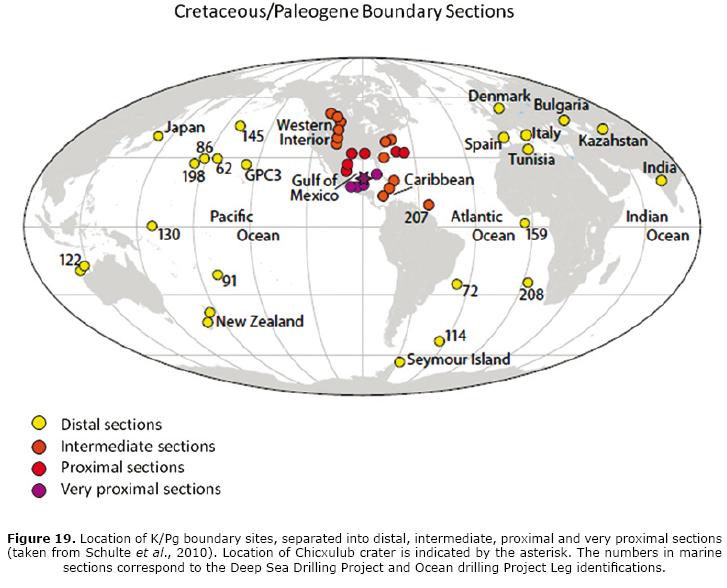
I had not thought about the red-hot aspect of the ejecta before. Certainly while following a sub-orbital trajectory the micro-tektites would not have significantly cooled (radiative cooling being fairly inefficient), but I had mostly assumed they would be quenched by the atmosphere. Turns out that is not so. This paper, for example, suggests previous estimates of the associated heat pulse to have been overstated, the pulse only being "... >5 kW/m2 for a few minutes" which "... may have been sufficient to ignite localized fires and kill fauna lacking temporary shelter". So red hot ejecta, and very unpleasant is a best case. I do not know where the consensus on that debate has settled (if it has formed at all).
-
grindupBaker at 17:07 PM on 29 September 2015So what did-in the dinosaurs? A murder mystery…
I disagree with "a near-global rain of red-hot ejecta" in the posting. I'd like to see the physics in the paper about that. I'm assuming that "ejecta" means lava, if it means ash or gas then it really should say that. I scale Earth 5,000,000:1 in my ponderings because it's a handy 100" dia. that fits my kitchen and bashes only a modest hole to 4" about drywall ceiling. Ocean lithosphere 0-3/8" thick around that liquid interior rock an iron core. Land plates to 2-1/4" thick but almost all <3/4" thick. Ocean water 1/20" thick. Troposphere 1/8" thick at equator.
Chicxulub rock 1/13" dia. (a Tapioca grain) hits my Earth ball that's filling half my kitchen. How on Earth (I mean literally) does that cause a "rain of red-hot ejecta" tapioca bits to land way around the other side unless they fly our to my fridge (which is near the Moon) and bounce back ? I think this whole raining of this and that has become wildly exaggerated beyond the vaporous cloud of ash & nasty gases thaht doubtless drift in a very leasurely fashion around my kitchen Earth ball towards my sink.
-
grindupBaker at 15:15 PM on 29 September 2015Climate change set to fuel more "monster" El Niños, scientists warn
Somebody at sks 1-2 years ago plotted GMST with differing symbols for the El Nino, La Nina & ENSO-neutral years. I looked at it a bit and it raised a question (at the end of this).
If you plot the El Nino years only, which are 1966, 1969, 1973, 1977, 1978, 1980, 1987, 1995, 1997, 1998, 2003, 2005, 2007, 2010 you clearly see a warming trend of 0.20 degrees / decade 1966-2010
If you plot the La Nina years only, which are 1967, 1968, 1971, 1974, 1975, 1976, 1985, 1989, 1991, 1996, 1999, 2000, 2001, 2008, 2009, 2011, 2012 you clearly see a warming trend of 0.16 degrees / decade 1967-2012
If you plot the ENSO-neutral years only (middling between La Nina & El Nino) which are 1970, 1972, 1979, 1981, 1986, 1988, 1990, 2002, 2004, 2006, 2013 you clearly see a warming trend of 0.16 degrees / decade 1970-2013
(I skipped El Chichon, Mt. Pinatubo, Mt. Hudson years 1982-4, 1992-4)
The "clearly see" above means I eyeballed it, no LSQ fitting software. Are El Nino years "pulling away from" La Nina & ENSO-neutral like they seem to be ? If so, is this known & expected from the increase in shallow (well-mixed & thermocline) OHC ? It looks tentatively as though El Nino years might have accelerated to 0.23 degrees / decade since 1990 but there are few points and no straight-line trend has a good fit so it'll need many more El Nino years to see a clear trend there. Can anybody inform whether an increasing difference in GMST between El Nino & ENSO-neutral years is expected (or just my old eyes) ?
-
grindupBaker at 15:02 PM on 29 September 2015Climate change set to fuel more "monster" El Niños, scientists warn
Wol @2 Ogemaniac @3 Tom Curtis @5 But but we counter the 0.00 warming 2016-2032 gambit with the warming 2019-2032 defence (at least, you do. I could counter in a seance). I've been doing it since I saw Monckton's (?) hoot at WUWT. It's +0.00/decade GMST 1996-10 to 2014-10 (WUWT) but then it's +0.12/decade GMST 1999-02 to 2014-10 (moi). Since 1999-02 is more recent than 1996-10 this shows clearly that "global warming" has increased since 1996-10 and furthermore 1.2 degrees / 0.0 degrees = an infinite rate of increase. I love this nonsense that they do. Science gets really tedious with lots of "studying" and "analysis" and "thinking" and stuff, but this entirely other stuff is great fun.
-
chriskoz at 07:12 AM on 29 September 2015Drought stunts tree growth for four years, study says
How does this new study affect the paleo-dendrology temp reconstructions? We know dendro reconstructions of mountain pines show a famous "decline" since 1960s, that was later explained by experts as possible CO2 fertilisation effect. Can droughts also affect ring densities, i.e. temp proxies? Or is the effect too short lived and everaged over many samples so that long term ring density data is not affected?
-
CBDunkerson at 04:55 AM on 29 September 2015Climate's changed before
RayfromNY, your proposals 1 & 4 would have neglible impact on emissions and seem unlikely to happen. We'll switch to electric vehicles long before such 'lifestyle' changes would ever be approved.
Proposal two doesn't specify where all this organic garbage would go once you banned it from landfills... and would again have virtually no impact on global warming.
I'm all for some variation of proposal three, though it would only be a stopgap measure.
-
theldsthinker at 20:43 PM on 28 September 2015Scientists Respond To Tol’s Misrepresentation Of Their Consensus Research
Even if 55 percent of climate scientists accept the global warming theory, that is still high enough for us to take it seriously. However, I find it funny that science deniers can´t make a good list of climate researchers that disagree with the basics of the global warming theory.
-
Tom Curtis at 19:41 PM on 28 September 2015Climate change set to fuel more "monster" El Niños, scientists warn
Rob P inline @6, 72-73 was not a super El Nino based on either the SOI (first graph) or MEI (second graph), although 82-83 certainly was:


jyh @6, while concern about temperature increases due to global warming inflating ENSO indices is a reasonable concern, it is not relevant to either the Southern Oscillation Index (SOI) and or the Multivariate ENSO Index (MEI). In particular, the SOI is an index of the air pressure difference between Tahitii and Darwin. This in turn relates causally to the strength of the trade winds, which in turn relate causally to the El Nino/ La Nina oscillation. Because the SOI is a temperature measure, it is not going to be inflated by the impact of global warming.
The MEI is a conjoint index of six variables, two relating to temperature, two relating to wind velocity, and the others relating to air pressure, and to cloudiness respectively. However, even the temperature indices used are measures of the variability of tropcial sea surface (or air) temperatures over the entire tropical Pacific. As global warming will effect the entire area approximately equally, it will not show up in the measure of variability. Ergo, quite appart from the dilutting effect of the other four indices, the MEI will not be distorted by the effects of global warming.
Having said that, it is not clear that the current El Nino will be a super El Nino. According to the MEI (and purely temperature based indices), it already is. Based on the SOI, it is only on the verge of developing into one (but may not worsten). In either event, we should expect warming temperature until at least December, and possibly March - even if the SOI immediately starts rising.
Moderator Response:[Rob P] - See Hong et al (2014). They define it as exceeding two standard deviations in the Nino3 index. IIRC Mojib Latif and others published a recent paper on super El Nino and used a different standard altogether.
And recent published literature, based on climate modelling, does project an increase in the magnitude of ENSO events because of the warming of the ocean. That might be worth a blog post or two explaining why this is so.
-
jyyh at 16:58 PM on 28 September 2015Climate change set to fuel more "monster" El Niños, scientists warn
I'm still of the opinion this is not a huge El Nino but more like 1982 one. Background has gone up so anomalies look huge, ok. Not too sure we'll see much of the argument about 2016, though. Maybe they'll divert to the pollution argument about coral bleaching.
Moderator Response:[Rob P] - 1982/83 was a super El Nino, along with 1972/73 and 1997/98. As for coral bleaching, sea surface temperatures along the eastern Australian coast seem to be building already, which may signal trouble ahead for the Great Barrier Reef.

-
RayfromNY at 06:30 AM on 28 September 2015Climate's changed before
Okay, I am a skeptic, but not foolhardy. There is no need to temp "Mother Nature", as that would be indeed very foolish. I follow some simple rules. First and foremost is to "Live simply so others may simply live". Hope that is not too offensive.
I was in Newport RI, 36 years ago. I walking south along Ochre Point Ave looking for "The Breakers". To my left was a tall hedge row that was so dense that light could not be seen through it. I saw some people in a group not too far down the road. I suspected that maybe this was where I wanted to be. Sure enough, as I approached, I could tell there was a access point. My first view inside was to the right in a southerly direction and all I saw was vast open grassy field. I was not until I reached a point past the left of the entrance did the building to the left come into view. My first gut reaction was that I became nauseated. To this day, segments on TV, such as "Living Large", disgust me and I do not watch them. There is no reason that this "dwelling" should have existed as a home of a single family. For the same reason, I do not see why any CEO should make 1000 times more than his highest paid employee. Just a few years ago, I recall that a CEO received a total compensation equal to almost 3,700 times that of the companies managers and that year the business not only lost money, it would have gone bankrupt without a bailout. But, I digress.
I have had hot air solar panels on my home since the time of Carter. I do not own a lawn mower, but when I did, it was a single "man" powered hand reel. I have since a abandoned the idea of have a lawn all together. When I had a lawn, all I can tell you is that it was "green", as I never applied fertilizer or weed killer and God watered it. I walk to Church on Sundays, every Sunday no matter what the weather. I only use the A/C when I have to, usually when we have company. I have replaced almost all of my incandescent light with CFL and I an now in the process of replacing the CFL with LED lights and am now using more than 90% less power than I did with the incandescent bulbs. We never waste food-ever. We walk whenever practical. I gave up golf long ago, because every round of golf requires 1,200 gallons of water. Water is second only to air when it comes to survival. Speaking of air, while college in 1967, I circulated a petition to have smoking banned from the cafeteria area, which if adopted, would have made the building smoke free, as the other area was the student lounge, which was smoke free. (My petition failed even though I had substantial support). That is my story. Think globally and act locally for the good of the planet. It is my guess that Earth will be my only home. Apparently, not everyone thinks the same as I do. If everyone is so sure the current spike in Global temperature is a direct result of human activity and for all intent it is "settled science", then why are we not doing something.
The US imports or consumes an extra 350 million barrels of oil to produce an extra 6.5 billion gallons of gasoline that when burned produces 61 million metric tons of CO2. And how is this 6.5 billion gallons of fuel consumed here is the great wasteful US of A. IDLING!
My proposals. #1. Idling will not be tolerated ever. Idling laws will be rigidly enforced and fines for idling will be so draconian that no one would even considering idling their vehicle. 2. Idler lose licenses. Period. 3. Remote starters totally illegal. 4. End of all drive through banking except for those who are disabled. 5. End of all fast food drive and all other drive through services.(accept for the disabled) You want to eat at Taco Bell, Burger King or McDonalds, etc., fine, park your car and walk inside.
Proposal number two: Eliminate all organic garbage from landfills. Organic garbage in the US produces more than 10 % in terms of CO2 of all global warming gases as methane. Methane is 21 times more potent than CO2 as a greenhouse gas. Add to this the 400 million exta barrels of oil required to produce all the extra fuel to produce the estimated 31 million tons of food that is produced, transported, stored and then just dumped in the garbage. You might not believe it, but many household do not even own containers to store left overs. Everything goes into the garbage.
Proposal three: Stop all cutting down of the rain forests. For all other tree farms, for every tree harvested for timber, three trees would have be planted.
Proposal four: Limit car size and engine size.
I could go on, but I know no one is really concerned about "global warming" otherwise we would be doing something NOW!
-
One Planet Only Forever at 12:24 PM on 27 September 2015Exxon's Own Research Confirmed Fossil Fuels' Role in Global Warming Decades Ago
Re-reading Bill McKibben's "The End of Nature" has led me to find an interesting timing link between the 'change of heart and mind" of the Exxon Executive and the UN.
In 1987 the UN sponsored report "Our Common Future" was published. Starting to read this document, it seems to be the sort of thing that would send the leadership of an industry like the one that Exxon 'excelled in' into battle-mode. It also reaffirms my perspective about the damaging types of development encouraged by the current social-political-economic systems.
Almost all systems, from democratic free-market capitalist to dictatiorial and communist, consider the growth of perceptions of prosperity to be deserving of being created and maintained, even if those leading the charge of development in unsustainable and damaging directions could understand how unacceptable they are. Those are fighting words - to those type of people.
-
Daniel Bailey at 07:41 AM on 27 September 2015It's not us
-
Paul Barry at 23:03 PM on 26 September 2015It's not us
Perhaps it is a while since these pages were updated?
In the sections above which discuss the radiation spectra evidence, the links to the following papers do not work: Griggs 2004, Chen 2007, Philipona 2004, Wang 2009, Evans 2006.
Perhaps an investigation into why these links are failing is in order. Is it possible to provide more durable links? Would a more complete bibliographical reference would be a good idea?
-
fk9014 at 19:58 PM on 26 September 2015Celebrated NASA planet hunter shifts his sights back to climate change on Earth
Grr, another one of those [click here to read the rest] links just to get the reader to go to the Guardian website for the final line of the article.
-
Treesong2 at 12:16 PM on 26 September 2015Celebrated NASA planet hunter shifts his sights back to climate change on Earth
I see you corrected two of the three 'Keppler's of the original article but not the 'Principle' Investigator or 'its four years of its operation'.
Bravo for Dr Borucki! I think I'll up my contribution to UCS in his honor. -
michael sweet at 08:40 AM on 26 September 2015Citi report: slowing global warming would save tens of trillions of dollars
CBDunkerson,
This is very good news indeed. Hopefully wind and solar will continue to get cheaper and more and more will be built. Thanks for the link to a good, positive read.
-
Tom Dayton at 02:16 AM on 26 September 2015Satellites show no warming in the troposphere
Tamino showed difference between RATPAC balloon measurements and satellite measurements, which sharply increases after the year 2000.
-
Tom Dayton at 02:12 AM on 26 September 2015It hasn't warmed since 1998
Tamino yesterday posted temperatures with updated removal of influences for solar, reflective aerosols, and El Nino. Still no recent pause visible. Surprise.
-
CBDunkerson at 22:57 PM on 25 September 2015Citi report: slowing global warming would save tens of trillions of dollars
We're now starting to see evidence that renewables are replacing fossil fuels even in some countries that aren't particularly rich in renewable energy and whose governments are actively opposing the transition;
Guardian: Renewable energy outstrips coal for first time in UK electricity mix
Just further evidence that economic realities are starting to drive fossil fuels out of business.
-
Tom Curtis at 16:32 PM on 25 September 2015Climate change set to fuel more "monster" El Niños, scientists warn
Ogemaniac @3, not that quickly. We will first be served with about five years of "it was only because it was a record breaking El Nino" which climate scientists will have "malliciously ignored". Only after that five year break will we start copping the "it hasn't warmed since" meme again.
-
Tom Curtis at 16:29 PM on 25 September 2015It hasn't warmed since 1998
Following KR's suggestion, I have responded to billev elsewhere.
-
Tom Curtis at 16:28 PM on 25 September 2015It's a natural cycle
"The chart, just above, shows me a pause in temperature rise from 1880 until about 1910 and one from the mid 1940's until about the mid 1970's."
As with the chart mentioned above, the chart below shows the GISS LOTI, but adds two sets of trend patterns. The first (trend pattern a) is that described by you above, while the second shows a continuous trend from 1910 to 1964, and a continous trend from 1965 to 2014. The inflexion point was chosen based on the location of the inflexion point in the radiative forcing record. That is, it was not chosen simply to get a best fit in the temperature record:

Despite that, it gives a very good fit. Ignoring the excursion in the early 1940s, they both have an r squared of 0.92, showing that on the basis of correlation there is no reason to preffer one over the other. Even including the early 40s, the cherry picked 5 trend pattern only improves squarred correlation from 0.9 to 0.92.
Against that, to gain that 0.02 lift in correlation, you need to add in 7 extra parameters. That is, you gain a minimally improved fit only by greatly increasing the ad hoc complexity of your model.
Actually, that understates it. That assumes you use an error function on th quarter wavelenght of your wave pattern (ie, the time between inflexion points). Doing so greatly decreases the likelihood of the function but means you only have on extra function. In fact, the inflection points are cherry picked to match known temperature inflexion points, not derived from a model. Ergo you require one parameter per inflexion point, or an additional three parameters.
All this means that any scientific test of the goodness of fit that also measures complexity (such as the Akaike Information Criterion) will pick the three trend pattern over the five trend pattern every time. They will also pick the pure forcing plus ENSO model (which gives an even better fit with no ad hoc parameters) over the three trend model as well, but that is beside the point.
What is important is that you only see the pattern you mention because, either, you have had it imprinted by excess familiarity from denier propaganda; or because you do not properly discount patterns for cherry picked elements. If you let the data speak for itself, and eschew cherry picking - it is obvious that there is a relatively constant rise in temperature from about 1910 to 1965, with a large aberration approximately coinciding with WW2.
-
Kiwiiano at 15:11 PM on 25 September 2015Climate change set to fuel more "monster" El Niños, scientists warn
Just curious...what causes the La Nina trade winds? Do they just happen or are they being drawn toward the warmer (presumably rising) air over the western Pacific? And do they subside during an El Nino or is air rising off the warmer eastern Pacific causing air to be sucked off the Americas, pushing any humid air away from the coast?
Or is it always a lot more complicated than that?
Moderator Response:[Rob P] Check out this video from the UK's Met Office. Yes it's a simplification, but I think it's at the appropriate level for a general audience.
-
Ogemaniac at 12:46 PM on 25 September 2015Climate change set to fuel more "monster" El Niños, scientists warn
I agree, Wol. We need to be ready for a decade or more of "Global warming stopped in 2016!".
-
It hasn't warmed since 1998
billev - I would suggest reading (and commenting upon) the Why did climate cool in the mid-20th Century, or possibly It's a natural cycle, where your recent posts would be relevent. They aren't in this thread.
Hint - Cooling mid-20th century isn't due to a natural cycle, but rather primarily due to anthropogenic factors and volcanic variability. Nor is there any reason whatsoever to expect some cycle-induced cooling to kick in.
-
Rob Honeycutt at 03:06 AM on 25 September 2015It hasn't warmed since 1998
billev... You have to understand that global temperature changes for physical reasons. The 1880-1910 trend is during a period when human greenhouse gas emissions were still very low, but starting to have an effect. At that point in time, natural forcings could have more of an influence on global temperature.
Then, think about what was happening from the 1940's through 1970, and what specifically happened in 1970. First you had WW2 and then a huge amount of industrial growth post war, which put out atmospheric aerosols which tend to block sunlight and cool the planet. Then 1970 saw The Clean Air Act, which cleaned up a large portion of the aerosol output and, essentially, unmasked the underlying greenhouse gas forcing.
-
billev at 02:15 AM on 25 September 2015It hasn't warmed since 1998
The chart, just above, shows me a pause in temperature rise from 1880 until about 1910 and one from the mid 1940's until about the mid 1970's. it also could be indicating another pause beginning about 2000 but that is not clear from this chart. I realize that I used my eyes to observe this chart but wasn't it intended that I do that?
-
Rob Honeycutt at 01:43 AM on 25 September 2015Scientists Respond To Tol’s Misrepresentation Of Their Consensus Research
Tol said at one point:
a. shut up
b. destructive comment
c. constructive commenta. is wrong
c. is not an option. I don’t have the resources to redo what they did, and I think it is silly to search a large number of papers that are off-topic; there are a number of excellent surveys of the relevant literature already, so there is no point in me replicating that.that leaves b
But even here he's not being honest since he's spent vastly more time on this issue than is required to replicate the entire Cook study. His rationale for his choices should be: a) I don't want to, b) I want to, and c) I don't want to.
-
Climate change set to fuel more "monster" El Niños, scientists warn
My prediction is that, if indeed this turns out to be a humdinger of an el nino, the deniers will say that it's all due to short term variability and nothing can be inferred from it. Ignoring the fact that they use the cherry-picked 1998 as their starting date for the "pause".
Might be a good idea to refute this argument before they try it on?
-
Acouphène at 23:42 PM on 24 September 2015Climate change set to fuel more "monster" El Niños, scientists warn
Hello,
What makes that coupling with the atmosphere is good or not?
Thanks!
-
michael sweet at 19:33 PM on 24 September 2015In a blind test, economists reject the notion of a global warming pause
GP Alldredge,
The shape of a 5 year trailing mean and a 5 year centered mean is exactly the same. It is just shifted back 2.5 years. If the "1998 peak" is not visible in the trailing mean it will also not be visible in the centered mean. 1998 is not visible because it is a short weather spike that is averaged out.
-
GP Alldredge at 18:27 PM on 24 September 2015In a blind test, economists reject the notion of a global warming pause
As Tom Curtis notes above @9, the "5-year running mean" presented to the economists is a trailing average such as an economist might expect for forcasting purposes, rather than the usual centered average as used for the multi-year averages of temperature anomalies. The 2.5-year lag forced on this 5-year mean changes the visual appearance of the 5-year mean, reducing the visual correspondence of this mean to the various prominent annual extremes in the temperature anomaly record.
For example, the prominent El Nino peak of 1998 followed by the deep La Nina minima of 1999 and 2000 is barely noticeable in the trailing 5-year average compared to that of the usual centered 5-year mean. (Similarly for the strong stratospheric-injecting volcano events of the early 1980s and 1990s.)
A subtle, but very neat touch to further disguise the real identity of the underlying data.
-
bartverheggen at 17:45 PM on 24 September 2015Scientists Respond To Tol’s Misrepresentation Of Their Consensus Research
uncletimrob asked: Does Toll really believe what he says or is he just saying because he can?
I was wondering the same, whether he was perhaps pulling a practical joke. I asked him via twitter. His response was rather evasive, on the one hand claiming that these studies don't measure anything, but on the other hand seemingly happy to draw conclusions based on (his misrepresentations of) them. See e.g. towards the end of storify.
Prev 535 536 537 538 539 540 541 542 543 544 545 546 547 548 549 550 Next


