


 Arguments


Recent Comments
Prev 550 551 552 553 554 555 556 557 558 559 560 561 562 563 564 565 Next
Comments 27851 to 27900:
-
The Great Unknown at 02:12 AM on 24 July 2015CO2 lags temperature
Looking at the Temp and CO2 chart, the striking thing to me is the regularity of the events and the peaks. Seems hard to refute that we AREN'T just in another peak cycle. How can this be refuted when all we have is relatively miniscule time slices of human impact to compare? Empircally incompatible.
-
Jim Hunt at 01:42 AM on 24 July 2015The importance of good climate communication: a recent Arctic example
It seems that you and I have been thinking along remarkably similar lines John, except that I set the Daily Mail's official complaints procedure in motion yesterday. I received a reply from The Mail's legal eagles today:
A packet of peanuts for the first person to spot the minor arithmetical error.
-
Jim Hunt at 20:49 PM on 23 July 20152015 SkS Weekly News Roundup #30A
Regarding the new CPOM paper on CryoSat-2 Arctic sea ice volume measurements, I'm afraid I have taken exception to both the Daily Mail and the Guardian's coverage:
An Inconvenient Truth About The Mail’s Climate CoverageWhilst searching [Rachel Tilling's] paper for the word “ice” returns lots of results a search for the word “cap” returns zero results, just like “recovery”.
not to mention:
I have already lodged an official complaint about the antics of The Daily Mail’s imaginary time machine. If you would like to do as well then here is the appropriate form to fill in: -
michael sweet at 20:35 PM on 23 July 20152015 SkS Weekly News Roundup #30A
Defined here: An event or occurrence that deviates beyond what is normally expected of a situation and that would be extremely difficult to predict.
Black swans can simply be rare events or they may indicate that the system is about to shift to a new normal.
-
bozzza at 18:00 PM on 23 July 20152015 SkS Weekly News Roundup #30A
comment from the Artctic sea ice volume rebounds article:
By Bart R (Canada)
on July 21st, 2015
On the whole, I agree with Neven.It is an excellent article.
Terms like ‘recover’ however, when discussing complex systems seem inherently untrustworthy. The world’s climate is rapidly changing, and the Arctic is integral to the whole. “Recover” is as impossible as being rained on by the same raindrop twice.
More to the point, Black Swan behaviour is always a ‘recovery’ in its second phase; it’s the third phase where the system begins to seek new states.
It is as appropriate to conclude from the ‘recovery’ of 2013-2014 that the Arctic system has had its second major destabilization in under two decades, and that all bets may be off for projecting where it next lands.
While we can expect the Arctic to more frequently visit some states it had not exhibited in the past under a Chaos Theoretical framing, we can’t know properly what those will be. Hansen’s argument of shut down of the Conveyor is no less likely than an El Padre-dominated climate with temperature highs at the poles unseen in 2.4 million years.
Five years of satellite feed is not enough to draw conclusions from of the scale this article contemplates.
Does anyone know what "Black Swan Behaviour" is ?
-
bozzza at 17:42 PM on 23 July 2015Arctic sea ice has recovered
Si Senor, am doing that now!
Keenly watching the Arctic sea extent graphs dipping down toward 2 standard deviations again, however... I don't like the angle on that graphology...
Tieing the two sources together(...without having finished reading the article yet because I'm a betting man..) I am glad to be empowered by the knowledge that whilst 3 metre plus ice recovered in a big way in 2013 it fell back again in 2014.
This is exactly what I needed, thanx!!! Are we witnessing disintegration? I won't be sleeping for approximately 7 days I'm telling you now!!
-
SirCharles at 14:21 PM on 23 July 2015The oceans are warming faster than climate models predicted
I just watched a European public channel where they claimed that the current uptake of the oceans - and within the equalisation of the heating - could soon have an end and fire back. Are you aware of any studies that would be indicating this?
Sorry for being lazy now doing my own research. But nevertheless, I think this is an issue of importance concerning surface temperatures sky rocketing again (the 'hiatus' which has actually never happened).
Thanks, folks. -
ubrew12 at 08:52 AM on 23 July 20152015 SkS Weekly News Roundup #30A
Thanks for continuing this service. Don't let it overwhelm, there's plenty of information out there.
The first link to "Arctic sea ice volume rebounds, but not recovering" is not working (the second, lower link is working properly).
For anyone interested, here's this weeks listing of 'Climate Change News' by Mary Ellen Harte at Huffington Post (good source for news/links).
Moderator Response:[JH] Glitch fixed. Thank you for bringing it to our attention.
-
wili at 07:31 AM on 23 July 20152015 SkS Weekly News Roundup #30A
"I therefore now have the time to produce the Weekly News Summary."
Huray!!
-
Jonas at 07:23 AM on 23 July 20152015 SkS Weekly News Roundup #30A
Digital hugs to you and your wife! I am german and have no idea what the boob tube is (just looked it up .. I have none). I think you are right about the ABC .. But if 2 or 1 times is less work or fits better your life, that's fine too! (and 0 is fine too, because we first of all need to be sustainable privately .. it might also be a changing scheme, depending on your and your wifes time: I am happy with anything I get ..)
I found this website here, when I was deeply irritated by denial arguments on a sustainability forum, and I was very happy! Since this news roundup appeared, SkS has become my major site: I get here background science, gish gallop analysis (I never would be able to research myself), and context and news (your brilliant work) and tons of material and graphics I can link to, when needed and recently even a MOOC: digital hugs to the whole SkS team! I donate to SkS and I too (independently) recently took some decision which will enable me to donate more to SkS (and others).
-
Jonas at 22:36 PM on 22 July 20152015 SkS Weekly News Roundup #30A
Really happy to still find the News Roundup :-) ..
Your selection is simply good.Moderator Response:[JH] Thank you.
A Funny Thing Happened on the Way to the Forum...
My wife and I made a command decision to dramatically reduce the amount of time that we had been spending watching the boob tube. I therefore now have the time to produce the Weekly News Summary.
For the time being, I'll be cranking out three postings per week (A.B, and C) containing summaries/links to 10 articles each. I believe this change will be more user-friendly and timely than was the prior procees of two postings per week with 15 articles each.
-
chriskoz at 18:34 PM on 22 July 2015The oceans are warming faster than climate models predicted
John@1,
You took this from my mouth. While the isotherm migration e.g. shown nicely as PDF graph in this study, is overall about the same, even slightly slower over ocean, your study gives the examples of much bigger, in some cases dramatic changes in the entire food chain due to small crustations dying or migrating as the result of OA.
No surprises here. While ocean helps to cool down the surface temperature by absorbing signifficant amount of human CO2, the ocean ecosystems pay the double price of not only warming but also acidification. While some people, especially those who are fixated on "2 degree warming target" are happy because they can pollute a bit more because of CO2 invasion into ocean, the big picture might look even bleaker as the result of that phenomenon - dramatic distortions in the food chain.
-
Tom Curtis at 08:47 AM on 22 July 2015Ivar Giaever - Nobel Winning Physicist and Climate Pseudoscientist
What I find most interesting about Andy Robinson's screed is the claim that:
"What the climate scientist will say is that the highest probabilities (which are still often less than 1%) are that temperatures will increase and sea levels will rise, and we should make policy decisions accordingly."
(My emphasis)
There is a funny thing about probabilities. The more vague the statement, the higher the probability that it is true. Conversely, the more precise the statement, the less the probability that it is true. Indeed, the only statements for which absolutely precise statements have probabilities of 1 are those which are mathematical (or tautological) truths.
Thus, the probability that the correct answer to 2 + 2 is 4 is precisely 1. But if we seek the answer to 2 + 2 + e, where e is a normally distrubuted variable with mean (μ) = 0 and standard deviation of σ, then no matter what the value of σ, the probability that the answer is precisely 4 equals zero. That is because the probability of a given range of values for e is the area under the Probability Density Function of e, and if the area has a width of zero (ie a precise numerical value) the area is zero. This is true even though 4 is the modal value for the sum 2 + 2 + e. Conversely, as the range gets larger, the probability gets larger, regardless of the value of σ. That is because for two ranges, such that the second is larger than but includes the first, necessarilly the area under the curve of the PDF of the second equals that of the first plus the area of its range that does not overlap with the first. These properties of probabilities apply even when e has some more obscure distribution, unless (almost impossibly), the distribution consists of a finite number of singular values.
The first of these properties is almost irrelevant in science. That is because values are always quoted to a finite number of significant figures. Thus if our answer is quoted to one significant figure, the response 4 actually indicates that value lies in the range 3.5-4.5, which can have an arbitrarilly high probability depending on the value of σ. However, the second is always true. If statements are vague enough, they always have a high probability.
With these mathematical facts in mind, let us consider Robinson's claim. We can note that it is a tautology that sea level will either rise, or it will fall, or that it will stay the same. Ergo the probability that it will rise, or fall or stay the same is 1. It follows that if the probability that it will rise higher than the probability that it will fall, and/or that it will stay the same, then the probability that it will rise is equal to or greater than 1/3. That is, because of the vagueness of the claims Robinson puts in the "climate scientists" mouth, his quantification in parentheses necessarilly contradicts the statement that the "climate scientist" is supposed to indicate that a given possibility has the highest probability. Robinson in fact neatly demonstrates that he understands neither probabilities nor science; and ergo that his screed is merely a pointless diatribe.
Moderator Response:[PS] Please avoid inflammatory remarks as per comments policy.
-
jgnfld at 04:50 AM on 22 July 2015NOAA State of the Climate report: Which seven records were broken in 2014?
What you want is this:
 Moderator Response:
[DB] Reduced image width that was breaking page formatting.
-
jgnfld at 04:09 AM on 22 July 2015NOAA State of the Climate report: Which seven records were broken in 2014?
Looks to me as if the graphic placed here is mislabeled from Plate 1.1x (p. 53). The graphic there starts from 0. That is, it shows sea level rise starting with 1993 as the zero point. Baseline periods in other graphics are given in parentheses but for 1.1x the parentheses state "actual values".
Needs a labeling fix here, I think. -
psweet at 03:50 AM on 22 July 2015NOAA State of the Climate report: Which seven records were broken in 2014?
It looks like there's a problem with the sea-level graph. If I'm reading it right, then every year from 1993 on was above the 1993-2013 average? What did they use to calculate the average?
-
KR at 00:53 AM on 22 July 2015Ivar Giaever - Nobel Winning Physicist and Climate Pseudoscientist
Andy Robinson - You might want to read through the appropriate SkS thread on chaotic behavior, and learn a bit about 'boundary condition' versus 'initial value' problems, before (incorrectly) invoking some kind of chaos based uncertainty. Your comment in that regard is nonsensical - starting with your assertion that there are exactly four variables.
The probabilities of sea level rise and temperature increase are 100%, as due to our fossil fuel emissions we've already committed to increases in both. The only uncertainties are how we respond, on what rate/time scale those changes will occur, and whether we act to limit their extent.
Overall, your comment is much akin to Giaever's - great certainty, based in apparently little background understanding. There is no reason an intelligent layman can't become quite familiar with the basics of climate change - but it takes rather more than the day and a half that Giaever devoted to it before pontificating.
-
PhilippeChantreau at 23:32 PM on 21 July 2015Ivar Giaever - Nobel Winning Physicist and Climate Pseudoscientist
Andy Robinson please clarify your statement. If you are seriously arguing that the science shows the probability that oceans will rise and temperatures will increase is less than 0.01 you seriously need to do some reading.
-
Andy Robinson at 23:23 PM on 21 July 2015Ivar Giaever - Nobel Winning Physicist and Climate Pseudoscientist
This is more perpetuation of the fallacy that science is the province of professional scientists, and that without professional standing in a given speciality, one may not dispute "the experts." The experts in a field have greater standing, but that standing does not convey immunity to criticism, and it does not convey rectitude.
Part of the problem is the use of hyperbole by those who are not scientists and do not understand the science to which they refer: calling climate change "the greatest threat to humanity" for example. It is a threat, certainly, but calling it the "greatest threat" is not a quantifiably verifiable risk assessment.
The attractors of climate change models are huge, ranging from little to no impact to catastrophic impacts. Each point in that four dimensional attractor has an associated probability, and none of the probabilities are much greater than zero. And no one can ever gather enough information with enough precision to claim "we will be at this point fifty years from now." And no climate scientist would make such a claim.
What the climate scientist will say is that the highest probabilities (which are still often less than 1%) are that temperatures will increase and sea levels will rise, and we should make policy decisions accordingly.It is the pseudo-intellect who takes this kind of statement and projects on it the certainty of holy writ. I agree with Giaever to the extent that many climate change advocates are remind me of religious fanatics. They are as much an embarassment to science as deniers.
Moderator Response:[JH] Making unsubstantiated global statements is not welcome on this website.
Please note that posting comments here at SkS is a privilege, not a right. This privilege can be rescinded if the posting individual treats adherence to the Comments Policy as optional, rather than the mandatory condition of participating in this online forum.
Please take the time to review the policy and ensure future comments are in full compliance with it. Thanks for your understanding and compliance in this matter.
-
bozzza at 13:55 PM on 21 July 2015Arctic sea ice has recovered
Arctic sea-ice for July 19, 2015 seems to be taking a big dive again. Having recovered to near normal conditions I would be very interested to see if it once again goes below the 2 standard deviation level it was just over a month ago.
I am thinking of the multi-year ice/thickness of it's current state... has anyone got any ideas about the latest multi-year ice/thickness data of the arctic with links?
Moderator Response:[JH] Check out:
Arctic Sea Ice Volume Rebounds, But Not Recovering by Andrea Thompson, Climate Central, July 20, 2015
-
chriskoz at 11:22 AM on 21 July 20152015 SkS Weekly Digest #28
william@2,
To my mind it [Three Against the Wilderness by Eric Collier] is as significant book as Silent Spring by Rachel Carson, Feral by George Monbiot or Never Cry Wolf by Farley Mowatt
This is a very bold statement comparing your book to such classics. Without a single word about the book - even without an explanation of what it is about - your assertion amounts to meaningless trolling, which is not compatible with this website.
Please explain what your book is about, why in your opinion it should be valued as all time env classic and in particular how it relates to climate science or "El Nino in California". Otherwise, I conclude your comment be off topic trolling. Even in an open thread as this one, all comments should be climate science related, and ideally "Explaining climate change science & rebutting global warming misinformation" per the motto on the home page.
Moderator Response:[PS] I think this comment is needlessly hostile and perhaps a few minutes on google would have helped. The book is a classic and I guess the poster thinks that the rehabilitation of a drought-striken 1930s landscape could by applicable.
-
disigny at 08:03 AM on 21 July 2015Dutch government ordered to cut carbon emissions in landmark ruling
As a retired engineer, I find these discussions alarming on BOTH sides. Trying to convince "deniers" is not worth the effort. Regardless of the GW question, I believe it to be beyond doubt that humans do poorly when breathing a lot of smoke, period. It is said that the average Chinese life span is 5 or so years shortened because of coal, but they STILL prefer that to Peasant Life. Our energies should be directed at eliminating fossil fuel use. Carbon Caps are worse than useless; even if enforced draconically, they would not work, because the energy demands (see "Energy Density") of a modern lifestyle are FAR too great for the usual "renewables" to provide that kind of power in quantity, not even close. Whatever power sources we choose must be Cheaper than Coal, which eliminates the whole carbon cap issue. Or at least defuses it. There is such a power source available; the Thorium Liquid Fueled Reactor, (LFTR) can provide unlimited power safely . This was a secret Cold War nuclear fission airplane engine project. It was invented , demonstrated , and major issues solved, then cancelled 40 years ago, mainly because it couldn't be used to make bombs. The "Green Parties" had better get used to this idea; the Chinese have taken the US idea and are working on it right now. To describe the amount of misinformation and hysteria surrounding nuclear energy takes a lot of effort; there is a lot of pigheaded resistance. I was against nuclear power for 60 years, because of the waste issue; then I heard about Thorium which ,practically ,eliminates this problem. For a small example , people fear "Meltdowns". But the Thorium plant has NO fuel rods, and no meltdowns. There is plenty more. It is not widely appreciated that the Health Radiation Damage (LNT)standard is simply medical quakery; actually , a small dose of radiation is good for you in the same way that smallpox vaccinations are. It makes one wonder whether political solutions are even possible in our poorly educated world.
Moderator Response:[PS] Given the heat generated by nuclear power discussions, we strongly discourage discussion of nuclear power on general threads. Derailing a comment thread with offtopic discussion will result in immediate removal of comments. BraveNewClimate is a better forum for such discussions.
Also, disigny, welcome to Skeptical Science but please make yourself aware of the comments policy operating on this site. Especially note the prohibition on sloganeering. If you wish to make assertions in support of your argument (you make many in your comment), then you must back them with data/references preferrably in the peer-reviewed literature. Also note the requirement for comments to be on topic. Use the search function to find a suitable thread.
-
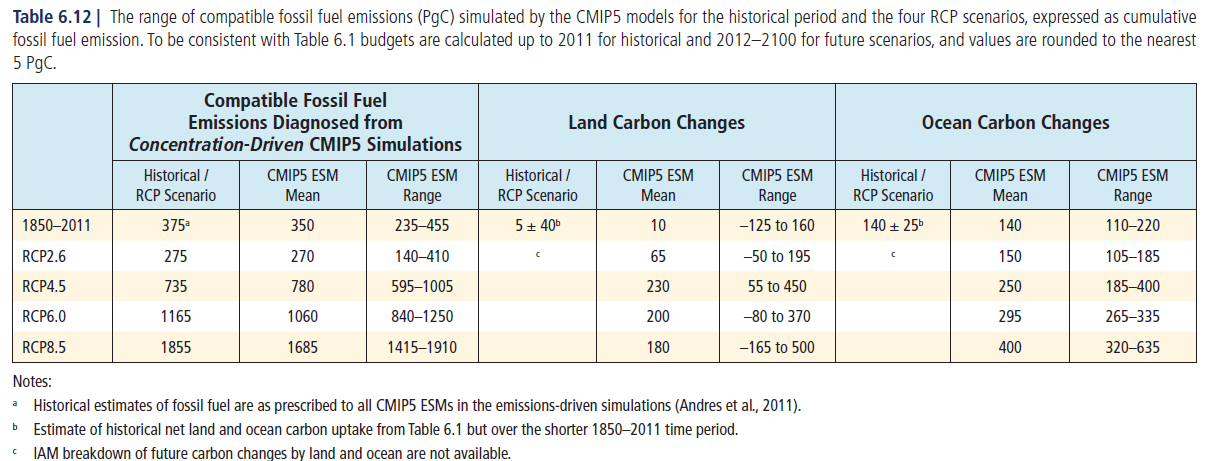
Andy Skuce at 07:32 AM on 21 July 2015Are we overestimating our global carbon budget?
jja, there is definitely lots of uncertainty in the carbon cycle models, as you can see in these plots from Wieder et al 2015 See also my SkS articles on carbon cycle feedbacks and permafost feedbacks.

The emissions in two extreme RCP scenarios vary a lot also: with the mean emissions for RCP 2.6 and 8.5 being 270 and 1685 billion tonnes of C respectively, a bigger variation in absoulte terms than within the carbon cycle models. The following table is from Chapter 6 of AR5 WG. Full size here
-
John Hartz at 07:12 AM on 21 July 2015The oceans are warming faster than climate models predicted
The warming of the Earth's ocean system is having multiple impacts on the planet's biosystem. For example...
The researchers also compared phytoplankton’s response not only to ocean acidification, but also to other projected drivers of climate change, such as warming temperatures and lower nutrient supplies. For instance, the team used a numerical model to see how phytoplankton as a whole will migrate significantly, with most populations shifting toward the poles as the planet warms. Based on global simulations, however, they found the most dramatic effects stemmed from ocean acidification.
Ocean acidification may cause dramatic changes to phytoplankton by Jennifer Chu, MIT News Office, July 20, 2015
-
Tom Curtis at 07:08 AM on 21 July 2015Climate pledge puts China on course to peak emissions as early as 2027
CBDunkerson @6, sorry, I missed the individual year thing. Looking closer I notice that the figures I linked to come from CDIAC, and includes fossil fuel and cement figures only. The more comprehensive EDGAR estimates also include LUC, and extend to 2013. They still show Chinese per capita emissions as less than half those of the US in 2013. Projecting the trends from all data points, Chinese per capita emissions will surpass US per capita emissions around 2035, but around 2020 if we only project the trend since 2010.
More interestingly, assuming China meets its 2030 emissions intensity commitment, and assuming growth at 7% per annum over the interem, Chinese per capita emissions will grow by 90% by 2030, reaching approximately 13 tonnes per capita per annum. If the US meets its commitments, linearly extended to 2030, their per capita emissions will be about 11 tonnes per capita per annum. As both have similar population growth rates (0.5% pre annum for China; 0.6% per annum for the US), if China had historically emitted at Western levels, its commitment would be inline with that of the US. Given the Kyoto formula of early commitments by the developed nations with less developed nations coming into line with developed nation commitments as their economies mature, we would have to judge China's commitment as equivalent to that of the US. I am sure that is how the Chinese government views it - as a commitment to balance economic growth while matching US commitment on climate action (and never reaching the peaks of US excess on per capita fossil fuel emissions, or as they phrase it, in terms of emissions intensity).
Unfortunately neither commitment is adequate. Further, you will never persuade China that it must reduce its emissions to circa 50% of 1990 levels by 2030 as is required if we are to avoid the 2 C target while developed nations commit to no more. Everybody is able to identify injustice when they are on the loosing side; and China is powerful enough that it cannot have injustice forced upon it.
The advantage of a per capita commitment - prefferably a per capita quota on emissons over the next 35 years - is that it is transparently an attempt at a just formulation. (Arguably a per capita quota since 1850 would be juster, though harder to formulate, but the West, and certainly the US would never accept it.) Should the West switch to that formulation in determining its own targets, there is every chance that they would persuade China to join them on that basis. They would certainly be able to persuade the rest of the world to do so.
-
jja at 05:54 AM on 21 July 2015Are we overestimating our global carbon budget?
There is as much variation between the carbon system feedback models as there is between the RCP 2.6 and RCP 8.5 emission scenarios.
-
CBDunkerson at 05:16 AM on 21 July 2015Climate pledge puts China on course to peak emissions as early as 2027
Tom, that '2010-2014' link on the World Bank page opens up data for 2010 & 2011. Presumably they plan to add 2012-14 at some point, but the values you cited were not for 2014 or averages over the whole time period, but rather the numbers specifically for 2011. Since then US emissions per capita have dropped below Australia's and China's have grown to exceed the EU. Yes, the US is still very high... but not the worst / "biggest polluter" either per capita or current emissions.
As to per capita emissions being "the only just way" to look at emissions... maybe so, but looking at countries is the practical way to address the problem. Individual citizens of any country (i.e. per capita) aren't going to solve this problem. Their governments need to do so... and therefore China, the US, and the EU are the three governments that can do the most about GHG emissions. Whether it is 'just' that they do so is a separate issue.
-
One Planet Only Forever at 00:47 AM on 21 July 2015Climate pledge puts China on course to peak emissions as early as 2027
To further clarify my comment @4 and tie it in to the point Tom Curtis makes about per-capita being the key way of looking at this issue, the wealthy powerful trouble-makers I am referring to are clearly the people who 'per-capita' are causing the most negaive impact.
This group will 'lose wealth' due to the rapid changes of what is required and allowed to happen globally. Their efforts to fight against such loses are understandable. But they clearly are undeserving of their power and undeserving of the perceptions of personal wealth measured in the current fatally-flawed global economic game.
Reducing the number of the highest negative impacting individuals is the required global action, and those highest negative impacting people know it and will fight against it becoming the reality on this amazing planet (their lifetime is the only period of time they care about, with many of them pursuing shorter term benefit even if it may produce a negative consequence for them in their lifetime - as the global financiers did as they marched things towards the 2008 collapse).
-
One Planet Only Forever at 00:16 AM on 21 July 2015Climate pledge puts China on course to peak emissions as early as 2027
CBDunkerson,
Your comment is a little confusing.
Reviewing the following presentation of the history of national CO2 emissions it appears that the only measure where the US is not a bigger polluter than China is in the 'recent rate of emissions' category.
And the per-capita emissions presented by the World Bank clearly indicate China is a long way from exceeding the US per-capita rates.
And I do not accept any claim that focuses on 'one or a few nations to blame'.
I prefer to focus on restricting the actions of the group of wealthy and powerful people who try to get as wealthy and powerful as possible through activity they could understand was damaging and would not develop a lasting better future for everyone.
Those unacceptable people exist in China. They also exist outside China and are invested in benefiting from the unacceptable things that happen in China.
These people are the real problem. They will deliberately pursue and promote damaging activity that a declining number of people can benefit from as the non-renewable resources consumed by their pursuit of profit and benefit are diminished.
Those powerful wealthy people have a long history of trying to hide of make excuses for the unacceptable opportunities they want to benefit from. They have even manipulated governments to get the type of leadership they want, including a history of assassinations and government overthrows and even the starting of multinational wars in the hopes of benefiting. (Noam Chomsky and Naomi Klein are among the many who have clearly presented details of the long history of damaging actions by this group of trouble-makers).
So the required action is the shutting down of the unacceptable pursuits of this group of trouble-makers. The worst of the group are very unlikely to willingly change their minds. They will need to be forced to change their minds and behave more considerately, less competitively. And any of that group that persist in fighting against the developed better understanding of how to behave need to be kept from having any significant influence on the global rules of the game and its monitoring.
Those trouble-makers are identifiable. Ultimately, they need to be excluded from having any influence at important global meetings such as the Paris talks later this year. Having to obtain 'consensus' about what needs to be done with those types of people is clearly a waste of time, which is what those type of people want the Paris meeting to be.
-
Tom Curtis at 00:01 AM on 21 July 2015Climate pledge puts China on course to peak emissions as early as 2027
CBDunkerson @2, here is the breakdown of the 12 nations with the highest per capita emissions, as of 2010-2014:
- Qatar 43.9
- Trinidad and Tobago 37.2
- Kuwait 29.1
- Brunei Darussalam 24
- Aruba 23.9
- Oman 21.4
- Luxembourg 20.9
- United Arab Emirates 20
- Saudi Arabia 18.7
- Bahrain 18.1
- United States 17
- Australia 16.5
With the exception of Luxembourg, all nations ranked higher than the US have economies dominated by the supply of fossil fuels.
China, with emissions 6.7 metric tonnes per capita, ranks 47th in the world and emits just 40% of US emissions per capita. It also performs better than most European nations, including Denmark, Germany and the UK, although some (including Sweden and France) do better. The European Union as a whole emists 7.1 metric tonnes per capita (2011 figures), so China continues to perform better then the EU.
This is important in that the only just way to view emissions is on a per capita basis. Expecting third world nations to allow past high emissions by the West to be a warrant for continuing high per capita emissions by the West is unjust. It is also guarentteed to fail as a negotiating strategy. Given this, the fact that the US doesn't top Qatar in per capita emissions is a distraction. The most we can demand of China is that they not exceed our per capita emissions; which there is no indication that they will do.
Of course, if, as the West should, we start counting emissions targets in per capita terms, we might then reasonably expect China to do more as it now exceeds world per capita emissions (5 metric tonnes per capita). However, I see no haste by first world negotiators to make that transition. They seem more concerned with cementing in past economic advantages rather than solving the problem of AGW.
-
CBDunkerson at 21:33 PM on 20 July 2015Climate pledge puts China on course to peak emissions as early as 2027
longjohn119, examine those factors (i.e. current emissions, per capita emissions, longest emissions period) and you will find that the US is not the "biggest polluter" under any of them. You'd have to go with something like 'total accumulated emissions'... and even there China will pass the US.
Right now, China is the single country which can do the most to reduce global warming. If they got down to zero emissions the world would be about a quarter of the way there. The US & EU combined gets us a little over another quarter. The remaining half is unfortunately spread throughout the world in small slices that will each need to be solved individually... but three governments could deal with half the problem and China is far and away the most important of those. Especially as it is the only one of the big three where emissions are still increasing.
-
william5331 at 20:40 PM on 20 July 20152015 SkS Weekly Digest #28
El Nino effecting California? Could be. They could do something about it. Get a book called Three Against the Wilderness by Eric Collier. It describes at least a partial solution for California. To my mind it is as significant book as Silent Spring by Rachel Carson, Feral by George Monbiot or Never Cry Wolf by Farley Mowatt. It is too late for this El Nino but with an effort it could mitigate the effects of the next one and more and more as the years go by.
-
John Hartz at 04:59 AM on 20 July 2015Dutch government ordered to cut carbon emissions in landmark ruling
wideEyedPupil:
If I interperet the National Reports webpage of the Framework Convention on Climate Change correctly, there are two sets of reporting requirements. One set, more sophisticated than the other, is for developed countries. The other set is for developing countries.
-
wideEyedPupil at 04:48 AM on 20 July 2015Dutch government ordered to cut carbon emissions in landmark ruling
Offically the GHG emissions from the Land Use and Forestary sector in 2013 was 7,522.25 Gg in a total of 549,445.84 Gg or 1.4%. Compare that with BZE's 55% 20 yr GWP or ~45% 100 yr GWP and there is some serious under estimating going on. frankly I don't understand why it's not a national scandel — perhaps there's too many sacred cows lined up down that path of enquiry?
-
wideEyedPupil at 04:38 AM on 20 July 2015Dutch government ordered to cut carbon emissions in landmark ruling
@peter prewett and John Hartz note that while all countries use the same methodology that doesn't ensure accuracy in and of itself. for instance the Zero Carbon Australia Land Use Report published by BZE and MSSI found that using 20 yr GWP GHG emissions accounting Australia's land use sector accounts for 55% of national emissions. Using 100 yr GWP is was in the 40-50% range (dont recall exactly but it will soon be 50% using 100 yr GWP) which obcures the impact of methane, the shortest of the IPCC 'long-term GHGs', because it's half-life in the atmosphere is only 6-7 years.
so Australia due mainly to enteric fermentation, savana burning and land clearing (including repeated landclearing) is under reporting it's land use emissions heavily. there are similarly unaccounted for emissions in the industrial sector like for eg. air transport.
-
wideEyedPupil at 04:29 AM on 20 July 2015Dutch government ordered to cut carbon emissions in landmark ruling
@ Tom Curtis. Of course the BAU estimates almost certainly would have relied on dubious projections by AEMO on electrical demand and BREE on mining activity. AEMO continued to predict increased demand for years after 2011/12 when demand started falling main due to increased EE and addition of rooftopPV. BREE mining projections are ludicrious, see the BZE report key findings and DL it at bze website.
-
Paul Pukite at 02:49 AM on 20 July 2015Models are unreliable
"While models appear to capture ENSO behaviors, there is no way they can predict it. "
We may be getting close to doing just that at the Azimuth Project forum — http://forum.azimuthproject.org/discussion/1608/enso-revisit#latest
Others are making progress as well [1].
[1] H. Astudillo, R. Abarca-del-Rio, and F. Borotto, Long-term non-linear predictability of ENSO events over the 20th century, arXiv preprint arXiv:1506.04066, 2015.
-
One Planet Only Forever at 01:02 AM on 20 July 2015Dutch government ordered to cut carbon emissions in landmark ruling
To clarify my comments regarding Global Conservatives. I am referring to the attitude and actions of the groups, not the label they hide behind. The Liberal Party of Australia is clearly the type of group I refer to as being part of the Global Conservative Movement.
The actions and attitudes of this group are the desire to benefit from action plans that can be understaood to be unsustainable and unacceptable. This group cares about their benefit in their lifetime more than any other consideration. IN fact most of them focus on gather personal benefit as quickly as possible any way they can get away with. THey have no interest in participating in development toward a lasting better future for everyone. The requirements for that type of development would not provide them the freedom to benefit from knowingly behaving unacceptably.
Their choice to prioritize maximizing their personal benefit leads them to willingly try to do things that can be clearly understood to be damaging. They willingly pursue control to ensure that a few like them get to benefit the most from getting away with unacceptable actions.
That has been their fossil fuel gambit. Lots of people have developed a desire to support efforts to get away with the clearly unacceptable pursuits. And they will even support a group that offers an 'impression' of personal benefit even if the reality will be that only a few, excluding them, will significantly benefit from the unacceptable activity.
And in addition to not caring about the life circumstances faced by others, none of that group care about the future. They do not even care that fewer and fewer of their type of people will be able to continue living the way they try to get away with.
-
mancan18 at 23:51 PM on 19 July 2015Dutch government ordered to cut carbon emissions in landmark ruling
Tom Curtis
Thanks for your responses and the links you have pointed me to. I do have a clearer understanding of what is supposed to be meant by "emissions intensity".
However, I notice the first paper you pointed me to, "Australia's Abatement Task and 2013 Emissions Projection", was dated 2013. This means that it would have been likely to have been prepared on the basis of the policy stance of the previous Labor Government, as the LNP Government wasn't elected till the latter part of 2013. The Labor Goverenment did have an ETS policy, and acting on Climate Change is a central part of the party's platform. So that report is likely to been a hangover from Labor's time in power. The second paper, "Emission's Reduction Fund White Paper" was dated April 2014 and prepared by Greg Hunt, Australia's Minister for the Environment. Now, although Greg Hunt is a LNP Minister, he does understand that Climate Change and Global Warming is real, and in the past did advocate and support the idea of using an ETS to act on reducing emissions. However, he has since changed his tune to be more in line with the LNP's current token reduction Direct Action Policy because he has faced significant opposition from the Climate Change denier/skeptics and an anti-ETS members in his own party. This is the political reality he has to deal with. Also, from this second paper, the observed reductions in emissions from 1990 levels outlined, seem to have come mostly from using gas to replace coal for electricity power generation. While there is also a small percentage change to generating power power from renewables, and there has been a slight per capita reduction in demand, there does not appear to be any plans for retiring the dirty brown coal burning power plants in the Latrobe Valley in Victoria. Also, considering that the LNP have now appointed a Minister for Wind Turbines to investigate the health impact of wind turbines; that the Prime Minister Tony Abbott and the Treasurer, Joe Hockey,have both expressed their displeasure at seeing wind farms while having no problem with the great gouges out the landscape due to open cut coal mines; and the fact that the Clean Energy Finance Corporation has been given instructions by the LNP Government not to make further investments in wind turbine generation projects and household solar, while somehow doubling the Clean Energy Finance Corporation's profitability; I don't think their 5% reduction target is realistic. It may occur incidentally due to the same forces that saw the decrease in emissions from 1990 as outlined in Greg Hunt's Emission's Reduction Fund White Paper, but it is not likely to occur due to any positive action from the LNP Government. Since the abolition of the previous Government's Carbon Tax/ETS scheme by the LNP, emissions in Australia appear to be increasing again. Also, I'm not sure whether Australia's emissions measurements are all home grown or include the emissions that are created from the exports of Australian Coal.
However, I'm only a lay observer of these political machinations which has made me rather cynical. I do hope the Dutch judicial decision does ultimately have an international impact because I don't see the current Australian Government changing its stance until there is a change in Government or a significant impact upon the Australian economy due to international boycotts and a significant reduction in the demand for Australian fossil fuel exports.
-
Tom Curtis at 22:07 PM on 19 July 2015Dutch government ordered to cut carbon emissions in landmark ruling
mancan18 @10, here is the chart showing the current emissions reduction target against projected BAU emissions from the Dept of Foreign Affairs and Trade, but first published by the Department of Environment (first link of my preceding post):

"Abatement task is measured in million tonnes of carbon dioxide equivalent (Mt CO2-e). Source: Department of the Environment (2014); Australia's Abatement Task and 2013 Emissions Projections, p.3"
As you can see it shows a straight forward 5% reduction from 2000 levels as the target. That in turn is approximately a 4% reduction from 1990 levels. Given these very explicit, publicly available, and official commitments, the L/NP coallition cannot plausibly pretend their targets is only a reduction in emissions intensity (however defined).
I agree that just because they promised to reach that target does not mean they intend to do so. Since the election of John Howard in 1996, it has been standard tactics by the Liberal party to espouse a set of promises that, upon achieving government they discover a crisis that prevents them from doing so, and requires them to revert to what more cynical observers thought to be their intended policy all along. In 1996 John Howard distinguished between those promises he intended to keep, and those he evidently never intended to keep as core and non-core promises (terms carefully not mentioned before the election). The current L/NP policy is certainly consistent with their 5% target being a non-core promise, ie, a promise made solely for the purposes of election, and not with any intention of being kept. But on paper, however, the policy is for a 5% reduction in emissions, not emissions intensity.
-
mancan18 at 20:17 PM on 19 July 2015Dutch government ordered to cut carbon emissions in landmark ruling
Tom Curtis and One Planet Only Forever
I may have misrepresented the normal meaning of "emissions intensity" relating to its "emissions compared to GDP" meaning.
However, I do not have faith that the current LNP Australian Government will necessarily interpret it in its normal context but more in a context related to the rate of increasing emissions. They, along with their usual spin in the Murdoch press, are just as likely to use this meaning to say they have reduced emissions by 5% by 2020, even though they may not have. Because of all their recent actions, like their attack on the various Climate Change Advisory bodies; their desire to reduce the Renewable Energy Target (RET) which is related to the mix between renewable versus fossil fuel power generation; their desire to nobble of the Clean Energy Finance Corporation whose task is to ensure that financing renewable eneregy projects is more doable and stable; there steadfast opposition to anything related to an ETS with their simplistic anti-Carbon Tax message in relation to it; their lack of any real financial commitment to their Direct Action Program to reduce emissions by 5%; and their keeness to approve huge coal export projects, some even threatening the Barrier Reef; all indicate that this Government is unlikely to meet even the insignificant 5% emissions reduction target that they have set. It will be interesting, but tragic, to see the spin surrounding their failure and what targets they will actually set post 2020. I will be very surprised if anything of substance actually happens. It will be more of the same "of them saying one thing but doing something else".
Tom as for the meaning of LNP in Australia. It is true there is a combined LNP Party that has been in Government of Queensland and is now in Opposition. However, federally, LNP means the Liberal National Party Coalition. The Liberal and National Party are separate parties but they govern in Coalition. Traditionally when the LNP are in power federally, the Prime Minister comes from the Liberals (who are really conservatives/neocons) and the Deputy Prime Minister comes from the Nationals (who supposedly represent areas, mostly agricultural, outside the main metropolitan areas). Both Parties, Liberal and National, have a significant number of members who are Climate Change denier/skeptics and the advisory bodies that formulate their policy also have a significant denier/skeptical slant.
I may be pessimistic, but I don't have any faith that the current Australia Government will contribute anything of substance in Paris. I also expect that the current Australia Government will try to run interference for achieving a substantial binding agreement. If the actions of the Australian Government are any indication, then all I am expecting is a break down of negotiations in Paris with no binding agreement, and then the Murdoch press madly spinning the outcome while ignoring the actual situation. However, I am prepared to be pleasantly surprised. Not likely though.
-
longjohn119 at 18:32 PM on 19 July 2015Climate pledge puts China on course to peak emissions as early as 2027
We call China the biggest polluter yet the US leads China by 300% in per capita CO2 production, and per capita hydrocarbon use.
And a 60-70 years polluting Head Start
-
One Planet Only Forever at 15:31 PM on 19 July 2015Dutch government ordered to cut carbon emissions in landmark ruling
mancan18,
I am inclined to expect that Tom Curtis is correct about the emissions intensity being related to GDP.
The same claim about emissions intensity being a 'legitimate' measure of action has been pushed by the current Conservative leaders of Canada.
The Canadian Conservatives, like the Conservatives in the US and Australia and the UK, have a clear history of deliberately trying to beneft as much as possible from the burning of fossil fuels (and many other unacceptable popular and profitable activities), typically by preying on the easy popularity and profitability of the activities they understand are unacceptable.
And the Conservative leaders of Canada also cannot be trusted to honour their claims. Their commitment to a 17% reduction from 2005 levels by 2020 was not only a weak commitment compared to other nations, the Conservatives have done nothing to meaningfully reduce Canada's emissions. And the projections are clear that Canada will not even meet the weak 17% reduction (actually a commitment to only be 8% above 1990 levels by 2020 - and above is not a typo) Globe and Mail report. In addition, Canada under Conservative leadership has reduced regulations and restrictions related to the pursuits of profit from exporting of fossil fuels for burning, an action that fuels the global problem without being accounted against Canada. And they did it with measures buried in Omnibus Budget Bills (one of many Reports here).
And the unacceptable actors hiding behind the Conservative Movement label have been a global problem for a while now. This global group of 'pursuers of what they want any way they can get away with' have been conspiring together on a variety of action plans for a long time. In 2003, while leading the Opposition in Canada, Canada's current Conservative leader Harper gave a speech about Iraq that paraphrased Austarlia PM John Howard's speech (CBC report), and we all know how well that action plan turned out.
-
Tom Curtis at 13:34 PM on 19 July 2015The Skeptical Science temperature trend calculator
s_gordon_b @83, I would speculate that the temperature indices have been split into those that include an land/ocean index but do not give full global coverage, mostly due to missing polar regions (land/ocean), and those that use various statistical methods to extend the data set to cover all points on the Earth's surface (global). I would also speculate that Karl consists of the NOAA data set updated for the new ocean dataset as specified in Karl (2015), which would suggest that NOAA represents the unupdated data set, even though the latest version of NOAA does include the update SFAIK. On this understanding, NOAA would relate to Karl the way that HadCRUT3 relates to HadCRUT4.
-
Tom Curtis at 13:22 PM on 19 July 2015Dutch government ordered to cut carbon emissions in landmark ruling
mancan18 @7, two quibbles, and a query:
1) You say:
"However, "a 5% reduction in emissions intensity" does not mean that. It means that the increase in emissions will be 5% less than the rate that emissions were increasing in the early 2000s."
Emmissions intensity can be defined various ways, but is most commonly defined in terms of GDP. Thus, if you reduce your emissions per unit GDP by 5%, you have reduced your emissions intensity by 5%. Given this, the only way to reduce emissions 5% of 2000 levels in 2020 if you do not reduce emissions intensity by more than 5% is to ensure the economy does not grow, or (as it has already grown from 2000 levels) to ensure that it shrinks back to 2000 levels - a very painful correction indeed. However, the rate of increase in emissions will only be 5% less with a 5% reduction in emissions intensity if the rate of increase in GDP is constant. Given the effect of the global financial crisis and it aftermath (still being felt in Greece, and hence the world), that would be a small ambition for government.
2) The LNP is the party unique to Queensland formed by the amalgamation of the Liberal Party and the National Party. In the Northern Territory, a similar amalgamation is called the Country Liberal Party. Federally, however, and in the rest of Australia, the two parties remain unamlgamated and in coallition. The coalition might by reffered to as the L/NP coallition (or just "the coallition"), but internal politics play out quite differently between the amalgamated version in Qld, and the coalition version nationally, so the two should be distinguished.
Final and most crucially, the query. Do you have a source for the coallition's target being just a 5% reduction in emissions intensity? The government documents I have seen have been quite explicit that it is a 5% reduction in emission levels. Further, as the emissions intensity of the Australian economy has fallen by 50% from 1990 levels as of 2014, and about 28% of 2000 levels already, a 5% intensity target would amount to a policy of massively increasing emission intensity and levels from current levels. I am sure that Labor and the Greens would be making considerable hay if such a target was mentioned in L/NP documents.
-
mancan18 at 11:17 AM on 19 July 2015Dutch government ordered to cut carbon emissions in landmark ruling
@1 and 2 One Planet Only Forever
When considering Australia, one needs to be careful when referring to the actual emission reduction commitments that the current Liberal National Party (LNP) controlled Australian Government makes.
First, the LNP has quite a number of Climate Change deniers as sitting members.
Second, the LNP gets a lot of its advice from people who are Climate Change deniers.
Third, the current Prime Minister, Tony Abbott, became leader of the LNP because of his opposition to taking any effective action on Climate Change. He, along with the Greens, torpedeoed the proposed ETS scheme, which had previously been agreed upon by both sides, LNP and Labor.
Fourth, the main reason that this anti-climate change rhetoric became accepted in the Australian electorate was that the Murdoch media, along with the right wing shock jocks, reaches about 83% of the Australian population to spread the usual denier disinformation, without any substantial penetration of the full scientific argument. Despite this, a substantial number of Australians do think climate change is a serious issue and action needs to be taken. As a consequence of this, there is now a Direct Action Policy that is a salve to the concerns of people looking for Climate Change action. The trouble with this is that the LNP Government can now spin that they think climate change is of concern and that they are now acting to reduce emissions by 5%; even though they have only allocated 2.25 billion dollars, less that half the cost of a decent oil platform, to pay emitters to reduce emissions, without any penalty if they don't, and something they should be doing anyway. The policy is a crock.
Fifth, The target of reducing emissions by 5% is also a crock. When you read the LNP literature related to their commitments on Climate Change and listen to the LNP Party members commenting on what they are doing, you hear two phrases: "reducing emissions by 5%" and "reducing emissions intensity by 5%". In the Murdoch dominated Australian media, which is biased towards the LNP at the best of times, the terms get blurred depending upon the spin needed at the time. "Reducing emissions by 5%" is a pretty clear cut, though totally inadequate, benchmark. It means total emissions will be 5% less in 2020 than they were in the early 2000s. However, "a 5% reduction in emissions intensity" does not mean that. It means that the increase in emissions will be 5% less than the rate that emissions were increasing in the early 2000s. Which is a totally different thing. It means that in 2020, emissions in Australia will still be increasing but at 5% less than they were increasing in the early 2000s. It is not a 5% reduction in emissions. It means that emissions will still higher than they were in the early 2000s and will still increasing, only at a lesser rate. It is double speak used to confuse, and due to the Murdoch dominated media, what the current Australian Government says is never put under scrutiny, so it can still say they are acting while doing nothing substantial. In Australia, there are too many vested interests so that no significant commitment will be made. If history is anything to go by, the then LNP Federal Government could not even sign the flawed but precedent achieving Kyoto Agreement in 1997, which actually allowed Australia to increase it's emissions by 8% over 1990 levels. If they had signed, then it would have sent a clear message to emitters and Australia would now be a different place with a more sustainable economy.
So be very careful of any commitments that this current Australian Government makes. Don't expect anything significant and anything they agree to may well be based on it's usual double speak of apparently saying one thing while meaning another.
-
bjchip at 10:20 AM on 19 July 2015The Skeptical Science temperature trend calculator
Looks like the UAH numbers aren't following their revised corrections for diurnal drift... nor the ones made by Po-Chedley.
http://journals.ametsoc.org/doi/abs/10.1175/JCLI-D-13-00767.1
I use the trend calc an awful lot. Hopefully it can get updated again. I think its going to be an ongoing project as methods improve.
Perhaps you'd want two versions of the Satellite information ? Can you persuade Po-Chedley et.al. to rework the satellite data regularly?
Thanks
BJ
Moderator Response:[PS] Link activated. Please use the link tool in the comment editor in future.
-
s_gordon_b at 09:55 AM on 19 July 2015The Skeptical Science temperature trend calculator
I use the trend calculator all the time for personal research, blogging, challenging dopes and dupes in the denialsphere... It's an invaluable tool, but since your latest update I no longer have a grasp of all the data categories. For example, what's the difference between "land/ocean" and "global"? And who is "Karl," with or without "krig"? I would really appreciate it if you would consider adding a legend to the page to remove any ambiguity/uncertainty.
-
Jim Hunt at 02:14 AM on 19 July 2015Dutch government ordered to cut carbon emissions in landmark ruling
Paul D @4 - You left out "imposed a climate levy on renewable generation". If you're a UK citizen and feel strongly about such matters you may wish to follow my example and give your Member of Parliament a piece of your mind? See for example:
http://www.V2G.co.uk/2015/07/an-open-letter-to-mel-stride-george-osborne-david-cameron-et-al/
not to mention:
https://twitter.com/jim_hunt/status/622329856924229632
et seq.
As Lord Deben recently put it:If everybody here made sure that they went to their Member of Parliament between now and August 1st that would make a hugely important impact at this point.
-
michael sweet at 00:41 AM on 19 July 2015Global warming is causing rain to melt the Greenland ice sheet
Ranyl,
My computer used to have the same issue you have. At the same time I used another computer and it did not have the problem so I concluded it was something in my computer. The issue went away when I updated the operating system.
Prev 550 551 552 553 554 555 556 557 558 559 560 561 562 563 564 565 Next


