


 Arguments


Recent Comments
Prev 563 564 565 566 567 568 569 570 571 572 573 574 575 576 577 578 Next
Comments 28501 to 28550:
-
Evan Jones at 23:55 PM on 3 July 2015Watts' New Paper - Analysis and Critique
1999-2008 is too short a time to obtain significant differences with a truncated data set without strong statistical analysis. Eyeballing a graph does not count. You will be strongly criticized for too short a period of time.
We do that strong statistical analysis. The divergene shows in our subsets as well as in our full sets. Actually, the graphs look much the same — until you drop in the trendlines. That is because the divergence is gradual over time, not a result of jumps in the data.
We use the intervals available to us (reasons in pervious comment). I can answer criticisms regarding not using a longer set.
-
Evan Jones at 23:50 PM on 3 July 2015Watts' New Paper - Analysis and Critique
Someone will check to see if the data changes with the full record. You are open to accusations of cherry picking.
True. (We welcome that.) Note, however, that we are not directly measuring global warming. We are only addressing the effect of heat sink on sensors. A 30-year intervaal is necessary for assessment of global trend, yes. But when we use the 1999-2008 series, we are not saying that implies that we are not warming overall or that there is actually global cooling. We use that interval to only to demonstrate the spurious cooling effect of poor microsite during a cooling period.
Differences are expected in small data sets (like yours) due to random variation, you are responsible for showing the changes are statisticly different (generally two sigma).
Well, J-NG has run a preliminary set of Monte Carlos and for our full set he shows chance of overlap at 0.00000% between the Class 1\2s compared with both Class 3\4\5, and the fully adjusted data for all classes. So our results appear to be robust.
-
Evan Jones at 23:36 PM on 3 July 2015Watts' New Paper - Analysis and Critique
Your time period of analysis (1979-2008) is unusual. Why do you truncate the data at 2008 when it is readily available to 2014. (Matching old data analysis is not a good excuse, they previously did not have the additional data).
We have a number of reasons.
We require a period of unequivocal waming. We need to do that in order to demonstrate what occurs during warming (or during the 1999-2008 interval, cooling). For the HSE hypothesis to be consistent, it has to work both ways.
For my money, I'd have prefered 1977-2006, as this excludes the 1998-1999 drop. But we wanted to match with the onset of satellite data, and we wanted a 30-year interval for our main series. (We do include a 20-year set from 1979-1998 to show a warming-only interval.)
The recent data (to 2014) is flat, and therefore not as (directly) useful to our purposes. There will be little or no trend divergence between well and poorly sited stations during a flat period. (We do compare the wonderfully well sited CRN with COOP from 2005-2014 to demonstrate this non-effect.)
We needed to find an interval of warming and cooling where there was a sufficient number of eligible (unperturbed) stations) and sufficient metadata. 1920 - 1950 would have done just as well but for the lack of metadata.
The 1979-2008 period was the only stretch that had both warming and sufficient metadata. And the (short) 1999-2008 period was the only interval of definite cooling when the required metadata is available. We were lucky to come up with even that much.
In short, for the period when there was warming, the welll sited stations warmed less. For the interval of cooling, the well sited stations cooled less. And for the flat trend after, there is no divergence. All of which is consistent with the HSE hypothesis. It appears from the data that we are solid three ways from Sunday.
-
Evan Jones at 23:17 PM on 3 July 2015Watts' New Paper - Analysis and Critique
BEST's analysis is similar: they separate stations into two records when they detect a change. BEST matches NOAA. You will have to show why your approach is better.
BEST coincides well with Fall (2011). But both of those studies use the obsolete Leroy (1999) rating system, whixh accounts for distance-to-sink only. We use the upgunned Leroy (2010), whxich includes the area covered by the heat sink as well as the distance. We had a joke back in the Fall (2011) days that all Class 4s are equal, but some Class 4s are more equal than others. Leroy (2010) resolves this .
Fortunately for us, we are dealing with the data- and metadata-rich USHCN. That allows us to avoid the can-'o-worms of trend-splitting: We merely drop those staions that would require a split. The number remaining is more than sufficient to demonstrate statistical significance at the 95% confidence level.
Mosh and Zeke have no such luxury. They can't drop those. USHCN is dense and rich. Outer Mongolia, not so much.When BEST makes a split, they are doing pairwise with stations with artificially high trends. That will tend to skew their results. This can be corrected by using only unperturbed Class 1\2s for pairwise adjustment. It will be interesting to see the results of BEST applied to our "unperturbed" set using Leroy (2010) parameters.
In short, our method (dropping) is "better", but Mosh is doing the best he can with what he has. He can't drop. We can and do. In future, I will be looking at methods for adjustments for perturbed stations based on the empirical results of this study. Only after all such adjustments are made will pairwise (including homogenization) yield valid results. -
Evan Jones at 22:56 PM on 3 July 2015Watts' New Paper - Analysis and Critique
Not by any definition of "heat sink" that I'm familiar with. I sincerely hope you have properly defined the terms you are using.
I think we have. We use the term to distinguish it from waste heat. A heat sink absorbs and re-emits heat. Even the normal environment is a bit of a heat sink, which is why Tmax occurs hours after the maximum solar input. Excess heat sink (such as a paved road) in close proximity to the sensor increases this effect.
-
Evan Jones at 22:48 PM on 3 July 2015Watts' New Paper - Analysis and Critique
Your listed changes all seem to be by deleting stations from your analysis. Since you have a small sample to start with (and are using only US staions 4% of the globe) you will have to show that you have not deleted all your signal from the data (or added false signal through deletion of other data). You will have to be careful to avoid charges of cherry pickig. It is possible to obtain a graph you want by trying enough combinations of data until you get the one you want, especially with a small, noisy data set.
Quite correct. Indeed we will have to demonstrate that. In order to avoid cherrypicking, we use many graphs with many combinations and binnings and show them all. All of them show Class 3\4\5 stations warming faster than cooling stations. (This shows up in the regional data as welll as nationally.)We also show the data for the stations we dropped so as to deflect suggestions of cherrypicking. The dropped stations (both compliant and non-compliant) show substantially less warming than the ones we retained.
I put all the data up on a series of excel sheets to be used as a maleable tool for further study. This enables a reviewer (hostile or otherwie) to re-bin, add, or drop stations as one desires, either to expand on the hypothesis or if one thinks we did the binning wrong or in a prejudiced manner. You don't like our MMTS jumps? Replace them with your own. You think we unjustifiably dropped a station? Just drop it back in. Think a station we included should be dropped? Do that.This will all be archived and easily accessible once we publish.
-
KR at 22:41 PM on 3 July 2015Watts' New Paper - Analysis and Critique
"Heat sinks become disproportionately warmer as the ambient temperature rises..."
Not by any definition of "heart sink" that I'm familiar with. I sincerely hope you have properly defined the terms you are using.
-
Evan Jones at 22:26 PM on 3 July 2015Watts' New Paper - Analysis and Critique
I'm not sure I understand the notion of 'trend exaggeration', Evan. Whether you get a positive or negative trend depends on where you start counting from. How can a microsite heat sink influence in 2008 (or whatever) go from doing nothing to doing something if you change whether the trend line starts at 1995 or 1998?
It very much does depend on where one starts and where one ends. Heat sinks become disproportionately warmer as the ambient temperature rises. If there is a warming trend during the interval, waming will therefore be exaggerated by a funcrion of the amount of the disparity.
If it is a cooling trend (e.g., CONUS 1998 - 2008, the process reverses and the poorly sited stations cool more rapidly than the well sited stations.
For the period from 2005-2015, the trend is essentially flat. That is why the CRN (all well sited) trends do not diverge from COOP on a year-to year basis. In order for HSE to exaggerate trend,there must first be a trend to exaggerate.But HSE even does show up internally in the CRN vs. COOP data — COOP shows slightly warmer summers and slightly cooler winters than CRN. That is consistent with the HSE hypothesis. Both warming and cooling are exaggerated.
-
michael sweet at 22:25 PM on 3 July 2015Watts' New Paper - Analysis and Critique
Evan Jones,
Thank you for the brief description. Since details are lacking it is difficult to respond in detail.
Your listed changes all seem to be by deleting stations from your analysis. Since you have a small sample to start with (and are using only US staions 4% of the globe) you will have to show that you have not deleted all your signal from the data (or added false signal through deletion of other data). You will have to be careful to avoid charges of cherry pickig. It is possible to obtain a graph you want by trying enough combinations of data until you get the one you want, especially with a small, noisy data set.
BEST's analysis is similar: they separate stations into two records when they detect a change. BEST matches NOAA. You will have to show why your approach is better.
Your time period of analysis (1979-2008) is unusual. Why do you truncate the data at 2008 when it is readily available to 2014. (Matching old data analysis is not a good excuse, they previously did not have the additional data). Someone will check to see if the data changes with the full record. You are open to accusations of cherry picking. While you have a 30 year record, generally the minimum needed to see global climate changes, your use of such a truncated time period (combined with your truncated site data and very small geological range) greatly increases the time needed to see significant changes. Claiming that 30 years is typically used is not enough when you limit your other data. You need to get an unbiased statistician to check if your very small data set is still significant. I doubt your time period is long enough to be significant with your truncated data set (I am not a statistician, but I have 20 years of professional data analysis). Differences are expected in small data sets (like yours) due to random variation, you are responsible for showing the changes are statisticly different (generally two sigma).
1999-2008 is too short a time to obtain significant differences with a truncated data set without strong statistical analysis. Eyeballing a graph does not count. You will be strongly criticized for too short a period of time.
-
MA Rodger at 20:25 PM on 3 July 2015Watts' New Paper - Analysis and Critique
John Hartz @85.
There was another odd aspect to the authorship of Watts et al. (unsubmitted). The listing of the four authors (Watts, Jones, McIntyre, Christy) was followed by the following "plus additional co-authors that will be named at the time of submission to the journal". While at the time it appeared very odd, in the circumstnces it presumably will be a list of all the folk who identified and corrected all the mistakes in the original draft (if they care to be so named).
Tristan @90.
I think the source of that Evan Jones quote you present and what it is allegedly answering should be made a little more clear. It is from this 2014 HotWhopper comment thread (or threads - there was a previous one that it transferred from) which was exceeding long and didn't get very far (or questions such as that @90 would have been resolved).
One of Jones' final comments said "... But we cannot address all of this at once in one paper. I look forward to examining all of these issues." All rather ominous.
Evan Jones.
Given this record you have of filling up comment threads to no purpose, can you make clear your purpose here? Are you just after a bit of a chat? Are you here to announce the imminent pre-release of Watts et al.(unsubmitted) for a second time? Do you wish to share some specific aspect of its content with us denizens here at SkS (& if so, we would benefit from knowing what)? Or are you just trolling it?
-
Philip Shehan at 16:42 PM on 3 July 2015The Skeptical Science temperature trend calculator
Thank you MA Rodger.
-
Tristan at 16:30 PM on 3 July 2015Watts' New Paper - Analysis and Critique
As it warms (or cools), the Δtemp between the heat sink and the air surrounding the sensor diverges. Therefore, at Tmin the release of heat is proportionately greater (or lesser) and also earlier (or later) in the heat sink release process at Tmin by the end of the study period than it was at the start. This produces a disproportionate trend effect.
Therefore, a 1C offset in 1979 becomes a 1.5+ offset by 2008.
In a cooling phase, the process reverses itself, and cooling is exaggerated. That is demonstrated by the data from 1998 to 2008.
I'm not sure I understand the notion of 'trend exaggeration', Evan. Whether you get a positive or negative trend depends on where you start counting from. How can a microsite heat sink influence in 2008 (or whatever) go from doing nothing to doing something if you change whether the trend line starts at 1995 or 1998? -
Evan Jones at 15:17 PM on 3 July 2015Watts' New Paper - Analysis and Critique
So would anyone in their right mind describe the hammering the paper has received since the press release as a "final polish"?
Ayup. Finestkind. -
Evan Jones at 15:03 PM on 3 July 2015Watts' New Paper - Analysis and Critique
About the UHI issue:
We find that UHI has little effect on trend. The main driver appears to be heat sink on the microsite level. Well sited urban station trends run much cooler than poorly sited urban station trends.And after dropping the moved airport stations, we are left with very few, and they do not show an elevated trend, either.
Mesosite issues do not appear to have a significant effect on trend. it all comes down to microsite.
-
Evan Jones at 14:58 PM on 3 July 2015Watts' New Paper - Analysis and Critique
Since you are doing all of the heavy lifting on this paper, why is Watts listed as the lead author?
For much the same reason that a general gets the credit for winning (or losing) a battle. Although I have refined the hypothesis somewhat and slogged through much mud, he is the one that found the mud in the first place. I am just the infantry. And he has also done much heavy lifting of his own in this, as well.
-
Evan Jones at 14:52 PM on 3 July 2015Watts' New Paper - Analysis and Critique
Now now, folks.
THANK you for that. Yes, we did not withhold our findings even though they disputed our hypothesis. One of the casrdinal rules of science is that one must never withhold one's findings.
I apprecite that you withhold judgment untill you have an opportunity to read the new version of the paper and carefully examine the supporting data.
We do drop all the NOAA major-flagged datapoints. Raw data has issues and is insufficient to our task. Even after bypassing the issue for moves and TOBS, we still must apply MMTS conversion adjustments. Our results are therefore not rendered in raw data. Also, we anomalize all data (which workes "against" us, overall, BTW). -
John Hartz at 14:45 PM on 3 July 2015Watts' New Paper - Analysis and Critique
Evan Jones:
Since you are doing all of the heavy lifting on this paper, why is Watts listed as the lead author?
-
John Hartz at 14:41 PM on 3 July 2015New study warns of dangerous climate change risks to the Earth’s oceans
Recommended supplemental reading:
New report: the chance to rescue the world’s oceans from climate change is drifting away by Ove Hoegh-Guldberg, The Conversation, July 2, 2015
-
Evan Jones at 14:37 PM on 3 July 2015Watts' New Paper - Analysis and Critique
You are claiming major changes have been made. You ask for feedback, but you have not shown what the major changes are.
Fair enough. I will go into some detail. The three major issues are addressed:
1.) MMTS Adjustment: All MMTS station data is jumped at (and after) the month of conversion according to Menne (2009) data: Tmax: +0.10C, Tmin: -0.025C, Tmean: +0.0375C. (There is also an issue with CRS, per se., which I'll discuss if you wish.)
2.) TOBS: Stations with TOBS flips from afternoon to morning (and a small handful vice-versa) are dropped. This avoids the issue of TOBS adjustment while still maintaining a robust sample.
3.) Station Moves: Any station that has been moved after Apr. 1980 is dropped unless both locations are known AND the rating remains the same. Also, if the rating changed during the study period (1979 - 2008), we dropped the station even if the location(s) was known. It is not controversial that a change in site rating will likely affect trend (by creating a jump). But what we want to demonstrate, unequivocally, is that trends (either warming or cooling) are exaggerated by poor microsite even if the microsite rating is unchanged throughout the study period.
4.) In addition, we provide data during the cooling interval from 1999-2008. A ten-year period is obviously not sufficient to assess overall climate change (and we are not trying to do that). But it is quite sufficient to demonstrate that during that period that the badly sited stations cooled more quickly than the well sited stations.
Heat Sink Effect works both ways. It exaggerates trend in either direction, warming or cooling. What goes up must come down. The only reason that poor microsite has exaggerated warming is that there has been real, genuine warming to exaggerate in the first place.
Our hypothesis does not dispute global warming — it requires it.
Note: After dropping stations as per the above, we are left with a sample of 410 unperturbed stations (both well and poorly sited). However, we are not cherrypicking: the sataions we dropped have substantially cooler trends than the ones we retained. -
Evan Jones at 14:05 PM on 3 July 2015Watts' New Paper - Analysis and Critique
If I were authoring a "game changing" paper on manmade climate change, I certainly would concentrate on completing it as expeditiously as possible .
It appears that Watts has been too busy throwing red meat to his WUWT followers to have focused on his "game changer."
What a farce!
He has had to wait on me. Sorry about that.And I have been concentrating on completing it. I have put in ~3000 hours on this since Fall et al., give or take, plus fulltime work. It has consumed my life. And now, finally, we are just about "there". -
Evan Jones at 14:01 PM on 3 July 2015Watts' New Paper - Analysis and Critique
If you have a paper where you're looking for independent public review, then you should state as much up front! That's not what Tony did. He posted it making wildly unsubstantiated claims about it being something important, influential and about to be published. It strikes me as being supremely self-deluded to suggest posting it before publication was for the purposes of review.
But we did.
The pre-release of this paper follows the practice embraced by Dr. Richard Muller, of the Berkeley Earth Surface Temperature project in a June 2011 interview with Scientific American’s Michael Lemonick in “Science Talk”, said:
I know that is prior to acceptance, but in the tradition that I grew up in (under Nobel Laureate Luis Alvarez) we always widely distributed “preprints” of papers prior to their publication or even submission. That guaranteed a much wider peer review than we obtained from mere referees.
That is exactly what our "purposes" were, and that is exactly what we did. And I have been addressing the resulting (exraordinarily valuable) independent review ever since. It takes time. -
Evan Jones at 13:50 PM on 3 July 2015Watts' New Paper - Analysis and Critique
Is this the "game-changing" paper that Watts promised a few years ago?
Yes.
The only relevant 'systematic error' would of course be one in trends, in change.
Yes, of course.The issue of site quality is relevant to certainty bounds, but unless you have evidence of consistent trends in microsite driven changes in temperatures, I don't think there's much support for overall missed trend errors.
I agree completely. We have powerful evidence of the effect on trend (sic).
Not to mention that the US is only ~4% of the globe.
Not relevant in this particular case. All that is required is a sufficient amount of data to compare siting. What's sauce for the USHCN is sace for the GHCN. But I also agree that a survey of all GHCN stations is called for. But that's not so easy (if even possible at this time) for a whole host of reasons.
I am always saddened by the arguments (both implicit and explicit) on WUWT and other sites claiming (without evidence, mind you) that US adjustments are wrong, usually with claims of malicious distortion and conspiracies, and therefore that global temperature trend estimates are also claimed to be wholly wrong.
I claim all that — with very strong evidence — but WITHOUT the conspiracy theories. I do not think this is fraud, merely an error. An understandable one, one I might easily have made myself.
All data and methods will be fully archived in a form that can be easily altered or re-binned if you think we got parts of it wrong, so you can run your own versions should you desire. I will assist. Bear in mind that we are not trying to convince our "pals". That's always easy. Too easy. We are trying to convince our opponents in this.
I fully expect that the upcoming paper, regardless of the strengths or weaknesses of the work and data, will be be (mis)used as part of such arguments, just as Fall et al 2011 was. Which IMO is unfortunate; it subtracts from the actual worth of these papers.
I have and will continue to insist publicly that the results of these papers do not dispute the reality of AGW. But it does dispute the amount.
-
John Hartz at 09:15 AM on 3 July 20152015 SkS News Bulletin #6: Pope Francis & Climate Change
Recommended supplemental reading:
Invited by Vatican, Naomi Klein Makes Moral Case for World Beyond Fossil Fuels by Nadia Prupis, Common Dreams, July 2, 2015
-
william5331 at 07:55 AM on 3 July 2015Video: scientists simulate the climate of The Hobbit's Middle Earth
The pope had a perfect right to comment on climate change. After all, his was the organization that god bequethed her good works to. When God gave us dominion over the fish that swim in the sea, the birds that fly in the air and everything that goes forth upon the land, dad was passing on to us his miraculous good works into our hands. I don't think he intended for us to trash his creation but to protect and even improve it. (sorry, if god made it, it was perfect and couln't be improved). Pope Francis is just pointing out to his sinning followers that they are the ones that are destroying the earth. The pope must find it somewhat frustrating that by and large, it is the athiests and agnostics of the population that want to preserve gods bounty while his followers take gods work as a licence to destroy it.
-
KR at 05:14 AM on 3 July 2015Watts' New Paper - Analysis and Critique
Now now, folks. Watts, Jones, etc. can hold Fall et al 2011 to their credit, as a paper that took considerable work and was published in a peer reviewed journal - despite the conclusions going against their expectations:
...the overall mean temperature trends are nearly identical across site classifications.
While the initial unpublished and apparently unreviewed paper received a rough reception in its previous foray, due in large part to really significant issues regarding incorrect conclusions drawn by not applying any of the significant known corrections for data errors, I for one am willing to withhold judgement on the next iteration until after I've read it.
Mind you, I do not hold high expectations, considering the quality (or lack thereof) of error correction and homogenization discussions that have occurred at WUWT. But we'll have to wait and see.
-
michael sweet at 04:45 AM on 3 July 2015Watts' New Paper - Analysis and Critique
Evan Jones,
You are claiming major changes have been made. You ask for feedback, but you have not shown what the major changes are. How do you expect us to make comments when you do not show your changes? If you want additional feedback, it is your responsibility to show the changes you have made so that people here can evaluate them. So far you are just advertising your "new" paper.
-
John Hartz at 03:58 AM on 3 July 2015Watts' New Paper - Analysis and Critique
Rob Honeycutt:
If I were authoring a "game changing" paper on manmade climate change, I certainly would concentrate on completing it as expeditiously as possible .
It appears that Watts has been too busy throwing red meat to his WUWT followers to have focused on his "game changer."
What a farce!
-
MA Rodger at 02:48 AM on 3 July 2015Watts' New Paper - Analysis and Critique
Rob Honeycutt @76.
Indeed, for all the world, the description of the pre-release at the time was not consistent with the suggestion @73 that it was a "pre-release in order to obtain hostile independent review so any issues could be addressed before submission," and certainly never a review which would last for years. Planet Wattsupia was actually shut down to allow Watts to get the paper finished and rushed out into the public domain. The official "Backstory" to this drama ended thus:-
(11) And the result is what you see in the press release today. (12) Finally got to take a shower today about 2PM. Prior to that, Kenji* was offended.(13) Now on to final polish thanks to WUWT peer review and submission.
(*Kenji is a dog, apparently.) So would anyone in their right mind describe the hammering the paper has received since the press release as a "final polish"?
-
Rob Honeycutt at 02:17 AM on 3 July 2015Watts' New Paper - Analysis and Critique
John Hartz... Yup, that's the one. Which brings up a good point.
If Watts had "[decided] to pre-release in order to obtain hostile independent review" why would he be touting it as a "game changing paper?" I find this notion to be dubious at best and downright deceptive if true.
If you have a paper where you're looking for independent public review, then you should state as much up front! That's not what Tony did. He posted it making wildly unsubstantiated claims about it being something important, influential and about to be published. It strikes me as being supremely self-deluded to suggest posting it before publication was for the purposes of review.
-
KR at 00:36 AM on 3 July 2015Watts' New Paper - Analysis and Critique
Evan Jones - The only relevant 'systematic error' would of course be one in trends, in change. The issue of site quality is relevant to certainty bounds, but unless you have evidence of consistent trends in microsite driven changes in temperatures, I don't think there's much support for overall missed trend errors.
Not to mention that the US is only ~4% of the globe. I am always saddened by the arguments (both implicit and explicit) on WUWT and other sites claiming (without evidence, mind you) that US adjustments are wrong, usually with claims of malicious distortion and conspiracies, and therefore that global temperature trend estimates are also claimed to be wholly wrong.
I fully expect that the upcoming paper, regardless of the strengths or weaknesses of the work and data, will be be (mis)used as part of such arguments, just as Fall et al 2011 was. Which IMO is unfortunate; it subtracts from the actual worth of these papers.
-
John Hartz at 23:38 PM on 2 July 2015Watts' New Paper - Analysis and Critique
@Evan Jones: Is this the "game-changing" paper that Watts promised a few years ago?
-
Evan Jones at 21:11 PM on 2 July 2015Watts' New Paper - Analysis and Critique
For me, closer to four. I have been at it since Fall et al. (2011), of which I was a co-author. It was necessary to convert the ratings from Leroy (1999) to Leroy (2012). After the criticisms here and elsewhere, it was then necessary to address the outstanding issue of TOBS, station moves, and MMTS conversion. Then swing it all over from USHCN2.0 to USHCN 2.5.
The appearance of an ebullient Evan Jones to claim (in the present tense) credit for (actually) an almost three-year-old comment
Anthony made the decision to pre-release in order to obtain hostile independent review so any issues could be addressed before submission. Having done that, peer review will go a lot easier.
I hashed this out on Stoat, but we made note of the criticisms here, as well. I am not disputing the problems with raw data. But I do have some issues with the adjustment procedure, especially with homogenization.
Doc. VV and I burned through a forum-plus on Sou's blog discussing that point. He says aour findings are interesting, but thinks the divergence between the well and poorly sited stations will be acounted for by jumps. But I've run the graphs, and the divergence is as smooth as silk. He also points out that homogenization will not work if thereis a systematic error in the data. In this cas, that systematic error is microsite.
The problem is that only 22% of sample is well sited, so the well sited stations are brought into line with the poorly sited stations rather than the other way around. If one does not address siting, it is a very easy error to miss. I find it is quite unintentional on NOAA's part, but it is a severe error, nonetheless.If anyone has any specific questions about the current state of the study, I will be pleased to answer.
-
MA Rodger at 19:50 PM on 2 July 2015The Skeptical Science temperature trend calculator
Philip Shehan @80.
OLS yields 90% limits less than half that quoted by Karl et al (2015) so the 'claim' was nonsense. The method used is described as "using IPCC methodology" which is also evidently not that used by the SkS trend calculator.
-
dvaytw at 18:16 PM on 2 July 2015Update on BC’s Effective and Popular Carbon Tax
I've been arguing about this in another forum:
Climate Change - Impacts Part 2
The opposing argument against the info I posted from SkS are as follows:
1) while BC is keeping pace with the rest of Canada, it was doing better before 2008:
2) it's unlikely that a few cents' tax had such a dramatic effect on consumption:
BC's carbon tax has had little effect on fuel consumption
3) in 2014, gas consumption in BC is back up to where it was in 2008:
-
Philip Shehan at 14:39 PM on 2 July 2015The Skeptical Science temperature trend calculator
It has been claimed that Karl uses OLS calculation of confidence limits rather than autocorrelated confidence limits used in the skeptical science trend calculator. Anyone have an opinion on this?
-
Philip Shehan at 13:26 PM on 2 July 2015The Skeptical Science temperature trend calculator
cunudian:
I partly covered the problem with chopping up temperature trends into short pieces to fit skeptic argument was covered in one of my earlier long (apologies to mods) posts above.
Then there is the astonishing manner in whech people like Singer and David Whitehouse include and exclude the extreme el nino event of 1998 to suit their argument.
According to Fred Singer (my Bold):
“Not only that, but the same satellite data show no warming trend from 1979 to 2000 – ignoring, of course, the exceptional super-El-Nino year of 1998.”
Never mind that “skeptics” have been starting with the exceptional super-El-Nino year of 1998 in order to claim a “pause”.
Presumably, Singer accepts that the green line here shows a statistically warming trend.You must not include the period after December 31 1997 in a shorter period because …well, it would spoil his argument .
Singer can declare that that the purple line shows that there is no warming from 1979 to 2000, as long as you leave out the troublesome data after 1997. (The light blue line shows the inclusion of the forbidden data.)
Furthermore, according to Singer, the data from January 1 1998 onward, (the dark blue line) shows a “pause”. No problem including the el nino event at the beginning of a trend, just not at the end, because…well, it would spoil his argument.
And David Whitehouse says you must not start a trend from 2000, (brown line) because… well, it would spoil his argument too.
But back to Singer. Notice that according to his argument there more of a “pause” before the el nino event than after.
The real absurdity is his claim that there is no warming from 1979 to December 31 1997 and there is no warming from January 1 1998 to the present
But there is warming from 1979 to the present.
Singer’s argument is Alice in Wonderland stuff, achieved by chopping a statistically significant warming trend into two short periods where the noise dominates the signal.
-
Tom Curtis at 06:06 AM on 2 July 2015Temp record is unreliable
I have an actual rebutal of the empty slogan @345 here.
-
Tom Curtis at 06:04 AM on 2 July 2015We're coming out of the Little Ice Age
In an apparent flyby comment, arationofreason wrote here:
"No one doubts that we have been recovering fro the LIA for the last 160 years without the help of CO2 for at least the first 100."
Not only do I doubt it, I doubt the comment even means anything. That is because the key word is "recovery", and it is meaningless to talk about a recovery unless you can identify a ground state to which you are recovering. However, people who discuss the "recovery from the LIA" never identify that groundstate. Indeed, they insist the recovery was ongoing to the end of the 20th century even though end 20th century temperatures were likely higher than those of the Medieval Warm Period, a period of noteworthy and unusual global warmth, at least according to climate pseudo-skeptics. I have commented more on the purely rhetorical nature of the word "recovery" in this context elsewhere.
Not only do I doubt the "recovery" rhetoric based on its emptyness, however. More importantly it does not match what we know about global temperature trends.
I realized this due to a recent discussion I had about mean global temperature around 1750. The upshot is that mean global temperatures over the twenty year period centered on 1750 (1741-1760) are statistically indistiguishable from those centered on 1900, ie, there was no strong trend in mean global temperatures representing any "recovery" from the LIA.
arationofreason specifies the last 160 years, thereby restricting the timeframe to that covered by the instrumental record. Unfortunately for his hypothesis, the first 50 years of that record show a negative trend in GMST. Their "recovery" is actually an ongoing decline in GMST (see table in next paragraph), so that if we were to merely continue it, we would have had declining temperatures over the whole of the twentieth century.
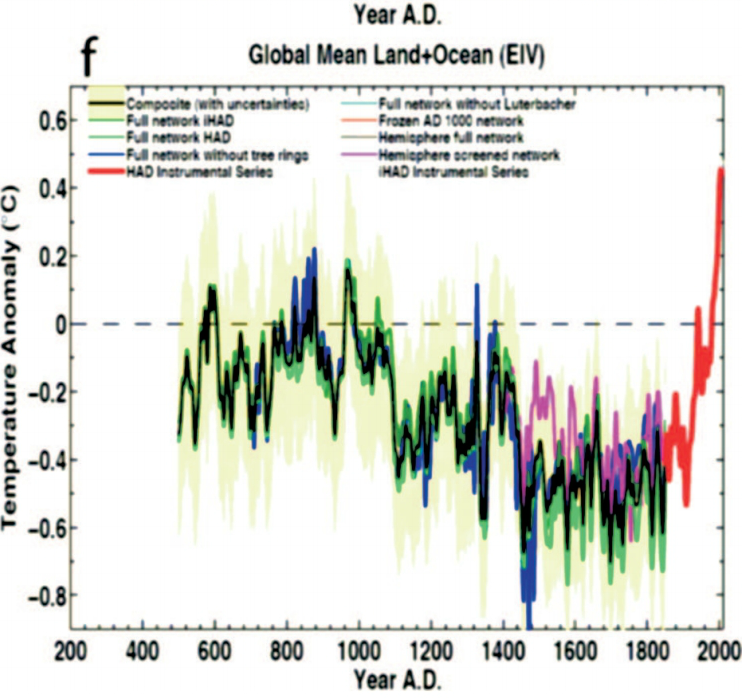
Indeed, extending beyond the instrumental record, we see that there has been no recovery going back to the most intense phase of the LIA in the seventeenth century. Using Mann08 EIV global, we find trends as:
1616-1750 -0.097 C/century (Mann08)
1751-1850 0.000 C/century (Mann08)
1851-1900 -0.020 C/century (HadCRUT4)
1901-2014 0.768 C/century (HadCRUT4)Clearly the "recovery" is a fiction of the imagination. Global temperatures declined from a peak around the 10th century AD (see graph) to a minimum around 1500 AD, from where they bumped around about the same level until after 1900, well after the start of industrial emissions of CO2.
So not only is the rhetorical appeal to the "recovery from the LIA" meaningless, it does not even get the facts about global temperature trends right.
-
KR at 05:29 AM on 2 July 2015As the Denial101x course ends, a new one begins
Wonderful work by all involved - thank you for putting forth such a valuable effort.
-
bwilson4web at 04:28 AM on 2 July 2015As the Denial101x course ends, a new one begins
Can we get some metrics?
- ~14,000 initially signed up
- ~3,114 completed
Thanks, Bob Wilson, Huntsville AL.
-
Eric Grimsrud at 00:29 AM on 2 July 2015As the Denial101x course ends, a new one begins
"Just for fun", I have created an examination for the purpose of steering students towards the traditional and "new age" employment opportunities that appear to exist today. It can be seen at https://ericgrimsrud.wordpress.com/2015/06/27/an-exam-for-professional-aptitude/
-
climatesight at 14:18 PM on 1 July 2015Cracking the mystery of the corrosive ocean
Hi and sorry I am late responding to these comments! Kaitlin here, lead author of the study...
ranyl: You're right, this corrosive water spilling over the sill couldn't happen again today, because none of the deep ocean basins today are isolated like the deep North Atlantic was during the PETM. Ocean acidification coming from the surface is still a major concern though.
knaugle: The starting concentration is 1680 ppm followed by an instantaneous carbon release of 7000 GtC. We also simulated similar behaviour in simulations with starting CO2 ranging from 840 to 2520 ppm, and carbon releases from 3000 to 10,000 GtC (including a gradual carbon release).
RickG: This model simulates present-day surface air temperatures to be about 14 C, more like 13 C for preindustrial (see Eby et al. 2013, doi:10.5194/cp-9-1111-2013). Our PETM simulations started around 24 C, followed by a warming of about 4 C. However, it's not the absolute temperature which matters for ecosystems as much as the rate and magnitude of change.
Treesong2: The deep ocean stays cooler than the surface ocean throughout the entire simulation. However, density depends not just on temperature but also on salinity. The surface and deep North Atlantic had approximately equal contributions of warming to decreased density (although the change happened faster in the surface). But in the surface ocean this was partially offset by increased salinity (due to increased evaporation). So the deep North Atlantic experienced a greater drop in density than the surface did, and eventually in some locations it was less dense than at the surface, even though it was still cooler.
Rob Painting - correct :-)
-
BC at 12:13 PM on 1 July 2015A Southern Hemisphere Booster of Super El Niño
Actually I just realised that this article is talking about the sea level pressure anomalies, which is different to the actual values which I was referring to in my previous post. Even so I'll still be looking at the weather maps with interest.
-
One Planet Only Forever at 12:13 PM on 1 July 2015A Southern Hemisphere Booster of Super El Niño
I am not computer savvy enough to make charts for comments but I have reviewed the NSIDC Arctic Ice extents here and compared them to the super El Ninos of that started in 1982 and 1997 (1972 predates the NSIDC Arctic ice extent data). I also checked in relation to the moderate El Ninos that started in 1986/87, 1991, 2002 and 2009. I based the choice of these additional events on the NOAA ONI history here.
The results are not statistically evaluated it appears that a significant reduction of the Arctic Summer minimum does not always occur the year after the start of a significant El Nino.
However, there appears to be a significant reduction of the Summer minimum about three years after the start of every significant El Nino. Reduced extents appear in:
- 1984/85
- 1990/91
- 1993 and then in 1995 (note a less significant El Nino started in 1994)
- 1999 (note an intense long La Nina followed the 1997/98 El Nino)
- 2005 (note that 2002 was also a low Arctic Summer minimum)
- 2007/08 (note a less significant El Nino started in 2004)
- 2012
That would suggest an Arctic Summer minimum that is lower than 2012 could be expected in 2017 or 2018.
-
BC at 12:04 PM on 1 July 2015A Southern Hemisphere Booster of Super El Niño
I'll start paying more attention to our nightly weather news item. I recall there's been a high over southern Aus recently and these BOM sites show it was so for the last 7 days and is forecast to continue for the next 4 -
Last 7 days (the plot can be animated) www.bom.gov.au/australia/charts/synoptic_col.shtml
Next 4 days - www.bom.gov.au/australia/charts/4day_col.shtml
It'll be interesting to see in the next weeks/months if this high pattern changes much
-
Daniel Bailey at 09:47 AM on 1 July 2015Temp record is unreliable
I have rebutted arationofreason's sloganeering on the UHI effect, here.
-
Daniel Bailey at 09:46 AM on 1 July 2015It's Urban Heat Island effect
A response to arationofreason, who posted this question:
Inconveniently, the Koch Industries-funded BEST team has debunked this tired, trite meme. While urban areas are undoubtedly warmer than surrounding rural areas, this has had little to no impact on warming trends.
And
And
You are welcome to try again, but with actual evidence in lieu of your preferred empty assertions.
Adieu.
-
Tom Curtis at 09:26 AM on 1 July 2015Temp record is unreliable
a[very small]rationofreason's two most recent posts fit exactly to the definition of sloganeering, and so are in direct violation of the comment's policy. I quote:
"Comments consisting of simple assertion of a myth already debunked by one of the main articles, and which contain no relevant counter argument or evidence from the peer reviewed literature constitutes trolling rather than genuine discussion. As such they will be deleted."
(My emphasis)
Not only that, by avoiding the giving of evidence; his or her comments rather contradict his or hers self flattering nom de net. As such, even my ammendation, while reducing the accuracy of the appelation, is still flatering to them, based on observed behaviour.
Moderator Response:[PS] Agreed. Further sloganeering will be deleted. However, please also note the comment policy prohibition on inflammatory remarks.
-
arationofreason at 08:31 AM on 1 July 2015Temp record is unreliable
An increase in temperature over the last 70 years may be due to urbanizaton around the increasingly urban sites.
Moderator Response:[TD] A more appropriate thread for that particular narrow topic is the Urban Heat Island. Note there are both Basic and Intermediate tabbed panes.
[PS] Please take the time to look at the "arguments" button, and then perhaps under taxonomy for such well-worn myths. Repeating such tired slogans without any data or published literature in support of your argument is simply sloganeering and will be summarily deleted.
-
arationofreason at 08:29 AM on 1 July 2015Temp record is unreliable
No one doubts that we have been recovering fro the LIA for the last 160 years without the help of CO2 for at least the first 100.
Moderator Response:[TD] You are mistaken. Please read the post What Ended the Little Ice Age?--the Basic, then Intermediate, then Advanced tabbed panes. If you have further comments after reading those, comment on that thread, not this one.
Prev 563 564 565 566 567 568 569 570 571 572 573 574 575 576 577 578 Next


