


 Arguments


Recent Comments
Prev 593 594 595 596 597 598 599 600 601 602 603 604 605 606 607 608 Next
Comments 30001 to 30050:
-
MMM at 06:24 AM on 10 April 2015A revealing interview with top contrarian climate scientists
Sorry for the double posting! And thanks to Tom Curtis for the other table. I do remember when CCSP 1.1 came out in 2006 that the satellite correction (presumably the 2005 one in Tom's table) was big news...
-
MMM at 06:18 AM on 10 April 2015A revealing interview with top contrarian climate scientists
I have one critique of the Evolution of UAH trends chart: it confounds changes due to adjustments and changes due to changing trends over time. I would replace the dashed "current" line with datapoints for trends using current data for each of the years shown (e.g., 1979-1995, 1979-1998, etc). Using woodfortrees, LINK, I get:
1995: ~0
1998: 0.04/decade
2001: 0.1/decade
2005: 0.13/decade
all data: 0.13/decade
I know the woodfortrees UAH data is UAH5.5, not 5.6, so ideally one would repeat this with the latest dataset, but I think it shows that the revisions to the UAH data have indeed led to an increase in the trend, but that also the trend has increased over time due to more warming.
-MMM
Moderator Response:[RH] Shortened link. Think we can get you to start using the embedded link tool? It's on one of the tabs at the top of the comment box.
-
Models are unreliable
Rhoowl - "So having a range if sea level rise would not be useful. You need to know what it is."
Knowing a range of risks is sufficient to evaluate risk avoidance - fire insurance is an excellent example. You don't know if your house will or won't catch fire, if it catches fire you don't know how much damage that might cause, yet you buy fire insurance to cover the likely range of damages. That span of damages is not an error, but rather the bounds on risk. The same holds for sea walls, and in fact for every other consideration of risks vs. benefits.
Back on topic - the models are quite good within their stated limits: 30 year or so projections of the average climate response due to stated forcing changes, with bounds determined by climate variability. Your insistence on 1/10,000 risk levels, and in fact your treatment of climate models (boundary problems) as weather models (initial condition problems) are IMO demands of impossible expectations.
-
CO2 is not the only driver of climate
ClimateTool - Regarding consensus, I would suggest following Daniels excellent suggestion, and looking at threads using the Search box on the upper left.
-
Tom Dayton at 05:09 AM on 10 April 2015Models are unreliable
Rhoowl claimed "So having a range if sea level rise would not be useful. You need to know what it is."
Suppose you are an engineer hired by the town of NearlySubmerged to design a new seawall to protect it in the year 2100 to the same degree the old seawall protected the town when it was built in 1900. (The town is not in Florida, where for most shores the porous land allows the water to seep under the seawalls.) Think of Superstorm Sandy and New York City.
The town already has made some of the decisions that I described in my previous comment. The town has decided that they want the risk that they had in the year 1900. The town did not look up that risk level in an engineering book. That risk level is not "standard." It is not objectively calculated. It is a choice by the town. They could have decided differently, for example to preserve the risk they have today, in 2015, which is considerably higher than the risk they had in 1900.
Even with that information, you still need to know the projection of sea level rise by 2100. You cannot make that decision by yourself. You must ask the town for their choice of which IPCC emissions scenario they prefer to assume will come to pass. Then given that chosen emissions scenario, you must ask the town whether they want to use that sea level projection's mean value, or its range's 95% upper bound, or its range's 95% lower bound, or some other value. (To simplify this example, let's skip you asking the town to choose a projection of storm surge changes by 2100.)
Only with all that information can you then design the seawall.
But the town will balk at making any of those decisions, because those decisions are subjective. They will ask you, as all savvy shoppers do, to present them with the cost of constructing each design to meet each of those projected sea levels. To shorten your task, probably you will first design for the sea level at the top of the 95% range of the most emissive of the emissions scenarios, and for the one at the bottom of the 95% range of the least emissive of the emissions scenarios. You might discover that the difference in cost of those two extreme designs is so small that the town feels it is well worth the cost to design for the highest projected sea level. But probably that cost difference will be large enough that the town wants you to give them costs for intermediate projections, until the town (not you) decides which sea level projection to use. Now you have enough information to finish designing. That information is not "1 in 10,000"; it is several pieces of information.
In that process, imagine that the minimum projected sea level rise by 2100 was .13 meter, and the maximum was, say, .14 meter. The town might decide they will not build a new seawall but will live with the risk increase, because they think they will spend less money to cope with anything in that range than they would spend on a new seawall. That is the town's decision, not yours. You don't simply look up that decision in your notes from engineering class.
But suppose the town decides that that the least-emissive emissions scenario is impossible--that it will not come to pass. So they tell you to ignore all of the sea level projections from that optimistic emissions scenario. Suppose that the emissions scenarios they tell you to use have 1 meter sea level rise as the lowest end of the 95% range of the least-emissive of those allowed scenarios. Suppose the town decides that they most definitely want to be protected from a 1 meter rise, but they are unwilling or unable to spend the money to protect against anything higher. It does not matter that the upper bound of sea level rise in those within-scope scenarios is 11 meters, because the town has decided not to protect against that much rise, even though it would be catastrophic.
Back to your claim that a range of projected values is useless: You are wrong. The large span of that range does not make the projection useless, if even the minimum value is large enough to demand action. A range is useful for decision makers (requirements deciders) to choose from in picking out the value to hand to you, the engineer, to design to meet.
-
Daniel Bailey at 05:06 AM on 10 April 2015The global warming 'pause' is more politics than science
Yes, pie is tasty. AIUI, the fake-skeptics prefer cherry above all other flavours.

-
Daniel Bailey at 04:58 AM on 10 April 2015Water vapor is the most powerful greenhouse gas
In response to this question, per Lacis et al 2010:
http://www.giss.nasa.gov/research/briefs/lacis_01/fig2.gif
http://www.giss.nasa.gov/research/briefs/lacis_01/
http://www.giss.nasa.gov/research/briefs/lacis_01/fig3.gif
"Ample physical evidence shows that carbon dioxide (CO2) is the single most important climate-relevant greenhouse gas in Earth's atmosphere. This is because CO2, like ozone, N2O, CH4, and chlorofluorocarbons, does not condense and precipitate from the atmosphere at current climate temperatures, whereas water vapor can, and does.
Non-condensing greenhouse gases, which account for 25% of the total terrestrial greenhouse effect, thus serve to provide the stable temperature structure that sustains the current levels of atmospheric water vapor and clouds via feedback processes that account for the remaining 75% of the greenhouse effect.
Without the radiative forcing supplied by CO2 and the other non-condensing greenhouse gases, the terrestrial greenhouse would collapse, plunging the global climate into an icebound Earth state."
http://pubs.giss.nasa.gov/abs/la09300d.html
Per Lacis et al 2013:
"The climate system of the Earth is endowed with a moderately strong greenhouse effect that is characterized by non-condensing greenhouse gases (GHGs) that provide the core radiative forcing. Of these, the most important is atmospheric CO2. There is a strong feedback contribution to the greenhouse effect by water vapor and clouds that is unique in the solar system, exceeding the core radiative forcing due to the non-condensing GHGs by a factor of three. The significance of the non-condensing GHGs is that once they have been injected into the atmosphere, they remain there virtually indefinitely because they do not condense and precipitate from the atmosphere, their chemical removal time ranging from decades to millenia. Water vapor and clouds have only a short lifespan, with their distribution determined by the locally prevailing meteorological conditions, subject to Clausius-Clapeyron constraint.
Although solar irradiance is the ultimate energy source that powers the terrestrial greenhouse effect, there has been no discernable long-term trend in solar irradiance since precide monitoring began in the late 1970s. This leaves atmospheric CO2 as the effective control knob driving the current global warming trend.
Over geologic time scales, volcanoes are the principal source of atmospheric CO2, and the weathering of rocks is the principal sink, with the biosphere particpating as both a source and a sink. The problem at hand is that human indistrial activity is causing atmospheric CO2 to increase by 2 ppm/yr, whereas the interglacial rate has been 0.005 ppm/yr. This is a geologically unprecedented rate to turn the CO2 climate control knob. This is causing the global warming that threatens the global environment."
http://pubs.giss.nasa.gov/abs/la06400p.html
http://pubs.giss.nasa.gov/docs/2013/2013_Lacis_etal_1.pdf -
eksommer at 04:57 AM on 10 April 2015The history of emissions and the Great Acceleration
I really enjoyed this article as well and was interested in the analyses. But please reconsider using stacked line graphs. They look nice, but they are sooooo difficult to understand.
-
Daniel Bailey at 04:55 AM on 10 April 2015CO2 is not the only driver of climate
While some threads are dated, no threads are dead here.
Water vapor is best addressed on this SkS thread here:
Explaining how the water vapor greenhouse effect works
I have placed a followup to your question there. Any questions you may have after reading the post and my response should be placed there.
Many other threads deal with consensus. The Search function will find many; pick one and re-ask your question there.
-
ClimateTool at 04:36 AM on 10 April 2015CO2 is not the only driver of climate
Greetings - I'm new to this webpage / forum, which I find fascinating. The brief bio's on the Skeptical Science Team is as impressive as it is varied. I realize this is an old thread, but it looks like a good place to start.
Let me say at the outset I agree the climate is changing - warming in most areas of the globe - with a net temperature increase. That is obvious in the data, of which I spent a 40 year career collecting, analyzing and processing. Living in the plains, the changes are apparent - latter first snows, earlier spring, increases in non-native insects, plant and human diseases; the list goes on.
While I have my own understanding and response to Change skeptics, I've learned to consider all the facts. Science is after all based in question, discovery, hypothesis, observation, proof, testing proof. Therefore I have two questions.
1) Water Vapor and it's impact on the changing climate. Per the older NASA article from November 2008
http://www.nasa.gov/topics/earth/features/vapor_warming.html
and others since, it seems H2O is somewhat downplayed. What is the Teams sense on H2O impacts on climate change?
2) Science by concensus (Bill Nye's famous videos). Other disciplines outside of meteorology have differing views on the changing climate. By education I was a Soil Science major. In my 'weather' career I've seen this lack of cross discipline discussion result in all manner of issues. Again, what is the Teams sense on "Science by concensus" versus the time tested steps of the Scientific Method?
Thank you. I look forward to your response.
-
Tom Curtis at 04:12 AM on 10 April 2015The global warming 'pause' is more politics than science
Daniel Bailey @13, I think you are being a little unfair. The fake skeptics also like looking at the blue wedge of the pie graph in the upper right of the second image (but never, of course, at the red sections of that graph).
-
Daniel Bailey at 03:22 AM on 10 April 2015The global warming 'pause' is more politics than science
To piggy-back onto PhilippeChantreau's and Leto's comments, the "skeptic" focus on ("but what about since 1998!") becomes understandable: when evidence, the physics of our world and Mother Nature itself is against you, misdirection is the only ploy left in the ideological gameplan:


-
Tom Curtis at 03:18 AM on 10 April 2015A revealing interview with top contrarian climate scientists
MMM@11, perhaps you would prefer this table of UAH adjustments:
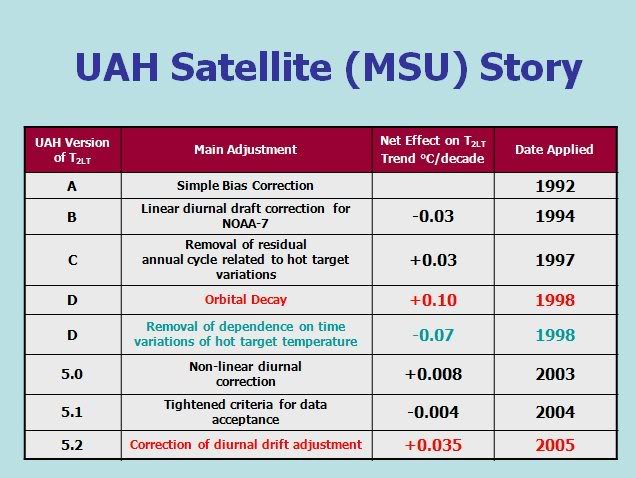
In all, it means that the initial version of UAH contained admitted errors that would have more than halved the current trend, if not corrected. Working backwards we can then see that the admitted errors amount are, for given years, as follows:
1992 -0.069
1994 -0.099
1997 -0.069
1998 0.031
1998 -0.039
2003 -0.031
2004 -0.035
2005 0 -
The global warming 'pause' is more politics than science
It seems that Mother Nature has been trying pretty hard to slow down the warming, but the last 12 months has still been the warmest on record with an anomaly of +0.71oC.
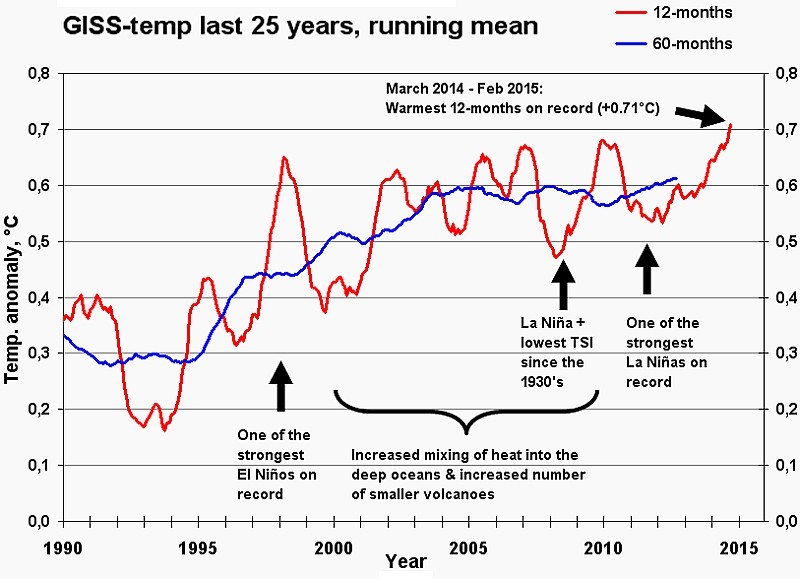
The March anomaly from GISS will probably push the running 12-month mean up to at least +0.72°C, one more step into record territory.
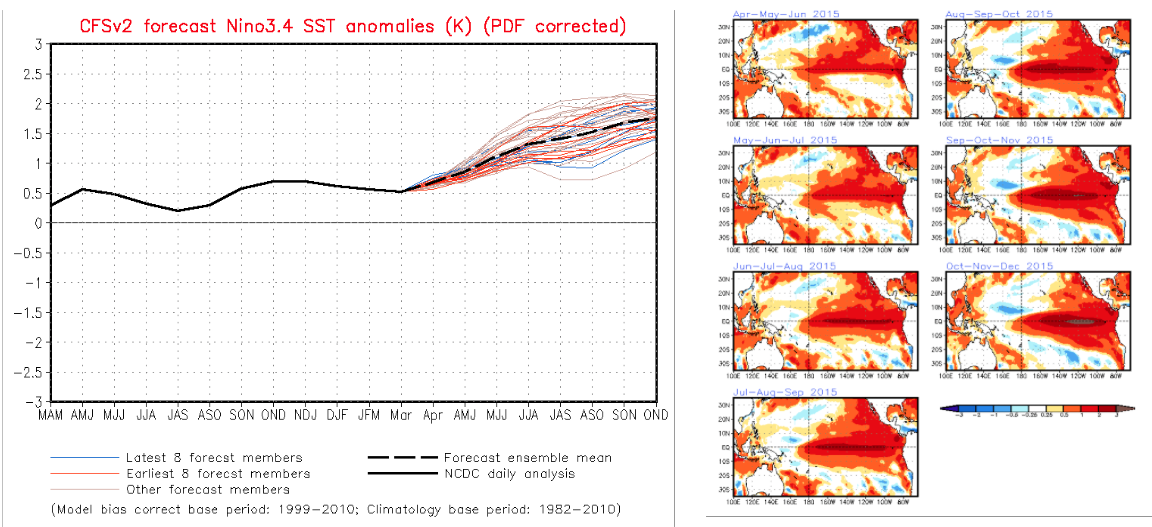
And if the present weak El Niño strengthens and last for the rest of the year, the temperature anomaly for 2015 may well end up between +0.75°C and +0.8°C. -
MMM at 02:14 AM on 10 April 2015A revealing interview with top contrarian climate scientists
I have one critique of the Evolution of UAH trends chart: it confounds changes due to adjustments and changes due to changing trends over time. I would replace the dashed "current" line with datapoints for trends using current data for each of the years shown (e.g., 1979-1995, 1979-1998, etc). Using woodfortrees, [LINK to source data], I get:
1995: ~0
1998: 0.04/decade
2001: 0.1/decade
2005: 0.13/decade
all data: 0.13/decade
I know the woodfortrees UAH data is UAH5.5, not 5.6, so ideally one would repeat this with the latest dataset, but I think it shows that the revisions to the UAH data have indeed led to an increase in the trend, but that also the trend has increased over time due to more warming.
-MMM
Moderator Response:[DB] Hyperlinked and truncated URL that was breaking page width.
-
Rob Honeycutt at 02:05 AM on 10 April 2015The global warming 'pause' is more politics than science
I'm thinking whatever "pause" there may be in surface temperatures will be going away very soon...
-
Leto at 00:07 AM on 10 April 2015The global warming 'pause' is more politics than science
PhilippeChantreau,
Of course you are correct.
The comment policies here prevent me from saying what I really think, but I wonder if climate scientists and reasonable people everywhere have been too tolerant of this nonsense. I accept that some people are truly stupid enough to fall for the "since-1998" line, and I see that there is a need to provide outreach education to those who are genuinely confused, but I suspect that true confusion on the issue is relativey rare. I do not believe the "since-1998" line can be promoted in good faith by people capable of forming a paragraph of reasonable-sounding prose that includes the words "significance" and "trend". There can be no reasonable grounds for making an argument based on the lack of significance of a trend from that obviously outlying year, and only cynicism, cognitive dissonance or a reckless desire to score cheap debating points divorced from scientific reality can explain how commonly the argument is aired.
I cannot think of a single case where someone has raised the "since-1998" line, stayed around long enough to get educated, and subsequently made a useful contribution to the "debate". To me it is almost invariably a marker of bad faith, and I know as soon as a poster raises it that I am unlikely to see them follow it up with anything worthwhile.
I have been wondering if Climate Science needs its own version of Godwin's Law, where the first person to raise the "since-1998" nonsense can be declared the loser without further discussion. I know that would raise its own problems, and we need some way for the genuinely confused to be pointed in the right direction, but it is painful to see the discussion dragged down to this level so regularly.
Regards,
Leto.
-
PhilippeChantreau at 23:18 PM on 9 April 2015The global warming 'pause' is more politics than science
MatinG is looking at a "trend" starting from the whopper El-Nino year of 1998, and of course the trend is lower starting that year. How about the warming from 1999 Martin? Or from 1997? Or 1996? The fake skeptics have literally done this for years now. What's really happening is, as years that are on par with 1998 pile up in the absence of El-ninos, we see the new normal: year after year near or above 1998 temperature in spite of numerous cooling influences, especially a sun delivering less irradiance than back then.
-
bozzza at 22:59 PM on 9 April 2015The global warming 'pause' is more politics than science
@6, it is non-incompetent propaganda admitting that industrial upheaval(aka "a period of consolidation") is underway: the long expected resource bottlenecks are being exploited as we speak!
Basically blue-chip shares are working out how to stay blue-chip shares... delay delay delay!!!!!!!!!!!!!!!!!!!!!!!!!!!!!!!!!!!!!!
Moderator Response:[RH] Please tone it down.
-
SteveAplin at 22:38 PM on 9 April 2015Matt Ridley is wrong again on fossil fuels
Is there a reason my comment on this post, left last week, was not published? While it was critical of Matt Ridley, it was not ad hominem. Nor was it off-topic, and nor (I believe) was it poorly written.
Just asking.
Moderator Response:[JH] Our inventory of deleted posts does not include any from you.
-
BBHY at 22:24 PM on 9 April 2015The global warming 'pause' is more politics than science
Oops, the 2000's were 0.564, 0.170 higher than the 90's. Typo.
-
BBHY at 22:20 PM on 9 April 2015The global warming 'pause' is more politics than science
Why are people so concerned about the last 17 years? It seems like a rather odd time frame, compared to say, decades, or 5 years increments, or a moving average of some sort. Are they concerned about the possible effect of climate change on the cicadas? When I look at the average global temperature anomalies for each decade I don't see anything like a pause.
1970's: 0.067, 0,026 higher than the 60's
1980's: 0.231, 0.164 higher than the 70's
1990's: 0.394, 0.163 higher than the 80's
2000's: 0.594, 0.170 higher than the 90's
(All data from NASA)
I'm pretty sure than when we get to 2020, the 2010's decade will show a similar increase in global average temperature anomaly.
They aren't picking a 17 year time frame because they are just cherry picking convenient dates that appear to support their claims, right?
-
CBDunkerson at 22:07 PM on 9 April 2015Models are unreliable
Rhoowl wrote: "The one post I had which is no longer visible..."
Actually, it's still visible. You just posted it to a different thread.
Yes, the 'gap' between 11.5 meters near maximum (upper 5% uncertainty band) sea level rise assuming the RCP8.5 emissions scenario and 0.13 meters near minimum (lower 5% uncertainty band) on the RCP3PD emissions scenario is big. However, it is not any kind of "error"... because you are looking at two different things. You might as well argue that weather models are useless for predicting the next day's temperature because they show a maximum daily temp of 90 F in Atlanta vs a minimum daily temp of 10 F in Nome... what a "big error"!
-
CBDunkerson at 21:54 PM on 9 April 2015The global warming 'pause' is more politics than science
MartinG wrote: "...but it also shows that there has been no significant warming over the last 17 years (1998 to 2015) - so the statement is in fact accurate, and your point completely invalid."
There has been no statistically significant warming of the global lower atmosphere in the past five minutes.
That statement is true. However, it is not a 'valid' argument. The '17 years' statement, if the appropriate qualifiers (e.g. 'statistically significant' & 'lower atmosphere') were included, would also be true, but invalid for exactly the same reasons. If you can't understand the difference you should probably read Dana's article again.
Any statistician who is not a complete fraud will tell you that if shifting the end points a few units radically changes the trend then you are looking at too small an interval to establish a valid trend. Whether that interval is 17 years or 5 minutes doesn't matter... you're basing conclusions on a mathematically meaningless result.
-
bozzza at 21:48 PM on 9 April 2015The history of emissions and the Great Acceleration
I'm sorry, what was the definition of "eons" again- it would appear the skeptical science website forgot to include it in its list of vocabulary...
-
denisaf at 21:11 PM on 9 April 2015The history of emissions and the Great Acceleration
There have been emission and absorption of CO2 for eons. They were roughly in balance until industialization caused a rapid increase in the amount in which emissions have exceeded absorption. Focussing just on emissions as in this article is misleading. The figures provided are very useful if viewed in context.
-
MartinG at 17:04 PM on 9 April 2015The global warming 'pause' is more politics than science
Dana, I understand that your trademark is to be in the vanguard og the AGW movement, but if you are hoping that we will read your stuff, please be more precise, otherwise its too easy for sceptics to write you off as an uninformed propaganda source. Your monthly global Lower Troposphere v5.6 Anomaly that you link to does indeed show that there has been warming over the last two decades (1995 to 2015), but it also shows that there has been no significant warming over the last 17 years (1998 to 2015) - so the statement is in fact accurate, and your point completely invalid.
Moderator Response:[DB] "there has been no significant warming over the last 17 years (1998 to 2015)"
Please provide a citation for this claim.
-
BBHY at 17:01 PM on 9 April 2015The global warming 'pause' is more politics than science
In many ways having heat energy stored in the oceans is even worse than in the atmosphere. First of all, it is "out of sight, out of mind" making it harder to get political policy changes to reduce emissions. But another problem is that it stores the heat for much longer. Heat in the atmosphere has a chance to radiate away into space, but in the oceans it is trapped for a very long time so we can expect centuries of trouble. It also contributes to sea level rise by the expansion of water. Then that warmer water works its way under and around the floating and grounded ice shelves such as those in the West Antarctic, greatly increasing the chances that they will go unstable much sooner than they would otherwise.
So no, the fact that the oceans are taking the heat and we don't experience so much of it where we live is not a good thing.
-
Tom Dayton at 15:11 PM on 9 April 2015Models are unreliable
Rhoowl asked me "TD what type of standards do you design to and what type of safety factors." The answers are NASA standards for mission operations software for JSC to monitor the ISS, Orion, and other vehicles; for mission ops software for JPL to monitor their uncrewed large and small spacecraft including Mars rovers; for ARC nanosat spacecraft flight software and hardware; for rocket guidance, navigation, and control software-hardware packages; for an assortment of hardware-software payloads for an assortment of spacecraft being produced and launched by an assortment of international organizations; and for autonomous aerial drones ground-plus-flight hardware and software.
But I suspect you asked because you believe there are a few books of acceptable risks probabilities to which engineers turn. There is a smattering of such numbers, mostly for small subsystems, and mostly for hardware, but even for those, fundamentally it all comes down to subjective human judgment of acceptable risks for each situation by not just the engineers but the other stakeholders in the project, as I described earlier. The most important design standards for risk are standards for process--for how those design judgments are made, and then how the implementations and testings of those designs and implementations are done.
-
DSL at 14:23 PM on 9 April 2015Models are unreliable
Rhoowl, climate modeling is fairly tightly bounded over climate-scale periods. There is no physical reason--barring extremely unusual heavy, persistent volcanic activity or a massive drop in insolation--why the long-term trend should not continue as it has done for the last fifty years and, in fact, increase. On the decadal scale and at medium or high spatial resolution, climate (or, rather, weather) is very complicated, noisy. On the multidecadal scale and at low resolution, the internal variation can be accounted for, and the primary forcings and feedbacks dominate the trend.
Baseball is a good analogy. Given that a team's talent stays generally consistent, projecting the team's chances at the playoffs is pretty easy. However, take any two-week period in the season, and the team's success might not be evident whatsoever--short-term injuries, bad calls, distractions, slumps, etc. It's that "given" that's key. We understand the major "givens" for climate. Indeed, an overwhelming majority of the uncertainty lies in the human response.
We understand the physics well enough. We don't understand the human response. Yet we don't have time to wait for a better understanding of the human emissions pathway. Even if we go to zero emissions tomorrow, we're still looking at a major response from the ice sheets (among many other sub-systems) as they come to equilibrium with the elevated level of forcing. Atmospheric CO2 doesn't just return to pre-industrial once we zero our emissions, and it is extremely unlikely that we'll zero emissions anytime soon.
-
scaddenp at 14:19 PM on 9 April 2015Models are unreliable
If you are in a low lying city and wondering about building sea walls, then you have two level of uncertainty. One is range of error in a model scenario but far harder is guessing what humans will do about reducing emissions. If you are forced to make the assumption that no political will to tackle the problem exists, then you must use the range of sea level rise values for the upper RCPs. ie 0.81-1.65 in latest papers. A cautious engineer would be going for the larger number at least because sealevel rise doesnt magically stop in 2100.
Unfortunately. sealevel rise has yet another level of uncertainty. The GCMs tell you climate (with a range of uncertainty), but another set of models have to come into play to convert that climate into a rate of ice sheet collapse. This is not a well understood problem and is the major source of the wide range in the numbers.
In my opinion, uncertainty is not your friend. The prudent response is to reduce emissions as fast as it can possibly be done.
-
Glenn Tamblyn at 13:27 PM on 9 April 2015The history of emissions and the Great Acceleration
tcflood
You might also look at the AR5 WG1 Technical Summary here. Figure TFE.8 Figure 1 on page 104 - it's a bit big to reproduce here.
Based on percentages of models used 50% comes in at around 800 gTonne carbon cumulative. And we are at around 500 GTonne at present so 300 to go. To convert to GTonne CO2 multiply by 3.67 which gives around 2900 GTonnes CO2 total.
90% and the limit comes down to only 650 GTonne C - 150 to go.
At around 10 GTonnes C/yr at present that means 15-30 years, and we blow the budget. Shorter if emission rates keep climbing.
-
John Hartz at 13:14 PM on 9 April 2015Models are unreliable
Rhoowl: The Dutch, who know something about protecting their land from the sea, do not seem to be waiting for futher refinement of Global Climate Models to take action. For example, see the City of Rotterdam's Climate Proof: Adaptation Programme adopted in 2009.
-
tcflood at 12:35 PM on 9 April 2015The history of emissions and the Great Acceleration
Andy,
There was no subtle message in my comment about not being specific. I am struggling with the right tone to take and how much to say in public presentations. Any advice you can give me would be welcome.
I like you presentation and found it helpful and informative.
-
Andy Skuce at 12:01 PM on 9 April 2015The history of emissions and the Great Acceleration
No, I wasn't being deliberately vague. The pace of emissions reduction and the right target to aim for wasn't really the point of the post. It just struck me that the future pace that we have to reduce emissions is roughly a mirror of the history of the Great Acceleration.
-
Rhoowl at 11:25 AM on 9 April 2015Models are unreliable
BOzza wind is a part of the design....Theier a very specific design standards in that regards.....Including standard design to wind tunnel testing. This area has been heavily researched. But again....the only time I hear about failures are due to extreme force events..ie hurricanes, tornados etc. the wind code didn't get very stringent until after hurricane Andrew. Buildings built before then didn't all have the necessary shear elements and hold downs. The design process evolved over centuries of construction. Like climate modeling is still in its infancy. Over time you will see the models refine to produce more accurate results.
TD what type of standards do you design to and what type of safety factors
-
bozzza at 10:48 AM on 9 April 2015Models are unreliable
" So having a range if sea level rise would not be usefull. You need to know what it is."
There are needs and then there are wants...
Let's compare and contrast this with wind loading: uncertainty abounds and engineers deal with it all the time unlike you suggest!
-
Tom Dayton at 10:46 AM on 9 April 2015Models are unreliable
Rhoowl, you are incorrect that "engineers" in the sense of all engineers, use an acceptable risk of failure of "about 1 in 10,000." Perhaps that is true in the very narrow particular engineering field in which you have spent your career, but that absolutely is not a universal rule; it's not even a general guideline. Risk tolerance depends entirely on the particular situation. In my field of spacecraft design, for example, the risk tolerance differs from one spacecraft to another, from one type of risk to another, on the timeframe and other circumstances, and always depends on costs (money, time, labor) for lowering the risk and for dealing with consequences if the bad thing happens. For example, a nanosatellite usually needs to be cheap and fast to develop and launch, so usually the risk of total failure is higher than for big spacecraft, because the funders are not williing to spend enough resources to lower the risk further. For any spacecraft, tolerance for spacecraft failure is lower before the primary mission is accomplished, and higher after that. Much lower risk is tolerated for spacecraft that put human health and life at risk than for mere property risk.
When engineers chose how high to make a seawall, you are correct that they must design to a particular, target, level of sea level. But that particular level is dictated to them by people who take into account the full range of all I've written about, including the range of probabilities of various levels of sea level rise.
-
Trevor_S at 10:46 AM on 9 April 2015The global warming 'pause' is more politics than science
@ John Hartz The comments are at least as illuminating :)
Another here, a repost from The Conversation, the comments are more illuminating than the article.
Moderator Response:[JH] Link activated.
-
tcflood at 10:36 AM on 9 April 2015The history of emissions and the Great Acceleration
Andy; Thanks for your response. I forgot to mention that I had also checked out the Synthesis Report. I did see this diagram. To correct one comment I made above, the statement I have seen in several places is that we need to limit emissions to 2,900 Gtonnes of CO2 (not 450 ppm).
General audiences want to hear something specific about what percent we need to cut back on, say, use of coal each year to stay under the famous 2C increase. Diagrams such as that above seem to suggest that, given the dominant politics in the U.S. and Australia, for example, we are already way past 2C (assuming that the TCR used turns out to be anywhere near correct). Maybe there is good reason not to be too specific in presentations so as to not discourage people to the point that they choose denial.
-
Rhoowl at 10:00 AM on 9 April 2015Models are unreliable
I need to explain something about design. Engineers use an acceptable risk of failure about 1 in 10,000. That's a high standard. Failures can be catastrophic. We absolutely need to know the design parameters within 20 percent. We have safety factors. they range from 1.5 to 4. Something like a sea wall would have overturning sf of 1.5. there would also be free board distance from top of wall to water. Not more than two feet. If the wall gets breached there's a high risk of failure. Water washes out the toe resulting in loss of stability. This is why getting the parameters correct is so important. So having a range if sea level rise would not be usefull. You need to know what it is.
Moderator Response:[JH] Is English your first language?
-
Rob Honeycutt at 09:30 AM on 9 April 2015Models are unreliable
Rhool... Modelers' time is most certainly valuable, but I think you'd find that many of them would consider explaining their work to be a valuable use of their time. It just requires an open mind and a willingness to learn.
-
Rhoowl at 09:22 AM on 9 April 2015Models are unreliable
I'm typing this on an Ipad please forgive some of the English it's the spell checker messing some of it up
-
Rhoowl at 09:13 AM on 9 April 2015Models are unreliable
JH yes the range of estimates are different scenarios....each scenario had an error. The error equates to a diferrent level of sea level rise.
RH someday an engineer is going to ba asked to design these systems based on the models. when that occurs they they will ask some of the questions I am posing here. I'm not sure that an climate would want to speak me to about these questions. I would respect that their time is valuable.
CBD iposted the graph one of the more extreme scenarios showed 4c warming with 2.4 to 6.4 I believe error. With the way China and India are building coal plants is this implausible scenario? The one post I had which is no longer visible shoe Sea level rise with the worst case bing 11.5m....this probably corresponds to the 6.4 scenario. The 2.3 scenariio should be in the 5m range based on the 2m/degree C value given. That's a pretty big error
Scaddenp I never made any claims about inputs except that I tbought the modellers were entering the best figures. Although the scenarios listed deal with the inputs.....but that's another matter which complicates the design process.
-
Andy Skuce at 09:10 AM on 9 April 2015The history of emissions and the Great Acceleration
tcflood
I can't give you all the info you ask for, but I based that comment on graphs like this. (From here)
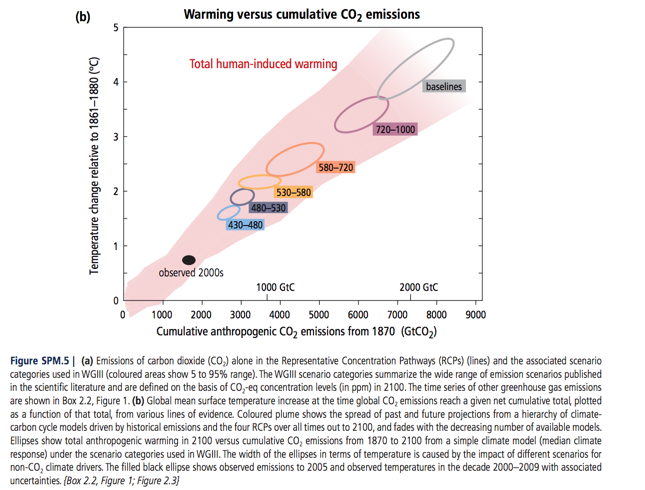
The concentrations are next to the little ellipses.
Of course, the exact amount of CO2 concentration (and note that the IPCC concentrations are CO2eq figures, so they include the other GHGs) that will cause 2 degrees C warming will depend on climate sensitivities, so there's considerable uncertainty. It also depends on the probability of exceeding 2 degrees that we deem acceptable as a risk.
I just meant 450ppm as a rough target. Some scientists far more qualified than me consider 350 to be the safe limit.
-
tcflood at 08:13 AM on 9 April 2015The history of emissions and the Great Acceleration
Andy; In your last paragraph before the summary, you comment that we will need to stay below 450 ppm to stay under a 2 C increase. Where can I find he closest thing to a primary reference that discusses the assumptions (assumed transient climate response, rate of decrease of CO2 emissions needed, etc.) in this widely repeated statement? I've tried to find it in the AR5WGI technical report and it's summaries and the summaries for WG's II and III, but I can't find it there in explicit form. Probably I've just missed it.
I'd like to prepare a nice clean, concise summary for presentations of at least one scenario of exactly what society would need to do to meet the gaol of a 2 C limit, given some explicit assumptions about the science.
-
Rob Honeycutt at 06:37 AM on 9 April 20152015 SkS Weekly Digest #12
william... Damns, whether man-made or erected by industrious little critters [redundant statement?], need water. We've had very little precipitation for several seasons now. More damns can't fix that.
-
william5331 at 06:21 AM on 9 April 20152015 SkS Weekly Digest #12
There is a solution to the decrease in the snow pack that provides California with her water. The Beaver. The beaver does the same thing as a snow pack. It shifts water from when it falls and is not needed (winter) to when it is not falling and is needed (summer). Californians should wake up and get absolutely fanatic about having beavers in the catchments of all their streams.
http://mtkass.blogspot.co.nz/2007/07/canadian-beaver-pest-or-benefactor.html
http://mtkass.blogspot.co.nz/2011/05/erics-beavers.html
http://mtkass.blogspot.co.nz/2014/06/the-tay-beavers-of-scotland.html
-
PluviAL at 05:56 AM on 9 April 2015The history of emissions and the Great Acceleration
@2, JJA: Your link seems to be unsupported, its just a link to a blog, but to be fair I will look at it. My reaction to your post is not good. I feel that this is an exaggeration of data, and thus the interpretation is too dire.
We can fix the problem, but we must look at it realistically, not too rosy, not too bleak.
I'm not certain how bad the extinction factor will be, but we will get a handle on both global warming and cooling, Sea Level Rise, and CO2 concentrations. Extinction damage is just a matter of how long it takes us to take on the problem on scale.My sense is that we in the US are coming around to reality, then we will act. Canada and Australia seemed to be ahead, but they now seem to be headed into the denial tunnel, which we are coming out of, the Brits Euros are already on the other side.
This wonderful summary of the panorama of our use of the ocean/atmosphere/biosphere system fails to acknowledge that the great acceleration in use parallels the acceleration of wealth creation, including the taming of human population growth as a product of increased wealth, health, and knowledge. Thus it obscures the necessary solution: benign energy production to continue the great acceleration.
-
scaddenp at 05:52 AM on 9 April 2015Models are unreliable
"please site some data backing your claim". Certainly, but which claim? That monthly temperature for a station can be estimated accurately? Or that climate model is boundary value model not initial value model. Or that difference between summer and winter is due to differing energy input? Or which claim? As to sealevel - well in your model you should be able to use it to give response to given storm event. Ie the rainfall for a storm event is an input. I would expect that you could use it to give a range of response to different sized storm events. The sealevel estimates you are looking at are just that - range of estimates for different emission scenarios. Each scenario has its own error estimate but dont confuse the range for different scenarios with error. Climate models certainly do not predict what humans will emit in the future.

Prev 593 594 595 596 597 598 599 600 601 602 603 604 605 606 607 608 Next


