


 Arguments


Recent Comments
Prev 596 597 598 599 600 601 602 603 604 605 606 607 608 609 610 611 Next
Comments 30151 to 30200:
-
Bob Loblaw at 08:21 AM on 4 April 2015Understanding adjustments to temperature data
Although I am not in disagreement with what has been disucssed in the last few days, there is another characteristic of temperature sensors that has been missed. Although the previously-mentioned accuracy of +/-0.1C is fairly typical of meteorological sensors, that accuracy specification does not quite mean what some seem to be assuming it means.
For example, Vaisala is a manufacturer of very commonly-used meteorological sensors, and they make a combined humidity/temperature probe (HMP155) that is in widespread use. It specifies a +/-0.1C accuracy. That value, however, is not a random error for a single reading from the instrument - it is the random error for a large number of instruments over the temperature range in question. What that means is if that you buy 100 HMP155s, they will all tell you the same temperature to within +/-0.1.
For a single sensor/instrument, however, the error is not particularly random. A specific sensor will typically be a bit high or a bit low, and will remain at a pretty constant offset from the real temperature. So, when looking at a change in temperature, you can accurately detect a very small change, even though you're not quite sure of the exact temperature itself.
Mathematically, the error in the temperature change is related to the error in each reading as follows:
deltaT + errordeltaT = (T2 + error2) - (T1 + error1)
which makes
errordeltaT = error2 -error1
If error2 and error1 are the same, there is no error in the difference. Note that the above equation applies to one specific pair of readings, not the distribution of errors for a large number of readings.
The key factor, when considering the distribution of errors (i.e., what errors are expected from a large number of pairs of readings) is the covariance between errors. If the covariance is zero (the two errors are completely independent) then we have random errors, and the whole averaging process described above will apply. When the two errors vary in lock-step, the sensor can have very poor absolute accuracy and still detect small changes accurately from a single pair of readings. WIkipedia's Propagation of Uncertainty page does a reasonable job of discussing some general principles.
Given that any normal weather station and network of stations will keep a single instrument installed at a single station for a long time, it is the error relationship for that individual that is important. Even at a single station, over a short period of time, temperature changes can be measured accurately.
-
Tom Curtis at 07:04 AM on 4 April 2015Sea Level Rise is Spiking Sharply
anthropocene @22, the impression of increased amplitude of fluctuation arises almost entirely from the reduction in sea level associated with the 2011/12 La Nina. By one measure, that is the strongest La Nina event in on record (for a record going back 130 years). It is also a single event. I would wait a few years to see whether or not it is an aberration or signals the start of greater osscillations before drawing any conclusions about the damping.
-
Tom Curtis at 06:59 AM on 4 April 2015Sea Level Rise is Spiking Sharply
ranyl @19, sorry for the delayed response.
I now get were you are coming from, and yes, the undercutting of grounded ice shelves by warm water at the base of the ice shelf will initially reduce the volume of water and hence promote a fall in sea level. That is due not only to the relative densities, but because the excess water above the undercut remains supported structurally by the grounding of the ice. When the undercut is sufficient, however, that structuraly integrity will be lost, with the result of an overall increase in sea level.
Having accepted that, however, I will point out that most ice shelves are actually floating (as with the Ross Ice Shelf as illustrated below), so that this mechanism does not apply. melt of the underside of a floating ice shelf will result in the ice riding lower on the water, with an overall slight rise in sea level. Because of that, and because the collapse of the ice shelf will progress more or less continuously with melt back even of grounded ice sheets, I do not think the mechanism you indicate will be important, and will always be outweighed by other effects.

You are correct that the reduced volume of the water once melted at the grounding line will draw in more warm water. Further, the newly melted water will be bouyant because less dense then the salt water. Consequently it will rise away from the melt point, thus drawing in more warm water. I suspect that this, by volume, is the larger effect, and is certainly the mechanism discussed in popular explanations by the experts, however, the mechanism you describe will also operate.
Finally, I do not think this will result in sudden jumps in sea level rise, primarilly because the total effect is so small.
-
Tom Curtis at 06:33 AM on 4 April 2015We must defend science if we want a prosperous future
ralbin @1, in Australia at least, deconstructionism is a pervasive feature of the academic left, and consequently highly influential on policy development if not on the thought processes of ordinary Australians. Further, the teaching of deconstructionist perspectives has penetrated deep into the pre-university curiculum. The result is pernicious in both cases. I strongly suspect the same is true in parts of Europe, particularly France. The tragedy is that straightforward evidence based reasoning strongly supports a left wing point of view. The influence of deconstructionism weakens the left wing of politics.
-
DSL at 02:31 AM on 4 April 2015We must defend science if we want a prosperous future
Say rather "deconstructionism" is a largely inconsequential technique or strategy. Unless, of course, it appears as a feature of postmodernity. Postmodernity isn't a choice, though. It's what happens when, to quote Jameson, people "attempt to think the present historically in an age that has forgotten how to think historically in the first place." History becomes a sort of commodity or means to produce exchange value or to protect the flow of capital. History is altered, taken apart, reconstructed to fit and encourage the dominant narrative of the production of capital. The more we help people understand their conditions, and help them understand their own roles in developing the historical narrative that contains but is not manipulated by the narrative of capital, the more we help create a culture capable of collectively grasping the reins of the long-term future of the species.
It seems unlikely that we'll be able to do that. Nature, that overarching narrative we think we've moved beyond, will likely lend a violent hand in encouraging the critical thinking skills of the general public, unless such violence ends up associated with various deities. We're not good at taking responsibility right now.
-
ralbin at 01:51 AM on 4 April 2015We must defend science if we want a prosperous future
A bit of false balance here. Deconstructionism is a largely inconsequential movement, though it may be different in Australia, with very little impact on this particular debate. Any problems produced by the "intellectual Left" pale by comparison with the shameless activities of conservative politicians and their enablers.
-
BojanD at 21:42 PM on 3 April 2015Ipso proves impotent at curbing the Mail's climate misinformation
ryland, I suppose they could do that. But just because they could do something else doesn't make the alternative they chose deceptive. It's not even remotely similar to what Rose did, which was deliberately deceptive.
-
Tom Curtis at 20:42 PM on 3 April 2015Understanding adjustments to temperature data
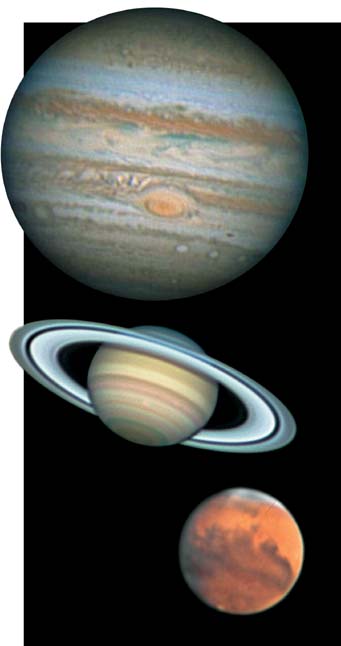
Leto @56, the most stunning use of these principles I know of actually comes from amateur astronomy. In a new technique, amateur astronomers take thousands of images of the object they are interested in. They then use computer programs to "average" the images. The result is an image far sharper than any of the individual images used, and indeed sharper than they could achieve with the same exposure time using conventional techniques. For example, these three images were taken on a 16 inch newtonian telescope:
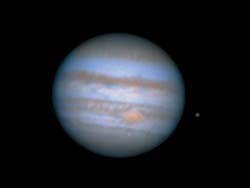
And this is one of the individual images from the "stack" used to create the Jupiter image above:
The truly amazing thing here is that not only does averaging bring out a far higher resolution image, but without the introduction of noise by the atmosphere, all the images in the stack would be identical, and no image improvement would be possible. So, in this case not only does averaging eliminate noise, and allow a far higher resolution than is possible by the original instruments, but the noise is in fact necessary for the process.
-
Leto at 19:08 PM on 3 April 2015Understanding adjustments to temperature data
Quick,
As a demonstration of what Tom Curtis and Tom Dayton have been sayng, I wrote a quick Java program. It produces 5000 random values between 0 and 20, computes the average and then "warms" them by adding 0.002 to each value and recomputing the average. Not surprisingly, the new average is close to 0.002 above the old one (some errors creep in because of Java inaccuracies - these could be fixed with a more sophisticated approach.)
When the initial and adjusted values are accessed through surrogate values that have been rounded to the nearest 0.1, the difference between the averages is still very close to 0.002 - even though most of the rounded values are the same before and after the warming, just enough are increased that, on average, the 0.002 warming can be recovered.
Typical output:
Test of ability to measure difference of 0.002 with 5000 instruments rounded to nearest 0.1
Start with 5000 random values in range 0 to 20
Sample:
Baseline Warmed
17.555315017700195 17.557315017700194
6.136661529541016 6.138661529541015
12.851906776428223 12.853906776428223
18.39383888244629 18.395838882446288
3.099104166030884 3.1011041660308836
5.749928951263428 5.7519289512634275
18.21527862548828 18.21727862548828
2.304227352142334 2.3062273521423338
5.495196342468262 5.4971963424682615
7.890586853027344 7.8925868530273435
Average of initial values 10.034636362266541
... add 0.002 to each value
Average of new values 10.036636362266911
True difference 0.00200000000037015Now round initial and final data sets to nearest 0.1...
Sample:
Baseline Warmed
17.6 17.6
6.1 6.1
12.9 12.9
18.4 18.4
3.1 3.1
5.7 5.8 *
18.2 18.2
2.3 2.3
5.5 5.5
7.9 7.9
Average of rounded values 10.034260000000016
Average of rounded new values 10.036380000000015
Measured difference derived solely from rounded values 0.0021199999999996777
Output is different every time, but the general principle holds.Code below:
/////////////////////////////////////////////////
import java.util.Random;
public class Average {
static double[] values ;
static double[] newValues ;
private static final int NUMVALUES = 5000 ;
static Random random = new Random();
public static void main(String[] args){
System.out.println("Test of ability to measure difference of 0.002 with " + NUMVALUES + " instruments rounded to nearest 0.1\n") ;
System.out.println("Start with 5000 random values in range 0 to 20" );
values = new double[NUMVALUES] ;
newValues = new double[NUMVALUES] ;
for(int n=0; n<NUMVALUES; n++){
values[n] = random.nextFloat()*20;
newValues[n]=values[n]+ 0.002d ;
}
double average = Average(values) ;
double newAverage = Average(newValues) ;
double[] roundedValues = Rounded(values) ;
double[] roundedNewValues = Rounded(newValues) ;
double measuredAverage = Average(roundedValues) ;
double newMeasuredAverage = Average(roundedNewValues) ;
System.out.println(" Sample:\nBaseline\t\tWarmed" );for(int n=0; n<10; n++) {
System.out.println(" " + values[n] + "\t " + newValues[n] );
}
System.out.println(" Average of initial values " + average);
System.out.println(" ... add 0.002 to each value ");
System.out.println(" Average of new values " + newAverage);
System.out.println(" True difference " + (newAverage-average)) ;
System.out.println();
System.out.println("Now round initial and final data sets to nearest 0.1..." );
System.out.println(" Sample:\nBaseline\tWarmed" );
for(int n=0; n<10; n++) {
System.out.print(" " + roundedValues[n] + "\t\t" + roundedNewValues[n] );
if(roundedValues[n]!=roundedNewValues[n])
System.out.print(" *");
System.out.println();
}
System.out.println(" Average of rounded values " + measuredAverage);
System.out.println(" Average of rounded new values " + newMeasuredAverage);
System.out.println(" Measured difference derived solely from rounded values " + (newMeasuredAverage-measuredAverage)) ;
}private static double Average(double[] vals){
int len = vals.length ;
double sum = 0 ;
for(int n=0; n<len; n++){
sum+=vals[n];
}
return sum/len ;
}
private static double[] Rounded(double[] vals){
int len = vals.length ;
double[] rounded = new double[len] ;
for(int n=0; n<len; n++){
rounded[n] = (int)(vals[n]*10 + 0.5f);
rounded[n]/=10f ;
}
return rounded ;
}
}/////////////////////////////////////////////////
-
Tom Curtis at 18:45 PM on 3 April 2015Understanding adjustments to temperature data
scaddenp @54, the ERSST v3 introduced the use of satellite data, but in v3b, they ceased using satellite data as it introduced an identified spurious cold trend due to difficulties in determining clear sky conditions. I do not have access to the full paper of Huang et al (2014) so I don't know if v4 reintroduced satellite data again. I note, however, that satellites are mentioned only twice in the abstract, once with reference to an institutional affiliation, and once with reference to a cross product comparison. That suggests that they have not.
As a side note, Liu et al (2014) is the estimate of uncertainty for ERSST v4 - further ammunition for Quick if he still needs it ;)
-
scaddenp at 17:59 PM on 3 April 2015Understanding adjustments to temperature data
Tom, my reading of the metadata for ersst is that they use satellite data from 1985, since v3 as well as icoads and Huang v4 change method but not input.
-
Tom Curtis at 09:42 AM on 3 April 2015Understanding adjustments to temperature data
Glenn Tamblyn @52, until recently GISS used surface observation based data for SST except for the last few years in which they used satellite based data. They now use NOAA ERSST which in turn is based on ICOADS, a dataset of surface based observations. The HadCRUT4 index uses the HadSST3 dataset for SST, which is in turn also based on ICOADS. The NCDC (NOAA) uses the ERSST. BEST (Berkeley) uses HadSST3. UAH and RSS use satellite observations exclusively, but observer the atmosphere rather than the surface, and hence do not have observations of SST directly. Consequently I am unaware of any commonly used temperature series that currently uses satellite observations of SST.
-
Glenn Tamblyn at 09:08 AM on 3 April 2015Understanding adjustments to temperature data
Quick
And another point to remember for future reference. 70% of the world is oceans and the major temperature series are land and ocean combined data. Land surface air temperatures and ocean sea surface temperatures. Much of the recent peak was due to warmer SST's, particulaly in the north pacific.
And SST's are measured by satellites, not RTD's.
-
anthropocene at 08:58 AM on 3 April 2015Sea Level Rise is Spiking Sharply
It seems that the comments and the original article are missing the most striking aspect of the graph. The graph looks like a heavily damped system with a relatively weak forcing acting on it. However in the last few years the impact of the forcing has had a much bigger effect causing bigger fluctuations in the SLR. Classically this could be because of two things: the damping has decreased or the forcing has increased. Since I assume the damping comes mainly from the sheer size of the oceans which hasn't changed the change in behaviour must be caused by an increase in the forcing. The article implies that El Nino/La Nina has a large role to play but the current fluctuation is much bigger than that of the 'super' El Nino of 1998. So is what is currently going on bigger than 1998 or is another factor adding to the forcing? e.g. El Nino conditions cause more ice melt?
-
John Hartz at 07:52 AM on 3 April 2015Global warming and drought are turning the Golden State brown
Recommended supplemental reading:
California Tuolumne snowpack 40 percent of worst year by By Alan Buis,
Jet Propulsion Laboratory, NASA Global Climate Change News, Apr 2, 2015 -
Quick at 06:10 AM on 3 April 2015Understanding adjustments to temperature data
Tom Dayton. Great explanation! Thanks again. "Stefan_Z" has gone off the grid since I slapped him with some of this info that you and Tom C. provided.
My mission continues: "Saving the world from willfull ignorance, even if it's only one denier at a time."
-
Tom Dayton at 03:36 AM on 3 April 2015Understanding adjustments to temperature data
Quick, a simple(istic) explanation of the Law of Large Numbers applied to this case is that each temperature measurement is a sample from the infinitely-sized population of all possible measurements of the "true" temperature value. Each measurement probably is erroneous in that probably it differs from the true temperature. But each measurement is randomly erroneous in direction and size from the true temperature, so a collection of those sample measurements will have some measurements' errors cancel out other measurements' errors. The probability of that collection of measurements completely cancelling its errors--and so revealing the true temperature--increases as the size of that collection grows. Therefore growing the size of the collection narrows the range of temperatures in which we can be "confident" the true temperature lies--no matter what probability/certainty you prefer as your definition of "confident." To use an example with less emotional baggage than global temperature, consider flipping a coin to find its true probability of coming up heads. The more trials you run (i.e., the more flips, the more measurements), the more likely that the averages of the numbers of flip results (heads vs. tails) are the "true" values.
-
Quick at 03:06 AM on 3 April 2015Understanding adjustments to temperature data
Thanks again, Tom Curtis (and Tom Dayton)! I spent a copious amount of time trying to get info like this by simply Googling, but wasn't getting much...
-
ubrew12 at 02:58 AM on 3 April 2015Climate sensitivity is unlikely to be less than 2C, say scientists
"Other scientists argue "transient climate sensitivity" is a more policy-relevant measure" because the policy of ignoring the effects of AGW, like the now-melting permafrost, has worked 'so well' in the past.
-
Tom Dayton at 01:45 AM on 3 April 2015Understanding adjustments to temperature data
Quick, for more on Tom Curtis's explanation, look up the Law of Large Numbers.
-
Tom Curtis at 01:33 AM on 3 April 2015Understanding adjustments to temperature data
Quick @46, GISS (NASA) do not collect any thermometer records themselves. Rather they use the data collected by NOAA for the Global Historical Climate Network (GHCN), plus some additional stations in Antarctica an one additional station in Germany. In the US, the GHCN stations are just the US Historical Climate Network (USHCN) stations, with the data again collected by NOAA, and I believe much of it administered by NOAA. Elsewhere in the world, the data will come from various national meteorological stations.
As to which sensors are used, a whole host of different sensors both in different countries and within countries are used. All are approximately equivalent to thermometers in a Stevenson screen, but each will have their own error in measurement. GISS (and the NCDC) take that initial error rates and calculate from it the error in their overall temperature index using techniques similar to those I illustrated. It is not a simple as my illustration because not all instruments are the same, and the calculations are not taking simple averages. However, they are taking an average of a sort so that with a large number of station records, the error becomes a small fraction of the error of individual stations for reasons exactly related to those I illustrated.
The crucial point here is that denier you quote is ignoring the most fundamental fact about error propogation with respect to averages, while boasting of his great knowledge of the topic. His argument simply does not hold water. In contrast to his bombast, however, GISS, and the NCDC, and the Hadley Center and CRU teams, and the BEST team, and the JMA have all tackled these issues, worked out the error correctly, and published their methods and results in peer reviewed literature. And all five teams get essentially the same results with only slight divergences based on the data sets and methods used.
-
Quick at 00:05 AM on 3 April 2015Understanding adjustments to temperature data
Thanks Tom. Are the NASA sensors used only for US temps? If not, what other type of instrumentation is used by the GHCN and for SST measurements?
-
billthefrog at 23:53 PM on 2 April 2015Sea Level Rise is Spiking Sharply
sgbotsford #10
"Education please:"
I'm afraid that I honestly don't know how to take your comment, as there are at least two diametrically opposed interpretations.
Interpretation 1) It could be taken as someone simply saying ... "I don't believe it's possible to make such measurements, and here's some throwaway remarks as a form of justification", or, in its more basic form "I don't understand that, therefore nobody can understand that, therefore it ain't true".
If that's the case, there's no point trying to respond beyond what Tom C and CBD have already said.
Interpretation 2) On the other hand, your question could be entirely genuine, and I could be utterly misreading the tone of your remarks. In which case, please ignore Interpretation (1), and read on ...
If you want to see some introductory stuff about the measurement of sea level, a very simple starter would be this article in National Geographic. In addition, there is a reasonable Wikipedia article on Sea Level which discusses some of the points you make. Both articles make reference to the 19-year Metonic cycle, by which you can easily grasp that sea level measurement takes time - lots of it!
At a somewhat more advanced level, you could try ploughing through the voluminous material produced by the Permanent Service for Mean Sea Level. The PSMSL is part of the UK's National Oceanograhy Centre in Liverpool.
The link provided takes you to their sea level training page. From there, you can access some very detailed material. For example, Vol 1 of the training manual goes to about 60 pages - before the Appendicies.
cheers bill f
-
billthefrog at 22:45 PM on 2 April 2015Sea Level Rise is Spiking Sharply
ranyl #20
If you're interested in the effects of sea ice melt, there was some discussion on John Hartz's Weekly Roundup 11a. The relevant portion starts at about Comment # 11.
cheers bill f
-
CBDunkerson at 22:20 PM on 2 April 2015It hasn't warmed since 1998
JohnD wrote: "Perhaps a major issue is only the poor predictions are making it to the media..."
You have yet to identify, let alone substantiate, even one of these supposed 'poor predictions'. Until you do so it is not 'pretentious and condescending' to dismiss your position... because you have not presented a position.
Try to look at it from the other side. People who do not consider themselves to be acting on "blind faith" and "religious-type fervor", but rather accepting the strong scientific consensus based on the overwhelming evidence. Then you come in proclaiming that they are all wrong, while refusing to cite any evidence for your position and ignoring evidence to the contrary provided to you. Some might call such behaviour 'pretentious and condescending'.
If they were being kind.
-
CBDunkerson at 22:01 PM on 2 April 2015Scientists link Arctic warming to intense summer heatwaves in the northern hemisphere
Watchdog wrote: "IF that "red" data is true, than, yes, it's at least an eye-opener."
In addition to Tom's point about having used the most extensive data set... it really doesn't matter. BEST, UAH, RSS, HadCRUT, GISS, NCDC, et cetera... you could use any of the different surface temperature data sets and at the scale shown on that graph the differences would barely be visible. That is, they all show the recent warming spike being greater than anything in the pre-industrial proxy records.
So there really is not any question "IF" that data is true. The surface temperature datasets produced by skeptics (e.g. UAH & BEST) show results virtually identical to the various government and other independant datasets.
-
Watchdog at 21:24 PM on 2 April 2015Scientists link Arctic warming to intense summer heatwaves in the northern hemisphere
RobH@42, TomC@44 - Thank you for your informative responses.
-
ranyl at 20:49 PM on 2 April 2015Sea Level Rise is Spiking Sharply
"2) The melting of floating ice actually raises sea level slightly due to the different densities of saline water (as found in the sea) and fresh water (as found in ice). Grounded ice, which by definition is not floating, and hence has more volume than an equivalent area of barely floating ice must raise sea level rise even more. Ergo when grounded ice is undercut be melting, that melting provides sufficient water to fill the cavity, and then some."
Thanks Tom for the area expansion calculations, a small effect the sea is huge.
On the above I'm not sure that the melting of below sea level seabed grounded ice will raise sea levels.
1029 kg/m3 Sea Water
999 Kg/m3 Density of fresh water
916 Kg/m3 Density of Ice
For from these figures if you melt a 1m3 of ice you produce 916kg of freshwater, which occupies a volume of 0.917m3, leaving a volume of 0.083m3, or ~8% of the original volume of the seabed grounded ice has to be replaced with sea water. Therefore 8% of whatever volume that is being melted at the bottom of the seabed grounded ice sheet needs to be replaced by incoming sea water? ...?
Lastly if this 8% replacement is the case, I wonder if this dynamic volume deficit may also draw the sea water in, and as the low density fresh water also needs to be replaced as it floats away it alsodraws in bottom waters, and I wonder if this drawing in affect may accelerate the bottom melting to a degree, as the drawn in bottom waters are also warmer than the fresh water being replaced?
For the query on the possibility of more sudden jumps in sea levels and the undermining melting of seabed based icesheets, I wasn’t meaning the floating ice shelves; I was talking of icesheets themselves that are seabed grounded. I am asking basically, can undermining the supporting below sea level part of the seabed grounded icesheet possibly result in large side collapses of the above sea level part of the icesheet as its underlying support structure is melted away, raising sea levels more abruptly?
Yes William I agree the additional sea level to coast lines away from the Antarctica and Greenland icesheets melt and stop pulling water towards themselves is a worry. 1m of additional seawater volume melted from the icesheets doesn’t mean a local sea level rise will be anything like 1m and there will even be falls in sea level in areas around Greenland and Antarctica as a result.
Also over the longer term the depressions the icesheets are sitting in, are going to flatten out again as the immense weight of the icesheet are removed. This now sunken ground wasn’t below sea level when the ice started accumulating, it was that the weight of the icesheet as the ice accumulated that sank the ground it sat on and thus formed the below sea level hollow the seabed grounded icesheets currently sit in. I do wonder what the seismic consequences of a rapid melt will be; what does the rate of removal of the weight of an ice sheet have an effect on the seismic response? Quick removal sudden larger seismic events slow removal slow adjustments?
-
billthefrog at 20:40 PM on 2 April 2015Matt Ridley is wrong again on fossil fuels
As I was starting to articulate some thoughts on this thread, I was overtaken by a strange sense of déjà vu.
Checking the SkS archives threw up (tee hee) many references to Ridley, in particular a piece that Dana wrote in January of this year. Any reader unfamiliar with Ridley may find it profitable to peruse that posting in conjunction with this one.
Nothing has changed in the interim that would even remotely lead me to consider revising my comment (#3) on Dana's earlier thread.
cheers Bill F
-
Tristan at 19:44 PM on 2 April 2015Understanding adjustments to temperature data
FWIW I think a post specifically referencing the point Tom just made would be productive.
I've spent a lot of time in denierville and a regular assertion is 'You can't get temps/sea-level etc to 3 sig figures when instrumentation is barely accurate to the nearest degree. -
PhilippeChantreau at 16:11 PM on 2 April 2015Scientists link Arctic warming to intense summer heatwaves in the northern hemisphere
Perhaps others have not noticed watchdog, but I was amused to see how you went from an unsupported argument of Arctic climate, to side-stepping the very real and very objective notion of statistical significance to now shifting to global climate.
As for ice, it is really irrelevant how you want to measure it. You still can not pull together any evidence that the increase you trumpeted earlier exists. I see no point wasting any more time.
-
One Planet Only Forever at 14:50 PM on 2 April 2015Matt Ridley is wrong again on fossil fuels
Matt Ridley can be debunked just by addressing his opening salvo.
"To throw away these immense economic, environmental and moral benefits, you would have to have a very good reason. The one most often invoked today is that we are wrecking the planet’s climate. But are we?"
There is no moral justification for a few among a generation of humanity getting way with benefiting form activities that the rest of humanity will not be able to benefit from through the hundreds of millions of years this amazing planet will be habitable. And it is immoral for anyone to try to excuse a few in this generation benefiting as much as they can get away with through the fatally flawed economic system of profitability and popularity.
-
Tom Curtis at 13:48 PM on 2 April 2015Understanding adjustments to temperature data
Quick @40, suppose you have a single instrument with an accuracy of 0.1 C. Then for that station the best accuracy we can have is 0.1 C, and other factors may cause the error to be greater. However, if we want to determine the average temperature of 10 different sites, each using the same type of instrument, the error becomes the error of the average, ie, the square root of the additive sums of each error term, divided by the number of terms. For 10 sites, that turns out to be again 0.1 C. If we increase the number of sites to 100, the error margin, however, drops to 0.0316 (= ((0.1*100)^0.5)/100). With a thousand sites, it drops to 0.01. With 10 thousand sites it drops to 0.00316, and so on.
The USHCN has 1221 stations within the contiguous United States. The error on the simple average of that many stations assuming an instrumental error of 0.1 C is 0.009 C. The GHCN has around 2500 stations, yielding an accuracy for the simple average of 0.006 C. These figures are for the land only temperatures. On top of that there are thousands of SST measurements that go into the Global Mean Surface Temperature.
Clearly your denier's point is invalid. The quoted errors of the GMST are well above that which would be obtained from taking a simple mean. That extra is to account for other sources of error, the accounting of which has been detailed in peer reviewed papers.
-
bozzza at 13:37 PM on 2 April 2015Sea Level Rise is Spiking Sharply
@15, this question begs an equally pointed one : "How long actually is the delay between carbon emission and sea level rise?"
-
John Hartz at 13:35 PM on 2 April 2015Understanding adjustments to temperature data
Quick: If you have not already challenged your opponent to document all of his assertions, you should immediately do so.
-
Quick at 13:19 PM on 2 April 2015Understanding adjustments to temperature data
I tried to steer the guy here to Zeke Hausfather's guest post , but to no avail...
-
Quick at 13:15 PM on 2 April 2015Understanding adjustments to temperature data
Above post is by Stefan_Z in a Yahoo comments section
-
Quick at 13:12 PM on 2 April 2015Understanding adjustments to temperature data
Question: What specific instrumentation is used to measure global surface temps? ...and what percentage of all global temps are taken by NASA using the referenced sensors in the post below?
THe reason for asking is that I ran into a very belligerent and persistent denier who claims to work with a sensor that is very similar to the same that NASA uses and here are his claims in this post:
" NASA is on record stating that 2014 was the "hottest" on record since 1888. And 2014 was supposedly just 0.02 degrees C hotter than 2010 which is the next "hottest" year per NASA's dubious claim. Now, once again you stupid dunce! Platinum resistance temperature devices (P RTDs) are only accurate to +/- 0.1 degrees C from 0c to 150c, and +/- 0.15 degrees C from 0c to -30c per the IEC 60751 document. This is basic mathematical statistics your stupid head should have learned in high school. That is why when the lying director of the Goddard Institute of Space Science (GISS),(deleted text) Gavin Schmidt, is ON RECORD as stating that the claim of 2014 being the hottest was stated with just a 38% level of statistical certainty. I and others with a university level of mathematical education are not fooled by such a hokey statement, but Schmidt knowingly staked that claim so that gullible AGW drones like you would have something to eat up. It still amazes me that that there are buffoons like you that think anybody can derive a 0.02 C degree of precision from a device that is +/- 0.1 at best, not including the root mean sum squared addition value that the data acquisition electronics adds too it's error summation by about another one percent."
-
william5331 at 12:20 PM on 2 April 2015Global warming and drought are turning the Golden State brown
Perhaps they should start thinking about sea water greenhouses.
http://mtkass.blogspot.co.nz/2007/09/i-wish-id-thought-of-that-growing.html
-
william5331 at 12:16 PM on 2 April 2015Sea Level Rise is Spiking Sharply
Sgbostsford. A way of measuring the average height of a fluxuating sea is to use a stilling well. It is essentially a bunch of culverts with its joints sealed up and with a cement bottom which is sunk vertically near the sea. It is connected to the sea by a thin pipe and a depth measuring device is set on the platform on the top. For averaging the average of the first well, you can have a second stilling well off the first.
-
william5331 at 12:12 PM on 2 April 2015Sea Level Rise is Spiking Sharply
Ranyl
Possibly the greater effect as the Antarctic ice sheet melts will be the decrease in the sidways force of gravity, pulling the water toward Antarctic and causing sea level to rise around the world
-
bozzza at 11:53 AM on 2 April 2015Sea Level Rise is Spiking Sharply
The question is .. "..do we observe a regular doubling period?"
-
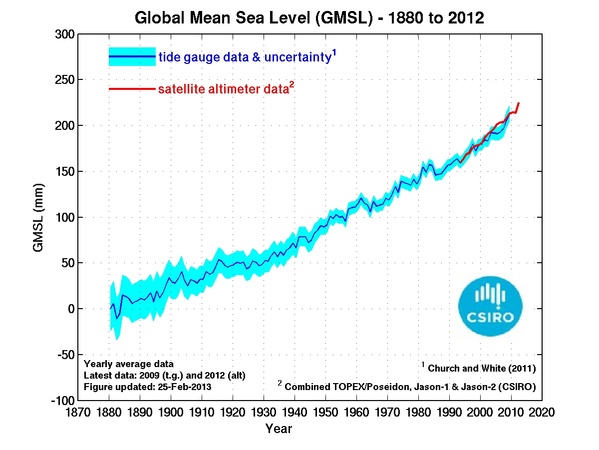
BC at 11:35 AM on 2 April 2015Sea Level Rise is Spiking Sharply
Interesting article thanks. I had noticed the increase on the AVISIO site but hadn't realised that reduced rainfall in the tropical basins was a significant cause. I had assumed it was warmer surface water expansion and/or more ice melting.
The sea level graphs are so smooth compared to the global temperature - there's no hiatus with slr. It's been relatively smooth but gradually curving further upwards since 1880 as shown on the CSIRO site below (go to the bottom of the page)
-
Tom Curtis at 09:54 AM on 2 April 2015Scientists link Arctic warming to intense summer heatwaves in the northern hemisphere
Watchdog @41, the reconstructions are temperature reconstructions. Not " litho-, hydro-,cryo-,atmo- and bio- sphere" reconstructions. There is no reason we should not have reasonably accurate reconstructions of GMST. As to updating, Loehle 2007 contained some outright blunders in processing (regardless of the merits of the data selection and methods). Loehle and McCulloch 2008 merely corrected those blunders. It is more in the nature of errata than a new paper. However, reconstructions have in general improved with time due to more proxy series becoming available, and improvements in mathematical techniques. That is the nature of science, which goes from knowing less to knowing more. When MBH 98 was first published, almost nothing was known about techniques of reconstruction, and few proxies were available. So of course later papers do better.
As regards the red data, it is the instrumental record from the group that uses the most data (ie, station records) and arguable the best mathematical methods (and certainly better than those used in HadCRUT4).
Finally, Greenland has not been green except for a few marginal areas for 100 thousand years (at least). Those marginal areas, in turn, only supported marginal cropping in the MWP, and support a higher level of agriculture now. If you mean to say that Greenland was green in the MWP, then it is green again already:

-
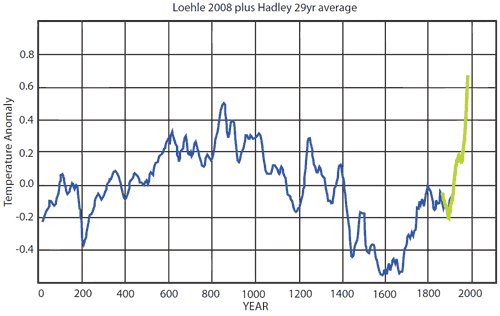
Tom Curtis at 09:38 AM on 2 April 2015Scientists link Arctic warming to intense summer heatwaves in the northern hemisphere
Rob Honeycutt @40, the crucial difference between your and my graphs is that I used BEST's annual values, whereas you used a rolling 29 year average. Due to a coincidence and the different baselines used (you used Loehle's, I used BESTs) that results in approximately the same final value but a very different seperation between the peak MWP value in the final value on the instrumental record.
From a pixel count, you show 0.17 C difference between that peak, and the final instrumental value. I show 0.33 C difference, and would have shown a 0.09 C difference had I used a 29 year average. In Standard deviations of the error for Loehle 2008, that is 1.25, 2.45 and 0.8 Standard Deviations respectively. In all cases the final instrumental value is greater than the peak MWP reconstructed temperature (contrary to Spencer's graph shown by Watchdog).
It is often assumed that we should show a 29 year rolling mean of the instrumental values to get a like for like comparison with Loehle's reconstruction, which uses a 29 year smooth of the proxy data for the reconstruction. I don't think that reasoning is correct. The primary reason is that increasing the number of proxies (or instruments) smooths the data series. For example, here is a global surface temperare record derived from just 60 long record rural stations compared to CRUTEM3:

The rural stations show far more year to year variation relative to the full data record. Loehle, of course, did not use 60 proxies but just 18. Therefore he has preserved a large amount of variation simply by his limited range of proxies - a problem exacerbated by the biased geographic range of his proxies. Ergo the instrumental record is already effectively smoothed relative Loehle's reconstruction due to using so many stations. The additional 29 year smooth therefore does not result in a like for like comparison, when by "like" we compare level of smoothing.
Put another way, had Loehle used a thousand proxies, globally distrubuted, nearly all of the variation at less than a centenial scale would have likely been smoothed out by the increased number of proxies. That is particularly the case as the increased number would include a very high proportion of SST proxies rather than the just one (?) used by Loehle. With that number of poxies, a comparison with the 29 year instrumental mean would have been like for like. With just 18, it is simply a distortion.
The second factor is that nearly all people looking at the graph will interpret the final instrumental value as "now", rather than the mean of a 29 year period centered 15 years ago and including two major volcanic erruptions in the period. That intuitive interpretation is just wrong, and amounts to the assumption that, starting now, temperatures will fall for 29 years as rapidly as they rose over the last 29 years (an absurd proposition even for most educated deniers). This does not in itself mean we should not use a 29 year mean, but it does mean we should always include the annual values as well to prevent that distortion. Or at least, that is my opinion.
-
Rob Honeycutt at 09:33 AM on 2 April 2015Scientists link Arctic warming to intense summer heatwaves in the northern hemisphere
Shall GreenLand therefore return to Green in the near future?
That's unlikely to happen for quite a while, because (a) it will take many centuries to melt the ice, and (b) the land under the ice has been scoured clean of anything that would support plantlife. It will take many millennia to build back an environment that could sustain any thing green.
-
Watchdog at 09:19 AM on 2 April 2015Scientists link Arctic warming to intense summer heatwaves in the northern hemisphere
Tom C .. I've no trouble accepting your statement: "Taken alone, anything could be considered a 'poor measure of global climate'. Because the global climate includes the totality of litho-, hydro-,cryo-,atmo- and bio- spheres. That's why climate science looks at multiple lines of evidence within each domain, in order to examine what is happening."
It's an extension of the line of thought that I'd presented when ultimately suggesting that all Global Ice Volumetric Fluctuations should be taken into consideration at the same time.
Tom.. I'm not married at all to Loehle, 2007, per se.
It is somewhat disquieting to encounter a constant string of Climatology papers constantly becoming considered \null and void by the constant string of newer papers. That fact makes me skeptical of the "red" portions of the acknowledged less-than-perfect Loehle, 2008
IF that "red" data is true, than, yes, it's at least an eye-opener.
Shall GreenLand therefore return to Green in the near future? -
Rob Honeycutt at 08:38 AM on 2 April 2015Scientists link Arctic warming to intense summer heatwaves in the northern hemisphere
Not to dogpile, but here is the version of Loehle with HadCRU3 a few years ago. Seems to agree with Tom Curtis' version. And when I created my version, I shared with Dr Loehle before posting and he agreed it was accurate.
-
Stephen Baines at 07:37 AM on 2 April 2015It hasn't warmed since 1998
And a third point. I'm a bad typist.
-
Daniel Livingston at 07:28 AM on 2 April 2015Why I care about climate change
I love this site! Thank you to all contributors.
I share similar motivations to those of John Cook, as a Christian and a father, for my concern about climate change. I've put together a video looking at climate risk management from my Christian perspective.
Prev 596 597 598 599 600 601 602 603 604 605 606 607 608 609 610 611 Next


