


 Arguments


Recent Comments
Prev 600 601 602 603 604 605 606 607 608 609 610 611 612 613 614 615 Next
Comments 30351 to 30400:
-
Tom Curtis at 13:07 PM on 26 March 2015New measurements confirm extra heating from our carbon dioxide
jja @17, Feldman et al measured the surface radiative forcing of CO2. The total surface radiative forcing will have been larger than that. Therefore, for comparison I compared it with the radiative forcing of CO2. The net TOA energy flux that you discuss includes the total forcing since 1750 from all sources, minus the increase in net upward energy flux due to increases in GMST including feedbacks on that temperature increase.
-
Watchdog at 13:05 PM on 26 March 2015So what did-in the dinosaurs? A murder mystery…
KR@80 - My Apology for my sometimes opaque grammar.
No.. I am not saying CO2 causes Cooling
Nor do I agree with this following:
"Long declines in CO2 causes Cooling."
I am saying that Extended Periods of Extreme Cold
are most definitely injurious to the Biota.
I am also saying that Blockages of Solar Radiation from e.g., Volcanism,
will directly cause Lowering of Temps.
With that above statement said,
I'm not saying that COLD is the only cause of injury to the Biota.Nor am I saying: Volcanism is the only cause of Lowered Solar Radiation.
I am saying: Volcanism indeed reduces Solar Radiation / Temperature.
Which brings me to CO2.
CO2 certainly correlates with Temps
- as does Black Carbon aka Soot,
- as does other Climatic parameters.
Refer again to the Vostok Graph of Temp & CO2 @69
and take close note of their correlation...
CO2 is presented as being the cause of Global Warming.
Which brings me to Global Warming
Earth's Temperature is oft-presented as being too Warm for the Biota.I've several questions - and I'll begin with this one:
Has Warm Climate ever been the Cause of mass extinctions? -
Tristan at 11:48 AM on 26 March 2015One satellite data set is underestimating global warming
If UAH (0.139C/dec) underestimates global warming, then RSS (0.122C/dec) underestimates it by even more.
-
John Hartz at 10:48 AM on 26 March 2015So what did-in the dinosaurs? A murder mystery…
John Mason:
More grist for the mill...
Fact or Fiction?: Dark Matter Killed the Dinosaurs by Lee Billings, Scientific American, Mar 25, 2015
-
scaddenp at 09:45 AM on 26 March 2015One satellite data set is underestimating global warming
villabolo - Roy Spencer is not a "young earth creationist". I believe that he is a proponent of "intelligent design" however. (eg see here )
-
jja at 09:31 AM on 26 March 2015New measurements confirm extra heating from our carbon dioxide
Tom
the 0.2 watts per meter squared increase per decade is a good fit for the TOA analysis using Nuccitelli et al 2012 with Durack 2014 reanalysis. However this is a decadal rate of change, not an absolute value.
The absolute value was estimated by Hansen and Sato (2010) using Levitus et. al (2009) data at 0.6 watts per meter squared, corresponding to a median date of 2007.
However, recent NODC 0-2000 meter OHC analysis shows that the lower bound of current TOA radiation imbalance is 1.0 Watts per meter squared. This is a least bound as the rate of TOA is currently increasing and increasing at an increasing rate!
it was your use of the term TOA that threw me off. I have not seen a good analysis of TOA time series except for the one that I have done as an amateur compilation.

-
scaddenp at 09:27 AM on 26 March 2015One satellite data set is underestimating global warming
rocketeer - it would seem the Cornwall Alliance theology conveniently ignores anything concerning divine consequences for human greed and disrespectful destruction of divine creation.
-
villabolo at 08:39 AM on 26 March 2015One satellite data set is underestimating global warming
Roy Spencer also happens to be a "young earth" creationist who believes that the earth is only 6,000 years old. In essence, he doesn't believe in geologic history.
-
Ian Forrester at 08:24 AM on 26 March 2015One satellite data set is underestimating global warming
bjchip, the data discussed in the paper by Stephen Po-Chedley et al. is only looking at the narrow tropical band, 20 degrees north and south of the equator. The SkS calcualtor is looking at global coverage (or at least most of the globe).
-
ranyl at 07:58 AM on 26 March 2015So what did-in the dinosaurs? A murder mystery…
"The evidence points to a distinct warming of the southern mid-latitude atmosphere during the Younger Dryas and a close coupling between New Zealand’s cryosphere and southern high-latitude climate. These findings support the hypothesis that extensive winter sea ice and curtailed meridional
ocean overturning in the North Atlantic led to a strong interhemispheric thermal gradient8 during late-glacial times, in turn leading to increased upwelling and CO2 release from the Southern Ocean9, thereby triggering Southern Hemisphere warming during the northern Younger Dryas."Kaplan M.R. et al (2010), Glacier retreat in New Zealand during the Younger
Dryas stadial, NATURE| Vol 467|9 September 2010http://geology.gsapubs.org/content/early/2013/10/30/G34867.1.abstract
Those guys feel it was the thermohaline stopping that cuased the cooling as well...in 2013 with improved proxies etc...and the evidence for an impact causing it is slimer as each new study is published, check the abstracts here,
YD was most likely due a fresh water lake burst in the North Atlantic, and therefore was akin to Hienrich event, causing SH warming and another outgasing burst in CO2 from the southern ocean which firstly increased the temperature of SH then globally.
http://www.nature.com/ncomms/2015/150106/ncomms6916/full/ncomms6916.html
The rapid warming in Greenland when the meridional circulation turned on again was10C in decades (similair to the cooling rate), and a tad worrying for those arround the North Atlantic really as it also induced quite marked changes in weather patterns and ecosystem dispersions across Europe, Asian (Monsoons), and North America, however it was not a global cooling event for the SH warmed. Although these abrupt changes in the NH climate, combined with the hand of man, does seems most likely scenario for the loss of the Sabre tooths etc.
As for the science being settled about mass extinction. Well it does seem very suggestive that rapid global warming, induced ocean stratification and acidfication do have marked ecosystem impacts (that aspect is settled), however no one says these are the only factors in the major mass extinctions (just an essential one, it seems) for each mass extinction seems to also to have been associated with other climatic disturbances, ozone depletions and an input into the global ecosystem of an array of toxic substances (to release such large amounts of CO2 melting coal filled rock desposits is often part of the volcanic activity, so very toxic stuff being released as you can imagine).
However this is of no comfort for humanity has already induced an extinction rate in keeping with a mass extinction levels, at least, with many estimates that rates are far greater, with current rates being between 100-1000 times the baseline fossil levels.
Therefore we have already induced a totally unprecendented rate of global warming (I stress globally for those still in regional camps), which is at the very least only half complete having had already introduced a vast arrray of toxins, waste and poisons, disturbed the ozone layer, cleared vast areas of land of natural ecosystems, etc, etc etc,.....
Therefore we have a very sick global ecosystem and the additional blow of the combination of CO2 warming and ocean acidification that has a long rap sheet for mass extinction involvement has only just begun in earnest really.
Last time CO2 was 400ppm consistently at 400-450ppm (COe2 ~465ppm) was the Miocene, totally different climatic world back then.
Moderator Response:[RH] Shortened link.
-
rocketeer at 07:52 AM on 26 March 2015One satellite data set is underestimating global warming
Sure, accounting for diurnal drift is important but is there any account for Dr. Roy Spencer's belief that "Earth and its ecosystems—created by God’s intelligent design and infinite power and sustained by His faithful providence —are robust, resilient, self-regulating, and self-correcting, admirably suited for human flourishing, and displaying His glory. Earth’s climate system is no exception. Recent global warming is one of many natural cycles of warming and cooling in geologic history"? (Spencer, Roy W. (signatory and advisor), An Evangelical Declaration on Global Warming, Cornwall Alliance, May 1, 2009) This could certainly influence analysis of satellite topospheric temperature data.
-
Tom Curtis at 07:05 AM on 26 March 2015One satellite data set is underestimating global warming
bjchip @4, the satellite data comes in various channels, each of which measures data from different altitudes, as shown below. As you can see, the instruments cannot pick out a given altitude uniquely, but absorb radiation from a broad range of altitudes, but more strongly at some altitudes than others:
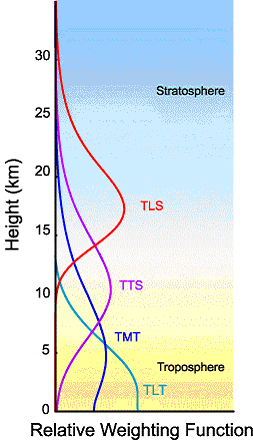
The channel used for the study, the TMT channel, is the lowest actual instrumental record in the satelite data. The TLT channel is an artificial channel made by deriving data from the TMT and TTS (?) channels, and using the later to eliminate temperature information from above the tropopause in the former. Both UAH and RSS use different methods to do this. The SKS trend calculator uses the TLT channel data. The paper, in contrast, compared the TMT data. In doing so they avoided confounding their study with differences introduced by the different methods used by the two groups in calculating the TLT channel.
-
Tom Curtis at 06:48 AM on 26 March 2015New measurements confirm extra heating from our carbon dioxide
jja @15, eyeballing figure 2, CO2 concentrations at North Slope Alaska have grown from 369-385 ppmv, for a calculated increase of 0.227 W/m^2 of forcing, which is approximately the same as the 0.2 W/m^2 increase in surface radiative forcing shown on the trend line (blue).
However, as you challenged the value, I looked at global annual average increases in CO2 from 2000-2010 (368.85-388.57 ppmv) for a global increase of forcing of 0.279 W/m^2. Further, the calculated forcing for the annual average increase for Alert, Alaska (data), is 0.277 W/m^2 . These are not approximately 0.2. Further, the standard formula for radiative forcing of CO2 applies only to global values, and not necessarilly for regional values. Consequently I withdraw my claim.
I will note that using Modtran and the Alert values with the standard cirrus model, there is a 0.09 W/m^2 TOA difference in radiative flux for the sub-arctic summer and winter. On that basis, the standard formula radically over estimates TOA radiative forcing of CO2 in the sub-arctic (including Alaska). Of course, the modtran model at UChicago is obsolete, and I did not set up the model properly to get the change in radiative flux at the tropopause, after the stratosphere had adjusted nor to get all sky values, so the modtran estimate of forcing is very approximate.
-
scaddenp at 06:08 AM on 26 March 2015So what did-in the dinosaurs? A murder mystery…
Also note that while Younger dryas is indeed associated with rapid cooling, the area of rapid cooling is geographically restricted (and absolutely not caused by Milankovich cycles - this can be catagorically ruled out). Volcanic cooling does not persist very long after an event because aerosols are rapidly removed from the atmosphere. Extra CO2 emitted however is very persistant.
I should also point out that the hypothesis that rapid climate change was responsible megafauna extinction is also far from settled science.
-
So what did-in the dinosaurs? A murder mystery…
Watchdog - The article you linked to (published version here) is from 1999 - I dare say we've learned a bit in the last 16 years, in particular details about CO2 feedbacks and lags in glacial/interglacial temperature changes.
And yes, that was my understanding of your post - that you are claiming rising CO2 causes global cooling. If that's indeed your claim, I would consider it quite wrong, contradicted by basically all of known spectroscopy.
If it's not your claim, I would ask that you be a bit more clear about what you are saying. It's been quite difficult to identify what you are arguing.
-
michael sweet at 05:42 AM on 26 March 2015So what did-in the dinosaurs? A murder mystery…
Watchdog,
Thank you for providing a citation for your data so it can be checked.
Looking at your citation I noticed this at the start: "Last modified 14th March 1998". The format of this cite matches your previous posts, so I presume this is what you have been citing all along.
It strikes me that the references in the OP from 2014 are likely to reflect current scientific thought better than your reference from 1998. Perhaps you can cite more recent data to support your claims.
I am not expert on this subject. If I see one person citing references from 2014 and another citing references from 1998 I generally think the more recent references support the argument better. In this case, the OP claims that recent data has contributed to a change in scientific thought. Your old posts cannot help us evaluate recent changes in thought.
-
Watchdog at 05:17 AM on 26 March 2015So what did-in the dinosaurs? A murder mystery…
CBDunderson - I’ve more to say, but first:
My “Is CO2 the Cause of Global Cooling? ” is intended to be construed as a much better phrased: “Does a Rise in CO2 Cause Global Cooling?”
Perhaps KR@67 intended the same understanding when he responded:
“CO2 is a warming, not cooling, influence”
Solar Radiation is the Primary Cause of Temps in the Solar System
What can Cause Abrupt Major Cooling?
IF - by whatever mechanisms, including Milankovitch cycles, Solar Radiation were reduced to (for the sake of discussion) Zero, that would respresent the maximum possible Solar-Cooling effect upon the entire Solar System: Atmosphere’s or Not.
What mechanisms can reduce Solar Radiation received by Earth?
One known occurring mechanism of blockage of Solar Radiation is: smoke, smog, ash, aerosols and other particulates - caused by, e.g., Volcanic Emissions.
How fast could or would Temps fall or rise?
The GreenLand and Antarctic ICE Core graphs show
-> very “rapid” decreases and increases in temperatures.
The Greenland Ice Core Data directly correlates Temperatures with rapid advances and recessions of Glaciations (Solid H2O) - as would be expected.
These events also directly correlate with rapid Ocean Water Levels
What is “rapid”?
We’ve strong evidences from:
1 Graphs — 2 Ocean Levels Fluctuations and — 3 Published papers (plural) — that Abrupt Climate Temperature Changes have occurred in periods of time - far shorter than as someone(s) suggested, 1000 years. I’ve read “in as little as 10 years. Also, “over a few decades”
This Frontnote to the following online paper mentions:
“This represents an earlier version of our text. Some changes have been made since we stopped modifying this web version: e.g. we have added a discussion of the role of volcanic aerosols in sudden climate changes...evidence suggests the rapid cooling at the end of the Eemian interglacial was due to a big explosive volcanic event. Other 'volcanic' cooling events occurred during the Holocene.”
ref: Sudden climate transitions during the Quaternary
http://www.esd.ornl.gov/projects/qen/transit.htmlModerator Response:[JH] Link activated.
I must again remind you that excessive repitition is prohibited by the SkS Comments Policy.
Please note that posting comments here at SkS is a privilege, not a right. This privilege can and will be rescinded if the posting individual continues to treat adherence to the Comments Policy as optional, rather than the mandatory condition of participating in this online forum.
Moderating this site is a tiresome chore, particularly when commentators engage in excessive repitition. We really appreciate people's cooperation in abiding by the Comments Policy, which is largely responsible for the quality of this site.
Finally, please understand that moderation policies are not open for discussion. If you find yourself incapable of abiding by these common set of rules that everyone else observes, then a change of venues is in the offing.Please take the time to review the policy and ensure future comments are in full compliance with it. Thanks for your understanding and compliance in this matter.
-
bjchip at 04:24 AM on 26 March 2015One satellite data set is underestimating global warming
One looking at the Trend Calculator will wonder if the "RSS" and "UAH" values are swapped in this discussion ???
Something does not make sense. Also there is Spencer's own discussion of RSS problems. The modeled atmosphere profile is not clearly discussed, so people often believe that the "satellite" data is less fallible than other measures. Resulting satellite derived temperature values all seem to read low over time compared to surface measurements.
This is a very valuable start, but it is only a start.
-
PhilippeChantreau at 03:00 AM on 26 March 2015One satellite data set is underestimating global warming
My bad. If these results hold then it will be another major error in the list of UAH errors that have been corrected by outside observers. Something that skeptics should approve of, undoubtedly.
-
jja at 02:44 AM on 26 March 2015New measurements confirm extra heating from our carbon dioxide
@tom 14
you said:It turns out the "surface radiative forcing" Feldman et al calculate is approximately equal to the radiative forcing as calculated for the TOA using the IPCC's approximate formula.
I have reviewed the paper and supplemental information and have not found an absolute value for surface radiative forcing that is equal or approximate to TOA values. Do you have a value or quote from the paper that justifies your statement? What is the Feldman total surface radiative forcing in their series at 2007?
The references show that the total longwave downwelling trend is 2.1 watts per meter per decade increase.
-
One satellite data set is underestimating global warming
Actually, I think there have been several major corrections made in the UAH dataset that were the result of outside examination - there's a list of them here. Accounting for orbital decay, diurnal corrections, errors in the tropics, etc.
-
PhilippeChantreau at 01:39 AM on 26 March 2015One satellite data set is underestimating global warming
Very interesting. I hope other groups set out to replicate the results. If it holds up it will definitely help advance the science, but will also be the second time a major flaw in Spencer's work is caught by others.
-
CBDunkerson at 22:07 PM on 25 March 2015So what did-in the dinosaurs? A murder mystery…
Watchbog, ok... sure, there is debate about all of this. However, a claim that CO2 changes cannot cause abrupt cooling is simply false. Even a claim that CO2 changes have not caused abrupt cooling is not "settled science", and indeed would be disputed by many paleoclimate scientists.
Ergo, your statement that, "...CO2 does not cause abrupt Cooling", falls somewhere between unsubstantiated and certainly false.
-
juggared at 17:47 PM on 25 March 2015Michaels Mischief #3: Warming Island
I would certainly entertain that as a possibility, but if your argument depends on the difference between the Warming Island climate and that at Tasiilaq/Angmagssalik, then there was no excuse for not showing the more local and relevant temperature series from Danmarkshavn.
Moderator Response:[PS] I sincerely hope your link to "clash of clans" stuff was error not spam. I deleted the link but feel free to post what you meant.
-
scaddenp at 12:15 PM on 25 March 2015So what did-in the dinosaurs? A murder mystery…
Watchdog - I agree Younger Dryas is not settled science. However, with due respect to CBDunderson, I dont think there are scientists who are claiming it is settled science. I will admit to a certain wariness about strawman claims about what is "settled" and "unsettled".
-
Glenn Tamblyn at 11:37 AM on 25 March 2015So what did-in the dinosaurs? A murder mystery…
Watchdog
I would suggest that cooling events have actually been a much smaller cause of extinctions than warming events.
Looking over the period since the start of the Cambrian, there is only one event where a major extinction occurred that apears to be linked to rapid cooling - that is the end-Ordovician event. And that appears to be linked to a geologically rapid draw down in CO2 levels due to some unusual fgeology and possibly the evolution of vascular plants.
We have to go back further than that, to when life on Earth wasn't much more than bacteria to find examples of extreme cooling events - the so-called Snowball Earth Events during the Cryogenian and the earlier Huronian Snowball.
In contrast from the Cambrian onwards major extinctions appear substantially to be linked to major CO2 driven warming and major disruptions to ocean circulation and chemistry.
The glacial cycles during the more recent Ice Age period over the last 800,000 year or so have not been extreme enough or rapid enough to trigger major extinctions. Life moved and adapted, may have declined in numbers, but wasn't devastated.
-
ranyl at 11:21 AM on 25 March 2015So what did-in the dinosaurs? A murder mystery…
Watchdog,
I'm sure there are good explanations on this website for all the questions you are asking.
The depth of the evidence that CO2 is the primary determinant of the earth's long term temperature is overwhelming and has been very highly scrutinized.
Therefore again what is it about CO2 that inspires you to counter the well presented and explained scientific evidence about CO2's role in mass extinctions?
-
Watchdog at 10:56 AM on 25 March 2015So what did-in the dinosaurs? A murder mystery…
My Point re: 'not settled science' and 'multiple hypotheses' is: ..
CBDunderson's statement, "an explosion of nitrogen fixing plants led to rapid CO2 declines", posited as: the CO2 fact underlying Global Cooling;
- is in fact, not fact.
Since we're discussing events from c.65 MYA - on up to Today,
including several posited Causes of "Mass Extinction (of Dinosaurs",
such as: Bolides, Volcanism, CO2, Global Warming & Global Cooling,
we can't exclude more complete knowledge of recent extinction events
which correlate in time with Global Cooling - replete of evidences of:
Bolide impact and Volcanism.."Climate Change" encompasses several variable observable parameters.
E.G. - Life, Temperature, Ocean Levels are major factors. We all know that Historical Global Temperatures include periods of constantly fluctuating Cooling and Warming. Do any here deny that?
I've obviously been strongly suggesting - replete with a plethora of varying historical events and evidences - that the extremes of the Global Cooling half of Climate Change - have been very causal to extinctions of Life - and can be argued as being the ultimate cause of the demise of many large hungry non-warm-blooded creatures who directly and indirectly depended upon warm lush environments. -
Tom Curtis at 09:07 AM on 25 March 2015New measurements confirm extra heating from our carbon dioxide
Joel_Huberman @12, the definition, with my emphasis is:
"Radiative forcing is the change in the net, downward minus upward, radiative flux (expressed in W m–2) at the tropopause or top of atmosphere due to a change in an external driver of climate change, such as, for example, a change in the concentration of carbon dioxide or the output of the Sun."
Feldman et al measure the change at the bottom of the atmosphere, which they call the "surface radiative forcing". "Surface radiative forcing" and "radiative forcing" are not the same thing. For what it is worth, the change in downward flux at the surface due to a change in CO2, and absent any feedbacks, is about four fifths of the change in radiative forcing (as calculated by the IPCC approximation).
As you note, "surface radiative forcing" also differs from radiative forcing in allowing considerable atmospheric adjustment increase in CO2. That adjustment includes an increase in temperature and, importantly, an increase in H2O content. H2O absorption bands have considerable overlap with the main CO2 absorption bands. That is largely inconsequential for radiative forcing, for CO2 only decreases in concentration very slowly with altitude, whereas H2O is virtually absent above 3 km (except where there are very strong updrafts). Consequently, at the tropopause, the effect of H2O absorption in those bands is very small. In contrast, at the surface much of the effect of CO2 would occure regardless because of the presence of H2O. Further, the increase in temperature will increase the downward flux from all radiative components of the atmosphere including CO2.
It turns out the "surface radiative forcing" Feldman et al calculate is approximately equal to the radiative forcing as calculated for the TOA using the IPCC's approximate formula. As the change in net TOA flux allowing adjustments is considerably less than that, there must be some other difference in the surface energy budget making up the difference. To the extent that Feldman et al's results are respresentative of the global average, that difference will be made up by increased convection or evapo-transpiration, or heat flow from another region (or some combination of the three).
That response is a lot longer than needed as, except for specifying the difference in location (which you probably understood but thought too obvious to need stating), your understanding was correct. I just took the opportunity to flesh out some more of my thoughts on the topic :)
-
scaddenp at 07:20 AM on 25 March 2015So what did-in the dinosaurs? A murder mystery…
Any time you are talking paleo-anything then "settled science" isnt usually used. Multiple hypothesis are common because we lack the data to constrain them. That is very different to evaluation of climate theory, especially in terms of modern climate where data is so much better.
However, when talking about Milankovich, I take issue with "Milankovitch cycles which correlate with, and are proposed to be, causal to extreme abrupt Climate Change cycles" In terms of global temperature change (not temperate change at the poles), the rate of change is only around 0.15 degrees per century at most. Compare that to 20th century rate of change.
The younger dryas (and Bond/Heinrich events, not milankovich forced) have rates of change which appear to much higher if somewhat localized. Fortunately, it appears that these phenomena only occur as ice age ends.
If this discussion if going to continue on Pleistocene climates, then I suggest it be moved to this thread.
-
Watchdog at 05:29 AM on 25 March 2015So what did-in the dinosaurs? A murder mystery…
CBDunderson wrote: "However, there are exceptions like the Older and Younger Dryas periods... when an explosion of nitrogen fixing plants led to rapid CO2 declines... and corresponding temperature drops."
That's a competing hypothesis - concurrent with at least a half-dozen others.
The jury is far from out on that being "settled science".
From Wiki-Younger Dryas - There are prevailing theories of its Cause including several hypotheses replete with evidences; including those connecting the Dryas stadials with both Bolide Impact and Volcanism.
•••
Effects of the Global Cooling period of the Younger Dryas affecting both the Northern and Southern Hemispheres.Replacement of forest in Scandinavia with glacial tundra (which is the habitat of the plant Dryas octopetala)
Glaciation or increased snow in mountain ranges around the world
Formation of solifluction layers and loess deposits in Northern Europe
More dust in the atmosphere, originating from deserts in Asia
Drought in the Levant, perhaps motivating the Natufian culture to develop agriculture
The Huelmo/Mascardi Cold Reversal in the Southern Hemisphere ended at the same time
Decline of the Clovis Culture and extinction of animal species in North America
•••
References to Hypothesized Causes, Extend and Effects of the Younger Dryas
en.wikipedia.org/wiki/Younger_Dryas -
jja at 05:07 AM on 25 March 2015New measurements confirm extra heating from our carbon dioxide
the 0.6 value of TOA is derived from Hansen and Sato (2010) and corresponds with an average value whose mid-point correltes with 2007. Recent NODC ocean heat content analysis shows that the TOA today is significantly higher and at ~1.0 Watts per meter squared in 2013.
It is plausible that, with significant reductions in SE asian aerosol emissions, we are currently at 1.2 Watts per meter squared and facing a significant rate of increase in coming years.
see: https://forum.arctic-sea-ice.net/index.php/topic,1183.0.html -
Joel_Huberman at 04:49 AM on 25 March 2015New measurements confirm extra heating from our carbon dioxide
Tom Curtis @10,11. Thanks for your excellent explanations. Clearly I had much to learn about how radiative forcings are calculated. May I ask you another question to test my new understanding?
Consider the first sentence of the IPCC definition of radiative forcing--"Radiative forcing is the change in the net, downward minus upward, radiative flux (expressed in W m–2) at the tropopause or top of atmosphere due to a change in an external driver of climate change, such as, for example, a change in the concentration of carbon dioxide or the output of the Sun." Based on the full definition and on your explanation, it now seems to me that the reason the measurements by Feldman et al. of changes in downward radiation due to changes in CO2 concentration do not correspond to radiative forcings is that these CO2-radiation changes may have induced other changes--changes in water vapor concentration or in cloud abundance, for example--which will also have effects on both upward and downward radiative fluxes at the TOA. Consequently, the net effect of a change in CO2 concentration will be composed of both a direct effect on CO2-radiation (downward and upward) plus indirect effects on other downward and upward heat transfer mechanisms. Feldman et al. measured a direct effect, but radiative forcing is the net effect. Is my current interpretation correct?
-
Tom Curtis at 04:14 AM on 25 March 2015New measurements confirm extra heating from our carbon dioxide
Pblackmar @9, temperature increase at the surface due to radiative forcing is not a simple function of changes in back radiation (ie, the changes measured in this paper). That is because radiation is not the only energy transfer between the surface and atmosphere. Consequently, increases in back radiation may be matched by increases or decreases in convection, and or evapotranspiration. Rather, both changes in temperature, back radiation, convection and evapo-transpiration will occur to reestablish the change of temperature with altitude in the troposphere which enables an energy balance at the tropopause. Consequently the approach you mention will not reliably forecast future temperature changes.
-
Tom Curtis at 04:09 AM on 25 March 2015New measurements confirm extra heating from our carbon dioxide
Joel_Huberman @8, not quite right.
The energy imbalance at the top of atmosphere is composed of the change in radiative forcing minus the change in outgoing longwave radiation (OLR) due to the increased surface temperature. The total radiative forcing relative to 1750 in 2011 was 2.2 W/m^2, as shown by the IPCC AR5:

It follows that the OLR to space has increased 1.6 W/m^2. (Note, the imbalance at the TOA equals the imbalance at the surface to a very close approximation. If it did not, the atmosphere would heat, or cool very rapidly. The difference between that shown for the surface and TOA in your figure is entirely due to different rounding conventions.)
The radiative forcing, itself is the change in the downward energy balance at the tropopause after the stratosphere has reached radiative equilibrium (full IPCC AR5 definition at bottom of post). For convenience, we normally just refer to the Top of Atmosphere (TOA) rather than at the tropopause. That is reasonable because both are close approximations of each other.
Finally, the measured change discussed in the OP is in the "thermal down surface" shown in your diagram, as you correctly state. In the band of CO2 absorption, that change will have been due to increased CO2 concentration, increased H2O concentration and increased temperature. They appear to have determined the CO2 only contribution by comparision with a radiative transfer model (which unlike GCMs, are fully deterministic, and are very accurate). That change is small relative to the change in radiative forcing at the TOA, a fact which is well known. In fact, it is so well known that from time to time a denier will graph the expected changes at the bottom of the atmosphere as "proof" that radiative forcing from CO2 is much less than that expected by the IPCC - a proof that they are totally dishonest or hopelessly ignorant on the subject they purport to teach to others.
IPCC AR5 definition of Radiative Forcing (from WG1, Annex III)
"Radiative forcing Radiative forcing is the change in the net, downward
minus upward, radiative flux (expressed in W m–2) at the tropopause
or top of atmosphere due to a change in an external driver of climate
change, such as, for example, a change in the concentration of carbon dioxide
or the output of the Sun. Sometimes internal drivers are still treated as
forcings even though they result from the alteration in climate, for example
aerosol or greenhouse gas changes in paleoclimates. The traditional radiative
forcing is computed with all tropospheric properties held fixed at their
unperturbed values, and after allowing for stratospheric temperatures, if
perturbed, to readjust to radiative-dynamical equilibrium. Radiative forcing
is called instantaneous if no change in stratospheric temperature is
accounted for. The radiative forcing once rapid adjustments are accounted
for is termed the effective radiative forcing. For the purposes of this report,
radiative forcing is further defined as the change relative to the year 1750
and, unless otherwise noted, refers to a global and annual average value.
Radiative forcing is not to be confused with cloud radiative forcing, which
describes an unrelated measure of the impact of clouds on the radiative
flux at the top of the atmosphere." -
Pblackmar at 04:04 AM on 25 March 2015New measurements confirm extra heating from our carbon dioxide
Fig 2 appears to be linear. Can a 100 yr projection be made to reduce impacts of internal variability forcing and accurately estimate temp increase given a consistent increase in CO2? Thx
-
Joel_Huberman at 03:05 AM on 25 March 2015New measurements confirm extra heating from our carbon dioxide
Thanks for an excellent summary of an important new contribution.
I felt that one of the sentences in the article, "The extra heating reported here is not directly comparable with the effect known as radiative forcing, which is used to help project climate change," deserved further clarification. I think that this graph, taken from the IPCC AR5 WG1 final report (page 181) helps to explain the difference between the extra heating measured by Feldman et al. and the total radiative forcing used to project climate change:

Notice that the radiation "imbalance" (0.6 W/m2; lower left corner of the figure) is the very small difference between total incoming radiation and total outgoing radiation at the top of the atmosphere (TOA). This imbalance represents the "radiative forcing, which is used to help project climate change," and it is determined by interplay between many factors.
A large portion of the total heat radiation leaving the Earth's surface is returned to the Earth as "thermal, down surface" radiation (342 W/m2) by greenhouse gases and clouds (large orange downward arrow at lower right). Downward radiation from CO2 (as measured by Feldlman et al.) forms a significant component of that 342 W/m2, but downward radiation from water vapor and clouds is the major component according to my understanding. Downward radiation from CO2 is just one of the many factors affecting the final imbalance of 0.6 W/m2.
-
CBDunkerson at 01:16 AM on 25 March 2015So what did-in the dinosaurs? A murder mystery…
Watchdog wrote: "I wanted to establish an agreement that CO2 does not cause abrupt Cooling."
That is often, but not always, true. Most natural processes (e.g. rock weathering) draw down the atmospheric CO2 level slowly over the course of thousands of years. However, there are exceptions like the Older and Younger Dryas periods... when an explosion of nitrogen fixing plants led to rapid CO2 declines... and corresponding temperature drops.
-
Watchdog at 00:50 AM on 25 March 2015So what did-in the dinosaurs? A murder mystery…
I'm familiar with Milankovitch cycles which correlate with, and are proposed to be, causal to extreme abrupt Climate Change cycles. During most of its cycle, temperatures are significantly below our current average.
Global fridid temps occurring, e.g., within the K/T extinction period, were directly caused by Bolidal impact(s) and/or extensive Deccan Traps Volcanism of that time period.
I wanted to establish an agreement that CO2 does not cause abrupt Cooling.
I also look for agreement that extensive periods of Cooling, such as that of our Last Glaciation period which in turn lowered Ocean levels by 400', as well as those longer periods evidenced in Antarctic Ice Core Data, would self-evidently be deadly to _large areas_ of life-forms.
This Vostok data graph shows a correlation between Temperature and CO2.
Source of following graph, labeled:
"Vostok Ice Cores - Temperature and CO2" - is www.climatedata.info
-
jja at 00:08 AM on 25 March 2015New measurements confirm extra heating from our carbon dioxide
Theo
you have an error of selection bias and improper time scales
The .2 value is a decadal average. You used a random start and end date instead of the annual average value and an 11 year time period.
Use the values from 2000 to 2010 and the points from the solid blue median line in the graphic. -
CBDunkerson at 23:27 PM on 24 March 2015So what did-in the dinosaurs? A murder mystery…
Watchdog, yes decreasing atmospheric CO2 levels cause cooling. If you look at atmospheric CO2 graphs they line up very well with the temperature and (inverted) ice volume graphs you showed.
-
bozzza at 18:51 PM on 24 March 2015IPCC were wrong about Himalayan glaciers
@9, isn't the point that 'soot' can be scrubbed whereas CO2 cannot be scrubbed!??!
-
Kevin C at 18:30 PM on 24 March 2015New measurements confirm extra heating from our carbon dioxide
Theo: I haven't looked into this, but the two obvious differences between this observation and a radiative forcing are that:
- Radiative forcing us a top of atmosphere flux difference, whereas this is at the surface.
- Radiative forcing is a global mean, where as these are local values.
But there may be other differences.
-
bozzza at 18:19 PM on 24 March 2015It's not urgent
Dr David Mills was on youtube years ago saying it is now impossible not to go over 440ppm...! He also said it was being debated whether it was possible to go over it and then come back down under it but seeing as that was years ago I'm sure someone has information on where that specific debate is now.
(Dr David Mills was the candian guy who wanted to do Solar Thermal in Australia after having trained and invented processes in Australia but no dice so went to America and no dice, so, well... I suppose he gave in the end!)
-
bozzza at 17:22 PM on 24 March 2015CO2 emissions do not correlate with CO2 concentration
Is this particular myth and its answer saying: "The Keeling curve has not yet reflected the economic activity rise of China yet?"
* No, I wasn't quite sure how to punctutate that!!
-
bozzza at 17:15 PM on 24 March 2015An exponential increase in CO2 will result in a linear increase in temperature
... I believe the relevant term is 'partial pressures' having read through some of the pages of answers and comments given to other myths but I don't really understand what was being said.
-
bozzza at 17:10 PM on 24 March 2015An exponential increase in CO2 will result in a linear increase in temperature
@ 6, this is most certainly interesting: can't wait for a reply to your post by one fitter than me to make one... but you know I'll be trying to work out a sensible response to it from now until then!
-
Theo168 at 14:07 PM on 24 March 2015New measurements confirm extra heating from our carbon dioxide
It's about time basic radiative forcing was validated 'in the wild'
Question - why doesn't the paper not compare measurement with theory? My back of envelope calc predicted 0.29 W/m2 vs measured 0.2W/m2.
5.35*ln(389.85/369.52) = 0.29 W/m2
-
So what did-in the dinosaurs? A murder mystery…
Watchdog - CO2 is a warming, not cooling, influence. Glacial and interglacial temperatures track with Milankovitch cycle forcings and positive feedbacks including CO2 (lagging the forcings by hundreds of years) and water vapor, plus longer term vegetation and ice albedo changes.
And now we're increasing CO2 on our own, with our increasing greenhouse gases acting as a direct warming forcing - with the predicted warming occurring as expected.
Where do you get 'cooling' from CO2? Reference(s), please.
-
Watchdog at 10:58 AM on 24 March 2015So what did-in the dinosaurs? A murder mystery…
Daniel @ 65..
Did CO2 cause Earth's cyclical periods of catastrophic Global Cooling, and, the following Warming periods?
You said, "Regional trends". That is "indistinct".
Can you please define And quantify what you meant by "regional"?
During the last period of glaciation, Earth experienced major advances in global (Southern and Northern Hemispheres) glaciation as the result of the Global Cooling leading to a 400' decline in Oceans levels which in turn translates to a Volume of millions of cubic miles of ICE. I repeat that as a means of focussing upon the quantification of the total ICE; whose extent in both hemispheres is shown in a map posted below.
The area of of the ICE CAPS in Both Hemispheres during that recent time period of Global Cooling are not the total areas of both total and major disruptions of the Biota. Disruptions extended well beyond the actual edges of the massive glaciers.
Counter-Intuitively to some, Frigid Temps along with Massive Glaciation - results in a sharp decline of rainfall - even the extent of causing desertification; all of which in turn results in failure in vegetation and food supply. In other words: a catastrophic impact upon the biotic eco-system.
Global extent of ICE glaciation of 20kya
Above - Maximum Glaciation -— 20kya
•••The 3 graphs below drawn from Antarctic Ice Core Data support the above graph of Greenland Ice Core Temps. The first two graphs of Temperatures show cyclical periods of Global Cooling and Warming which correspond to the third graph of the fluctuatihng ICE Volumes over the past 450,000 years.

Again I ask: Is CO2 the Cause of Global Cooling?
_Moderator Response:[JH] Again, please document the sources of the graphics and data that you include in your posts.
[RH] Adjusted image width.
Prev 600 601 602 603 604 605 606 607 608 609 610 611 612 613 614 615 Next


