


 Arguments


Recent Comments
Prev 616 617 618 619 620 621 622 623 624 625 626 627 628 629 630 631 Next
Comments 31151 to 31200:
-
skeptic1223 at 02:22 AM on 11 May 2015Climate's changed before
@431,"The huge changes in past climate demonstrate the sensitivity nature of our climate. Small changes in solar output and minor variations in the distribution of solar energy across seasons (from minor changes in the earth’s orbit) have created climate changes that would be catastrophic today. Climate models can explain these past changes. And if we compare the radiative forcing from anthropogenic CO2 with those minor variations we see what incredible danger we have created for our planet."
I agree about all of the above except the last sentence. The thing is that in an interglacial period such as today, one of the major warming feed-backs is not present, ice sheets are small enough so that an increase in temperature would not decrease the albedo noticeably. The opposite, however, is much stronger, a relatively small drop in temperature may increase the ice sheets and snow cover sufficiently to trigger run-away albedo increase.
-
skeptic1223 at 02:12 AM on 11 May 2015Climate's changed before
@430, I am not saying that an ice age is imminent, what I am saying is that with an unstable climate we can not really tell when an ice age would come. Surely ice ages have in general been triggered by drops in solar activity and orbital changes, but there are other events too, e.g. major volcanic eruptions, which are even more unpredictable than solar activity. In the past there have been events when glaciation occured unexpectedly and within decades, not centuries, see my post 428. Also, we do not really know the exact CO2 level vs solar irradiation drop that would prevent an ice age from happening. The author in Archer 2005 himself admits that the models are very sensitive to how the parameters are set and this is to be expected since strong positive feedbacks are involved. Finally, the current slow down (if not reversal) of the warming and the last few winters of heavy snow are not very reassuring.
-
skeptic1223 at 01:40 AM on 11 May 2015Climate's changed before
@429, Surely there is some averaging in the ice cores resulting from compaction, and I am not an ice core expert, so I don't really know how much it is, but a quick search on the web shows it might not be that much

This 19 cm long of GISP2 ice core from 1855 m depth shows annual layers in the ice. This section contains 11 annual layers with summer layers (arrowed) sandwiched between darker winter layers. From the US National Oceanic and Atmospheric Administration
www.antarcticglaciers.org/glaciers-and-climate/ice-cores/ice-core-basics/
Besides, the fact that the ice ages started only about 3 million years ago still remains.
-
Tom Dayton at 01:04 AM on 11 May 2015Climate's changed before
On the general topic of climate variability, Science of Doom has a series of interesting posts called Ghosts of Climates Past.
-
Tom Dayton at 00:53 AM on 11 May 2015Climate's changed before
skeptic123, further to Tom Curtis's points, see the post "Are We Heading Into a New Ice Age," the Intermediate version. Read the Archer 2005 paper referenced there.
-
Tom Dayton at 00:40 AM on 11 May 2015Climate's changed before
skeptic123: Sorry, my mentioning of the spacing of data points obscured rather than clarified my point about temporal resolution of temperature records. The measurement techniques average across years, decades, centuries, millennia,.... For example, sediments and snow/ice compress over time so the years are not as physically separated, so a sample will be an average across a larger span of time, which will smooth across variations in temperature. That lack of resolution is reflected in the sparcity of data points the farther back in time you look in graphs, because the placement of a datapoint in time is done at the midpoint of the estimated range of times for that temperature.
-
skeptic1223 at 23:53 PM on 10 May 2015Climate's changed before
@427
About 3) "The return to the cold conditions of the Younger Dryas from the incipient inter-glacial warming 13,000 years ago took place within a few decades or less (Alley et al., 1993)."www.ipcc.ch/ipccreports/tar/wg1/074.htm
"Over the last 400,000 years the Earth's climate has been unstable, with very significant temperature changes, going from a warm climate to an ice age in as rapidly as a few decades."
www.grida.no/publications/vg/climate/page/3057.aspx
While the overall slide into a full-blown ice age indeed could take a millenium, it does not happen smoothly but in a step-wise manner of a few decades with some steps spanning a few degrees of temperature drop. I am also highly suspicious that an increase of 20-40ppm CO2 could prevent the onset of an ice age, your graph from 1) is quite clear that a 20ppm increase had little effect.
About 2) The estimates in that paper might be a bit too pessimistic, who would have guessed that plants would start eating more CO2 as concentration increased
www.natureworldnews.com/articles/9576/20141014/global-warming-plants-absorbing-more-co2-than-we-thought.htm
Also, past CO2 concentrations seem to show that levels could fall as quickly as in a few centuries
About 1) The last 8000 years have indeed been quite uneventful, luckily for us, however it depends how much smoothing one applies to the data, for example
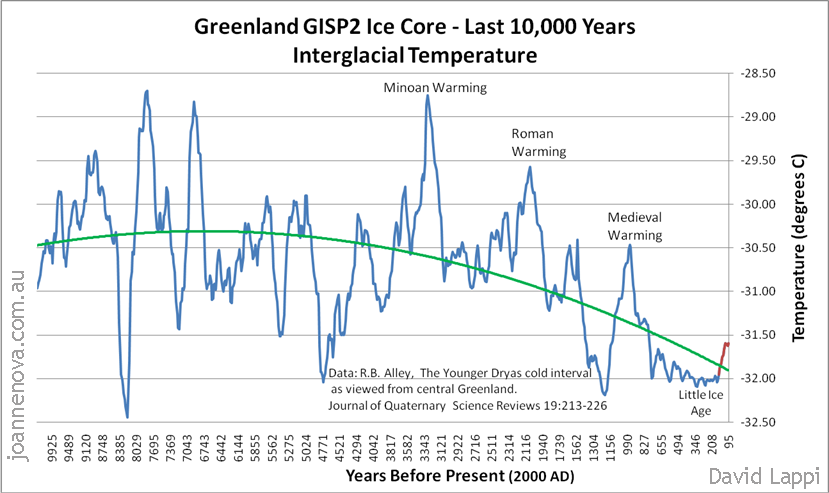
An it should actually be worrying that the overall trend was still downwards despite the 20ppm CO2 increase.
Finally, I would have been really worried if we were currently at preindustrial levels of CO2, but even at 400ppm we are still below the level when the ice ages started and with the current trend in solar activity and orbital cycles pointing downwards it might take just one major volcanic eruption to trigger the positive feedbacks.
Moderator Response:[RH] The David Lappi graph should be disregarded altogether for the mere fact that he states that GISP2 runs up to the year 2000. This is factually incorrect. The "years before present" represented in the GISP2 data uses 1950 to represent "present." Thus the data only runs up to 1855 (95 years before present).
-
Thomas Traill at 23:28 PM on 10 May 2015Monthly global carbon dioxide tops 400ppm for first time
Re: TomR: It seems likely, though, that fossil fuel comanies will finance their own research to stay competitive and stay alive for a while yet. Should oil production not be stopped by market forces in time, the softest route left open would be for governments to make giving up the oil business as financially attractive as possible (rewards would be easier than punishments), while dismantling the oil-specific infrastructure wherever an oil firm calls it quits and banning new wells. This might be unpopular and dangerous, because it would involve transferring money to the rich, but it's preferable to no progress at all and to sabotage by frustrated citizens.
-
Tom Curtis at 19:53 PM on 10 May 2015Climate's changed before
skeptic123 @425:
1) The long term global temperature trend over the last 8000 years has been flat, or slightly downward:

From this we would expect the CO2 concentration to have declined by about 10 ppmv from the early holocene levels of 260 ppmv of CO2. Instead, it rose to 280pmmv - most probably due to preindustrial activities of humans:
Arguably, even that rise was sufficient to prevent the Earth declining into a new glacial. Ergo your hypothesis is getting well ahead of the evidence even there.
2) More importantly, while restoration of zero net emissions will eventually result in CO2 concentrations declining to pre-industrial levels, it is likely to take much more than 10,000 years to do so:
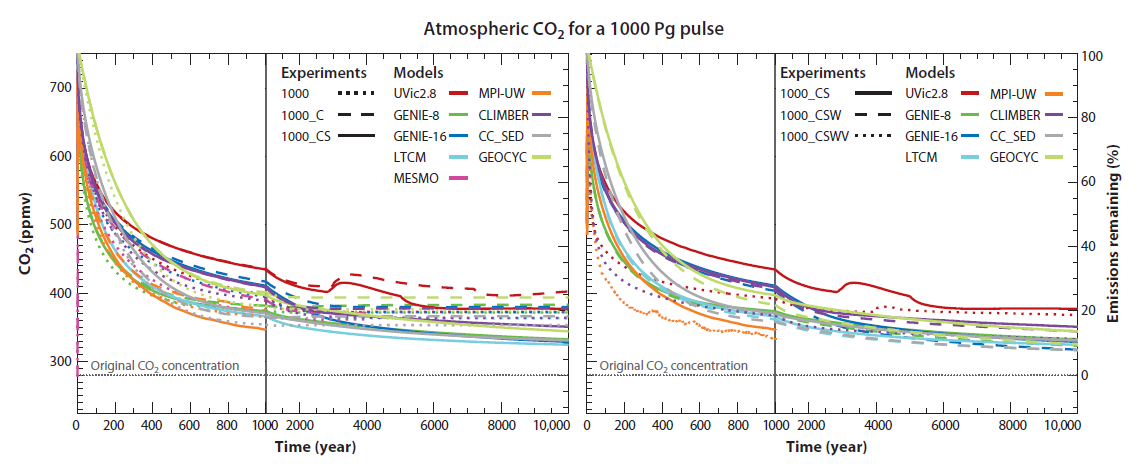
Indeed, even if we were to return to zero net emissions prior to 2020, temperatures would still be elevated above preindustrial levels by a degree Centigrade 10,000 years from now, assuming no major alteration in natural forcings. Consequently concerns about targetting zero emissions are entirely misplaced. (They may be valid concerns for aggressive CO2 sequestration programs that aim at negative net emissions.)
3) The ice core record is very clear that the slide into a glacial occurs, not over decades but over millenium. Even were CO2 levels low enough for that to be a genuine risk, there would still be ample time to react to such an event by reinitiating the consumption of fossil fuels to raise CO2 levels by the 20-40 ppmv necessary to prevent the onset of the glacial. So, even if you were not ignoring relevant facts (1 and 2 above), preventing anthropogenic global warming would still remain the priority issue, with concerns about the ideal post mitigation CO2 concentration being a third or fourth order issue that can be left to be dealt with several decades or even centuries from now, when our understanding of the science will also be that much better.
-
skeptic1223 at 18:20 PM on 10 May 2015Climate's changed before
@423, The data points in this graph seem to be quite equally spaced and the trend of climate instability increase is still quite obvious I think
from wikipedia
en.wikipedia.org/wiki/Geologic_temperature_record
Moderator Response:[RH] Shortened link
-
skeptic1223 at 18:16 PM on 10 May 2015Climate's changed before
@422 If we reduce the emissions to preindustrial levels eventually the concentration would follow too. Also, we don't know exactly what is the threshold of CO2 concentration that leads to unstable climate. Before the current ice age epoch started CO2 levels were above today's.
The climate instability is not irrelevant, I think it is actually the most relevant thing. Unstable climates are unpredictable and swings from interglacials to glacials can happen quite rapidly in a matter of a few decades, for example
en.wikipedia.org/wiki/Younger_Dryas#
So, to summarize, in an unstable climate we wouldn't be able to tell if a new ice age is waiting for us just a few decades down the road, we wouldn't be able to prepare for it, and an ice age would have absolutely catastrophic consequences for us. The catastrophic consequences of rapid climate changes has actually been discussed by skepticalscience
www.skepticalscience.com/Rapid-climate-change-deadlier-than-asteroid-impacts.html
-
skeptic1223 at 18:04 PM on 10 May 2015Climate's changed before
@421, Surely the time resolution for more recent periods is better than for older ones, however statistics and probability theory tell us that even sparser sampling would still show large variations (the probability of the sparser samples all hitting similar values is miniscule). I hope you would agree that the trend in increasing climate instability in the last 3-5 million years is quite obvious
LINK
the graph is from wikipedia
en.wikipedia.org/wiki/Geologic_temperature_record#
Also, the current ice age epoch started only about 3 million years ago and the difference in temperatures between glacial and interglacial periods has been quite significant, for 260 million years before that there were no ice ages and CO2 levels were relatively high compared to today's
LINKagain from wikipedia
en.wikipedia.org/wiki/Carbon_dioxide_in_Earth's_atmosphere#Moderator Response:[RH] Shortened links that were breaking page format.
-
Leto at 13:53 PM on 10 May 20152015 SkS Weekly News Roundup #19B
Chiskoz @1
"unstitution"
That really should be a word.
-
bozzza at 11:36 AM on 10 May 20152015 SkS Weekly News Roundup #19B
The reputation of UWA is very proud and if Lomborg got the gig at the insistence of a climate change denying Prime-Minister the laughter throughout the country would bring shame for a century. It was never going to happen.. Perth knew it would never happen as the students that go there only have it's flawless reputation separating them from the riff-raff of other very well educated university graduates around Perth and as we all know---> Perth has an overqualification problem.
The mums and dads of said students are well connected: Perth is a bit of a round-about and the chancellor would have been reminded that this state floats the country and will not be sold a pup by a Liberal Party propping up old technology and foreign vested interests. The people of UWA realised we need our 'clever country' back and now that Tony Abbott has nowhere to hide his infamous flim-flam man I expect the election campaign will be strategically kicking into gear exactly now! -
DSL at 11:20 AM on 10 May 2015Heartland takes climate foolishness to a Biblical level
longjohn, I should have added that the problem I described is obvious, but that doesn't make it easy to solve. The only way to solve it is through years of training in disciplined critical thinking, and that still doesn't always work (see the Dunning-Kruger effect).
How much evidence should it take to convince someone that a proposition is true enough to act upon? Go to Las Vegas and you'll find thousands of people who doubt AGW yet spend tens of thousands of diollars on a crapshoot. Wall Street preys on these types of people, people who just can't seem to apply consistent, disciplined thought and a mind not burdened with the bolted-down furniture of ideology.It's a mess. The "drubbing" is not the fault of scientists. The fault lies in a collection of social/cultural processes that has de-emphasized what's at stake in the arrangement of democracy. Education is in the middle of those processes, but it's not the source of the problem.
-
DSL at 11:08 AM on 10 May 2015Heartland takes climate foolishness to a Biblical level
longjohn, you said, "Writing is such a poor way to convey ideas compared to orally." If that were true, scientific journals would be audio based. Oral communication requires simplification of complex ideas.
But perhaps you meant to contextualize your claim more than you actually did. Perhaps you meant to say that oral communicators get their ideas across more powerfully than scientists with their gobs and gobs of paragraphs. Regardless, the written vs. oral argument has little to do with the trainwreck that occurs when science is communicated to the general public.
There are two primary conditions that allow "doubt-mongers" to be highly successful in their work. The first is that these folk can misrepresent the science without being held accountable in any meaningful way. The second is that the general public, by and large, has no basis for judging the truth value of a claim about the science. None. And so they turn to heuristics. There's simply nothing else to do, other than checking out the claim by working through the scientific context for weeks, months, years (I've done this — seven years now I've been working through the published science in my spare time).
A tiny fraction of the general public who accept the theory of AGW can actually articulate the basic theory. They simply trust scientists and/or the theory fits in with their environmental politics, anti-capitalist politics, etc. And those of the general public who doubt do so for similar, if opposing, reasons.
Where oral vs. written does enter into it is through the idea that writing forces a greater responsibility on the reader, because the ideas are always present (one can stop and re-read) and the mode allows more complexity. Yet misrepresentation is just as easy in writing as it is on talk radio; all one needs is an audience that doesn't understand the science but already always knows what is right.
-
Tom Dayton at 11:00 AM on 10 May 2015Climate's changed before
skeptic1223, for example see Figure 5 in Zhang et al. (2013). Note the circles that are the actual datapoints, and note how far apart they are in various time periods.
-
chriskoz at 10:40 AM on 10 May 20152015 SkS Weekly News Roundup #19B
Ditching Bjorn Lomborg centre from UWA is the most positive, even celebratory news this week.
If the centre had gone ahead, it would've undermined my faith in science progress, certainly in UWA.
I do not believe chancellor Paul Johnson, who "defended the decision to appoint Dr Lomborg an adjunct professor" did so out of his genuine opinion. Far more likely Johnson was under serious political pressure. Thankfuly, the presure from "students" (I guess all academics afiliated with UWA if not the entire world are included in this broad term) outwieghed the pressure from the politicians.
Note that UWA was not the first unstitution, the current australian government wanted to place Lomborg in. This article stipulates that it was ACU:The Australian Catholic University's Canberra campus was one of a number of locations considered for the controversial centre, before UWA was settled on.
which is probably closer to Tony Abbott's heart. One can only stipulate why the attempts to place Lomborg in ACU have failed and if Tony Abbott dares to try somewhere else...
-
TomR at 09:39 AM on 10 May 2015Monthly global carbon dioxide tops 400ppm for first time
It appears that the rate of CO2 rise took a larger jump this year of 2.73 parts per million than in the last several years. In any case, recent claims that humans are putting less CO2 into the atmosphere appear untrue.
The victory of the Tory Party in the UK is a setback, since Labour had emphasized action against global warming in its campaign and the Tories have fought against land-based wind as unsightly and fought for fracking as well as reduced taxation of North Sea oil to improved the profitability of continuing extraction despite low prices.
At least China is cutting the amount of coal gasification they are planning. The future continues to look very grim. Hopefully, science will make batteries so good and electric transportation so much cheaper that gas and diesel vehicles will become comparatively expensive dinosaurs.
-
bozzza at 09:29 AM on 10 May 2015Antarctica is gaining ice
How does a climate change advocate deny the reality of this?
-
bozzza at 08:14 AM on 10 May 2015Climate's changed before
@420, Who said we were trying to reduce CO2 to preindustrial levels?
Sure it's an interesting thought that 'low CO2 levels' could lead to unstable climates, I'll grant you that, but it's irrelevant.
-
longjohn119 at 07:25 AM on 10 May 2015Heartland takes climate foolishness to a Biblical level
Well DSL if that were even remotely true Science wouldn't be losing so badly to the Spoken Propagandists on the Right ...... They've been drubbing you guys for over 20 years and I just explained to you why that's true.
-
Tom Dayton at 05:11 AM on 10 May 2015Climate's changed before
skeptic1223, I believe you are mistaking the higher temporal resolution of the temperature measurements the closer to recent your linked graph shows, for more rapid changes in temperature.
-
skeptic1223 at 03:19 AM on 10 May 2015Climate's changed before
Evidence about Earth's climate in the last few million years show rapid oscillations of the climate started about 3 million years ago when CO2 concentrations dropped from above today's level to about half today's level.
http://upload.wikimedia.org/wikipedia/commons/1/1b/65_Myr_Climate_Change.png
Milankovitch cycles and variations in solar activity can not alone account for these rapid changes because they have existed long before the rapid changes started. Variations of CO2 concentrations in the range of 100ppm can not explain it either, because such variations have also been present long before the period of rapid climatic changes started.
It seems the only difference between the past 3 million year period of rapid climatic changes and relatively more stable climate before it is the average CO2 level. During the stable climate it was above today's level and during the unstable climate it was about half today's level.
Is it possible that low CO2 levels lead to unstable climates due to the reduced green-house effect and therefore wouldn't we be shooting ourselves in the foot by trying to reduce the CO2 level to preindustrial levels and therefore risking a swing to a colder climate which would have a much more dire consequences than even the direst IPCC predictions?Moderator Response:[TD] I hotlinked your link. In future please do that yourself.
-
SirCharles at 23:59 PM on 9 May 2015What if Climate Change is Real? Katharine Hayhoe TEDx at Texas Tech
Video by the US National Academies of Sciences:
Read more in "Climate Change: Evidence and Causes"
Moderator Response:[RH] Reduced size to fit page formatting.
-
Jaimesald at 22:55 PM on 9 May 2015They didn't change the name from 'global warming' to 'climate change'
According to the WORLD World Metorological Organization Climate is 30 year Weather average.
Moderator Response:[JH] The use of "all caps" is akin to shouting and is prohibited by the SkS Comments Policy.
-
bozzza at 13:12 PM on 9 May 2015Lomborg: a detailed citation analysis
Australia has been made proud again by the actions of UWA staff: this is a globalised election issue... this action by the staff of a proud university is of historical significance in my opinion and the mere politics of it is that of all human relations.
Bring back the clever country I say. What say you?
-
Tom Curtis at 09:08 AM on 9 May 2015Ask Me Anything about Climate Science Denial
OPOF @18, I certainly have no argument with your recommendations.
-
Tom Curtis at 09:06 AM on 9 May 2015Lomborg: a detailed citation analysis
michael sweet @55, the story has been widely reported in Australia, including by the ABC, the Sydney Morning Herald, the Australian, and of course The Gaurdian (Australian Edition) to which Romm links. The Sydney Morning Herald story is echoed across the Fairfax media, as the Australian's version is echoed across the Murdoch press. The only story additional to Romm's report is that Christopher Pyne says he is taking legal advise about the cancellation of the contract.
-
michael sweet at 08:02 AM on 9 May 2015Lomborg: a detailed citation analysis
Joe Rhom at Think Progress reports that UWA has turned down the $4 million and declined to accept the Lomburg center. Any updated from Oz here?
-
Daniel J. Andrews at 07:08 AM on 9 May 2015What if Climate Change is Real? Katharine Hayhoe TEDx at Texas Tech
Brendon, I think the paper for that is Attributing physical and biological impacts to antrhopogenic climate change by Rosenzweig et al in Nature May 15, 2008 (vol 453). They examined 29,500 biological indicators and 90% of them were in the direction expected from global warming. That gives 26,550 indicators of warming.
Moderator Response:[DB] Added link to a full copy of the paper.
-
SkepticalinCanada at 05:18 AM on 9 May 2015Ask Me Anything about Climate Science Denial
@17 Sorry, I do not have a list, but a search for something like "lawsuits against us politicians climate change" will bring up a few, including an insurance company class action suit against Chicago area municipal governments. I assume that, as the list grows, someone somewhere will keep track for us, especially as the list of successful lawsuits grows.
-
One Planet Only Forever at 05:08 AM on 9 May 2015Ask Me Anything about Climate Science Denial
Tom Curtis@12,
I will try to clarify my recommendation.
Do not presume an interpretation of a word like consensus when its interpretation is key to the message you are trying to convey. Try to explain what you mean whenever you use it.
An additional recommendation is: Do try to tell people what they should have understood if you did not explain the intended meaning. Simply agree that there are multiple possible interpretations, but you meant what you clarify the intended meaning to be.
The pursuit of things like convenience, expediency and brevity can lead to disasterous unintended and unnecessary consequences.
-
citizenschallenge at 04:44 AM on 9 May 2015Ask Me Anything about Climate Science Denial
SkepticalinCanada @ 13,
you wouldn't have a list of such US lawsuits would you?
-
citizenschallenge at 04:41 AM on 9 May 2015Ask Me Anything about Climate Science Denial
PS
The lawsuit has been brought by the sustainability foundation Urgenda with 886 Dutch citizens acting as co-plaintiffs including teachers, entrepreneurs, artists and children legally represented by their elders.
-
citizenschallenge at 04:38 AM on 9 May 2015Ask Me Anything about Climate Science Denial
@14 jenna. It doesn't look as though that lawsuit against the Dutch government has anything to do with "beliefs" it's focused on lack of action that 'We The Dutch People" believes needs to be taken.
(no I'm not Dutch, just a figure of speach)
"Dutch government facing legal action over failure to reduce carbon emissions. Landmark case brought by 886 Dutch citizens aims for more robust policy to cut emissions within targets set by IPCC to help avoid critical 2C rise in global temperatures.
The first public hearings will take place in the Hague on Tuesday in the first case in the world to use existing human rights and tort law to hold a government responsible for failing to reduce carbon emissions fast enough. ...
They will ask the judiciary to declare that the Dutch government must implement policies to reduce its emissions by between 25% and 40% below 1990 levels by 2020. This was the target for developed nations – established by the Intergovernmental Panel on Climate Change (IPCC) – as necessary to create a 50% chance of avoiding a dangerous 2C rise in global temperatures."
Unfortunately the legal system moves slower than our cryosphere is melting.
http://www.theguardian.com/environment/2012/nov/14/dutch-legal-action-climate-change
The Dutch government is facing the threat of legal action if it fails to take swift action on climate change.
The move, which is thought to be the first time that European human rights legislation has been used to take a government to court over climate change failures, is intended to put the spotlight on what campaigners say is a lack of action and force them to prioritise cuts in greenhouse gas emissions.
Urgenda, the pressure group behind the move, sent a letter to ministers calling on them to announce new initiatives on cutting emissions. Without that, the group said it would proceed to the courts.
The government of the Netherlands has not yet responded.
-
jenna at 02:54 AM on 9 May 2015Ask Me Anything about Climate Science Denial
IMO, lawsuits against politicians or 'anybody' based on their 'beliefs' (or lack of action based on someone else's beliefs) is a very slippery slope.
I'm for more education and interaction with people that aren't yet convinced of the seriousness of AGW. Lawsuits against polticians or whole countries/governments, will be seen more as radical publicity stunts by your average Joe and may not have the intended results on the public mind. After all, it is the people who will drive the politicians to drive change on this issue, IMO.
-
SkepticalinCanada at 02:37 AM on 9 May 2015Ask Me Anything about Climate Science Denial
villabolo @4, one of the current lawsuits has been filed against the Dutch government (as documented at The Guardian), while others I am aware of have been filed against individual politicians in the United States.
-
Tom Curtis at 02:26 AM on 9 May 2015Ask Me Anything about Climate Science Denial
OPOF @10, dictionaries only, or should only, report on actual usage. In this case, an example of actual usage is found in the wikipedia article to which I previously linked. In particular, that article has a section heading "near-unanimous consensus". If "consensus" means "unanimous agreement", then "near-unanimous consensus" is a contradiction in terms. It should strike you as odd or as nonsensical as, for example, a dark light, or a spherical cube. As it does not, or at least it does not strike me that way, current usage does not make unanimity a necessary feature of consensus. Ergo, treating it as such is indeed an error, whether in 1860 or 2015.
-
RobH at 00:56 AM on 9 May 2015Ask Me Anything about Climate Science Denial
"what are the main reasons someone would deny climate change?" Some of the people I mix with and who dont seem to mind assuming everyone shares their view seem to have a suite of beliefs that seem to tie together - homosexuality is a lifestyle choice, the university (name any one) is a hot-bed of Moaist and Trotskyites, New Scientist is a left-wing magazine and you dont believe all that rot about global warming do you? - Oh, and I hand our how to vote cards for (guess who). This gives me the creeps as to what the hell is going on in one of our major political parties.
-
One Planet Only Forever at 00:35 AM on 9 May 2015Ask Me Anything about Climate Science Denial
Tom Curtis,
Truth can be understood to be "in agreement with facts". In that sense it does not relate to spirituality or religious beliefs which have no objective confrimable facts for consideration.
It is probably better to describe the intended meaning of a term like consensus (or strong consensus - weak consensus, or objective truth) whenever such a term is used. English is an amazing evolving language. Regardless of the history of meaning of a word, an expected meaning of a term should not be relied upon.
The full definition of consensus in the 1988 edition of "The New Lexicon - Webster's Encyclopdic Dictionary of the English Language" is:
"concord (of opinion, evidence, authority, testimony, etc.) [L. = agreement].
And concord is defined as "a state of agreement or harmony ll a treatment or agreement ll (mus.) a chord harmonious to iteslf, not needing others to resolve it ll (gram.) agreement between the forms of words, e.g. (for number) 'this house, these houses' [F. concorde]"
By that definition the interpretions of the term to mean unanimous agreement are not currently 'an error of interpretation'. Believing or claiming it to be an error of interpretation is an error.
-
Mighty Drunken at 22:53 PM on 8 May 2015Ask Me Anything about Climate Science Denial
The lukewarner question is a good one and so is the answer. The lack of action by Government and companies needs only to look at reasons for delaying action. For a better future climate that is not possible
-
Brendon at 22:51 PM on 8 May 2015What if Climate Change is Real? Katharine Hayhoe TEDx at Texas Tech
Thanks, Katharine's a great communicator.
Out of interest, any idea where the source is for the 26,500 indicators of warming?
-
uncletimrob at 18:01 PM on 8 May 2015What if Climate Change is Real? Katharine Hayhoe TEDx at Texas Tech
Thank you! Another keeper for my students. Most inforative and easy to understand.
-
Tom Curtis at 16:30 PM on 8 May 2015Ask Me Anything about Climate Science Denial
OPOF @7, my Shorter Oxford defines "consensus" as:
"1. Phys. General concord of the different organs of the body in effecting a given purpose. ...
2. Agreement in opinion."
The first recorded instance of the first meaning is in 1854, of the second, it is in 1861. Most internet sources define "concensus" as "general agreement" which is not the same as unanimous agreement. It is glossed as such by Miram Webster. However, Miriam Webster provide a second defintion as "the judgment arrived at by most of those concerned" (my emphasis). Based on that, I believe the idea that "consensus" means the same as "unanimous opinion" is just an error of interpretation.
The error arises, I believe, due to many people being familiar with the term from consensus decision making, which often involves a requirement of unanimity, especially from small groups. Even there, however, near unanimous decisions are often accepted as part of consensus decision making. Indeed, for clarity it may be helpful to borrow some terminology from that field. Specifically, some consensus processes can be decided by an agreement by all but one member or all but two members, described as U-1 and U-2 respectively. With so large and amorphous a body as that of all climate scientists, using individual counts of dissenters is hardly usefull. However, we might define a "strong consensus" as U-5%, ie, agreement by all but 5% or less of climate scientists, and a "weak consensus" as U-10%, ie, agreement by all but 10% or less of climate scientists.
If we use those definitions, and by my estimate from familiarity with various surveys, there is a strong consensus that:
1) Anthropogenic emissions are the primary (>80%) cause of the recent rise in CO2 concentrations;
2) That increasing greenhouse gas concentrations cause an increase in Global Mean Surface Temperature; and
3) That anthropogenic forcings have caused more than 50% of recent global warming (ie, warming since 1950).
There is at least weak consensus that:
1) That anthropogenic forcings have caused more than 50% of industrial era global warming (ie, warming since 1750);
2) That unmitigated global warming will result in temperature increases over the coming century between the upper bound of RCP 8.5 and the lower bound of RCP 6.0; and
3) That unmitigated global warming has a statistically significant risk of being very dangerous.
Finally, there is at least a super majority (66% or more) of the opinion that unmitigated global warming will more likely than not be very dangerous.
Re Degrasse's statement, "objective truth", if it means anything more than just "truth" means merely the truth, objectively determined. By definition, therefore, the consensus opinion of scientists is not thereby objective truth, for it is determined by a subjective measure, ie, the actual opinions of scientists. It is, however, our current best guess as to the truth objectively determined, ie, as determined by the scientific method.
-
One Planet Only Forever at 14:06 PM on 8 May 2015Ask Me Anything about Climate Science Denial
I understand that the intended meaning of consensus is a 'majority view' on a matter. However, not all dictionaries include that definition for the term. My Oxford Dictionary 1985 edition does, but my Webster's dictionary published in 1988 does not. And our Scholastic Children's Dictionary published in 2002 defines consensus as "An agreement among all people in a discussion or meeting". So, by definition, there is no consensus regarding the meaning of the term consensus according to the definitions provided by Websters and Schoalstic.
Neil Degrasse Tyson refers to generally accepted scientific understand as objective truth.
I like that term, objective truth, because it reinforces the need to be objective and points out that all people who truly objectively review all of the evidence on a matter will come to essentially the same conclusion, the objective truth that could be altered by new information, but that is not altered until there is new substantive information that objectively warrants a change of the understood objective truth.
However, the term Objective Truth is also used in a variety of ways including claims of objective truths about unobservable matters like spirituality, matters that are important to ponder but that cannot truly be evaluated 'objectively' at least not yet.
What a conundrum. (at least everyone can agree about that term ... or can they?).
-
scaddenp at 13:00 PM on 8 May 2015Ask Me Anything about Climate Science Denial
I think the most important thing about scientific consensus, is that it should be the guide to policy. Consensus may change (eg fat in diet) in which case policy needs to change with it, but the current scientific consensus, when strongly formed, is the only rationale guide to policy.
For practising scientists, the consensus is usually the underpinning for further work, but of course a scientist should challenge the consensus when there is an observation that doesnt fit or an hypothesis that better fits observations. This is the normal progress of science. eg I would assume say Fourier's Law in my work pretty much without question. However, if some observation turned up that defied explanation within that framework and I could dream up an alternative that also worked with all previous observations, then I am in position to challenge that consensus.
-
bozzza at 11:00 AM on 8 May 2015Ask Me Anything about Climate Science Denial
Consensus starts with nomenclature so to say consensus is not a part of science is incorrect by-ahem- definition.
-
villabolo at 09:20 AM on 8 May 2015Ask Me Anything about Climate Science Denial
@ SkepticalinCanada #2,
Are those lawsuits directed at individual politicians or their party?
-
Jim Eager at 09:08 AM on 8 May 2015Ask Me Anything about Climate Science Denial
Under Scientific Consensus, the first questioner is confusing consensus as a decision making process with consensus amng scietists on what constitutes the body of accepted and agreed upon scientific evidence. The two are quite different uses of the word.
Prev 616 617 618 619 620 621 622 623 624 625 626 627 628 629 630 631 Next


