


 Arguments


Recent Comments
Prev 616 617 618 619 620 621 622 623 624 625 626 627 628 629 630 631 Next
Comments 31151 to 31200:
-
dana1981 at 07:41 AM on 12 February 2015Fiddling with global warming conspiracy theories while Rome burns
I don't see any need to attack Homewood's credibility when the arguments themselves are transparently wrong. The fault is Booker's for swallowing the horse manure that Homewood fed to him.
-
Lloyd Flack at 06:51 AM on 12 February 2015Kevin Cowtan Debunks Christopher Booker's Temperature Conspiracy Theory
I can show him up. There are others there that want to beleve the denialists are rightb but who will reluctantly accept facts. He is a lost case.
-
McMeatFace53 at 04:26 AM on 12 February 2015Fiddling with global warming conspiracy theories while Rome burns
Great post dana1981. Extremely informative.
Just to comment about the Christopher Booker article, he references a person by the name of Paul Homewood. I believe this is the same Paul Homewood who is a retired accountant and has no formalized training in the climate change realm. My question is why has nobody attacked this person's credibility in providing key stats to Christopher Booker's article? Paul Homewood has no advanced degrees, no formalized training, has no peer reviewed articles (that we know of), but the deniers take these findings as gospel. It is the equivalent of someone who is a stock broker, but reads articles on Web MD. Does that make the stock broker an expert in the medical field versus someone who has been in medical school for an extensive amount of time? Should that person be allowed to prescribe medication? This source would be crucified if this was under circumstances.
-
witsendnj at 00:37 AM on 12 February 2015A 23-year experiment finds surprising global warming impacts already underway
"We were actually very surprised to see such dramatic changes in the control plots." It's very well known that tropospheric ozone is highly toxic to vegetation and that as background levels rise, there will be a species shift in the ecosystem because some plants are more sensitive than others. That is what is occurring everywhere on earth. It shouldn't be a surprise. The reason the EPA has been (unsuccessfuly so far) trying to enact stricter legislation to lower acceptable levels of ozone is to protect the biosphere, because they have determined after reviewing the scientific literature that damage to trees is cumulative. This is a massive amplifying feedback for climate change, as a major carbon sink is being lost, as well as other knock-off effects such as changes in precipitation and of course, habitat and food for dependent species. See links at http://scienceblogs.com/gregladen/2013/01/29/whispers-from-the-ghosting-trees/
-
wili at 23:02 PM on 11 February 20152015 SkS Weekly News Roundup #7A
Oh, and Climate Central, too: Geoengineering ... Solutions Not Ready
Moderator Response:[JH] Please note the sixth article listed in the OP.
-
wili at 22:55 PM on 11 February 20152015 SkS Weekly News Roundup #7A
Thanks for these, but I still think you're missing a big story by not covering the National Academy of Science's two-part report on geo-engineering. Lots of other venues are covering it:
US scientists say 'climate intervention' strategies are unlikely to work
Report: Don’t Try to Block the Sun to Fix Climate Change
Anti-‘Geoengineering’ National Academy Report Opposes ‘Climate-Altering Deployment’
Moderator Response:[JH] Patience is a virtue. This story will be covered in the next edition of the News Roundup. By design, I have limited the number of articles covered in a single edition to 15. There's a lot of news popping up this week and they all cannot be covered unless I were to produce a daily news roundup. Doing so would require me to devote 8-12 hours per day on SkS related activites and I simply cannot do that.
-
Robert Murphy at 21:22 PM on 11 February 2015Kevin Cowtan Debunks Christopher Booker's Temperature Conspiracy Theory
Lloyd, do you really think midnight is going to see his error (I've been following the posts at DC). He thinks that temp series are adjusted to predetermined GCM output, that the greenhouse effect is negated because Boyle's Law, and that LR radiation can't warm the oceans. He's completely convinced of his superior knownledge (about everything) and will never, ever admit a mistake. He's in complete denial. He isn't interested in undestanding how adjustments are made. He already "knows".
-
Klapper at 20:01 PM on 11 February 2015Claims that climate models overestimate warming are 'unfounded', study shows
"...The authors don't rule out a minor contribution from some models underestimating cooling from volcanic eruptions..."
That's either incorrect, or highly misleading, or a typo (he meant overestimating not underestimating). Look at the model to observation trend difference for the 15 year trends starting in 1992 in the above trend comparison graph (1992 is the approximate maximum cooling effect of Pinatubo). Those trends are much warmer in the models than the observations.
In the models there is an all time peak in the warming rate for trends starting approximately 1992. This would indicate the models (or most of them anyway) have overcooled the late 1991 to 1994 or 1995 period, either by the breadth of the cooling or the depth.
Perhaps some models don't cool enough, but that does not appear to be the case for most models.
-
Lloyd Flack at 14:27 PM on 11 February 2015Kevin Cowtan Debunks Christopher Booker's Temperature Conspiracy Theory
No need, found what I needed.
-
Glenn Tamblyn at 13:31 PM on 11 February 2015Increasing CO2 has little to no effect
Quick
"did you people know that the AGW cult claims that when a molecule of carbon dioxide "absorbs" and "re-emits" a photon of IR (actually Stokes-Raman scattering) that it re-emits a photon of the "exact" same wavelengthas the one "absorbed"
Simple answer. No 'it' doesn't. No scientist knowledgeable about the processes involved in the GH efect says that. It is along the lines I described previously.
Absorption of a photon by a CO2 molecule is decoupled from emission of photons by other CO2 molecules. They absorb across a wavelength ban and equally they emit across that band, with differing probabilities of occurring at each wavelength.
Maybe your interlocutor read commentary on blogs from laymen that said this, but an Atmospheric Physicist for example wouldn't. He seems to be an example of someone who thinks that commentary in the media and public forums constitutes an accurate description of the science. It isn't, it's just commentary.
And all the science behind AGW is based on accurate spectroscopy as for example the HiTran database.
As for his last sentence, there are several ways in which atoms and molecules can absorb/emit photons. The two that matter here are:
- Atoms can absorb a photon and one of the electrons within the atom will be raised to a higher energy state. This mainly occurs around visible and ultra-violet wavelengths. This is purely an electrical process inside an atom.
- The atoms of a molecule are a bit like balls bouncing on strings - they 'jiggle around'. A molecule can absord energy from a photon that causes this vibration ('jiggling') to increase. This mainly occurs in the near Infrared which we are dealing with here. This is an electro-mechanical process encompassing the whole molecule - electro because the molecule is able to 'reveal' electric charges to the outside world because it has a 'charge separation' across the molecule, and mechnical because it involves the physical movement of the atoms within the molecule. One of the pre-requisites for a molecule to possibly be a GH gas is that it must be able to produce a charge separation. Symmetrical molecules such as Oxygen and Nitrogen can't do this, thus they can't act as GH gases. There is also a form of this absorption/emmission that occurs for some GH gases, water particularly, where the rotation of the molecule allows absorption, increasing the rotation.
-
wili at 13:13 PM on 11 February 20152015 SkS Weekly News Roundup #6B
Another item for the next roundup: phys.org/news/2015-02-purposely-cooling-planet-idea.html
>>Panel chairwoman Marcia McNutt, editor of the journal Science and former director of the U.S. Geological Survey, said in an interview that the public should read this report "and say,
'This is downright scary.'
And they should say,
'If this is our Hail Mary, what a scary, scary place we are in.'"<<
-
Increasing CO2 has little to no effect
To expand slightly on my previous comment:
The forcing change from doubling CO2 is on the order of 3.7W/m2. To calculate how the the climate must warm in response, consider the effective emissivity of the Earth to space, and the Stephan-Boltzmann law.
Power = Area * emissivity * SB constant * TK4
The Earths surface receives an average of 240 W/m2 of energy from the sun, and with a surface temperature averaging 15C emits 240 W/m2 back in balance (solve for original emissivity). If that drops by 3.7 W/m2, reducing effective IR to space (solve for changed emissivity), the surface of the Earth has to warm by 1.1C to come back into balance and again emit 240 W/m2 (use new emissivity and solve for temperature).
-
Increasing CO2 has little to no effect
Quick - The 1.1C from direct forcing from doubling CO2 comes most directly from Myhre et al 1998, computed using the HITRAN spectral database and numeric radiative codes to estimate reduction of IR to space with increasing CO2, not to mention other GHGs. This spectral change has been experimentally verified with satellite readings at GHG frequencies (Harries et al 2001 and later papers).
The 2.0-4.5C warming from a doubling of CO2, with a mode of ~3.0C (including feedbacks) comes from a broad range of studies (discussion here), including paleoclimate, GCMs, recent observations, etc. While uncertainties are present, the changes of warming outside that range are very low, apply to both the high as well as low extrema, and even 2.0C warming per doubling is likely to give us significant impacts based on our current economic path.
-
Tom Curtis at 12:21 PM on 11 February 2015Increasing CO2 has little to no effect
"[Impossible] with vibrational transition"? I think not:
-
Lloyd Flack at 12:12 PM on 11 February 2015Kevin Cowtan Debunks Christopher Booker's Temperature Conspiracy Theory
Can anyone provide an exampe of a graph showing a negative adjustment in the trend at an individual station. I need an exmple to reply to a comment on another site.
The sheer recklessness of the denialists acusations here can be used against them. They do not appear to have even tried to understand the adjustment process before attacking. This is something that they can be pinned down on.
-
Quick at 11:50 AM on 11 February 2015Increasing CO2 has little to no effect
Glenn, this is helpful. However, here is how he explained absorption and emission: "Speaking of science, did you people know that the AGW cult claims that when a molecule of carbon dioxide "absorbs" and "re-emits" a photon of IR (actually Stokes-Raman scattering) that it re-emits a photon of the "exact" same wavelength as the one "absorbed"?
This is the claim to got me interested in researching their pseudo-science. Reason being, I already knew this was impossible. There is only one process that can absorb and re-emit a photon of the exact same wavelength and that process is called resonance fluorescence and it involves an electronic transition (electron jump). It's IMPOSSIBLE with a vibrational transition."
Can you please clarify the last sentence here?
Moderator Response:[JH] For future reference, it would be extremely helpful to everyone if you were to put all quotes from you blogging adversary(ies) in italics. Thank you.
-
TonyW at 11:50 AM on 11 February 2015A 23-year experiment finds surprising global warming impacts already underway
Hmm, interesting. A few thoughts occurred to me, though. (I can't see the paper itself, even if I could access it, as there seem to be some problems with the site, at the time I tried).
This experiment, presumably, measured 23 years of a constant surface warming, above the variation already happening. But didn't/couldn't simulate a higher atmospheric concentration of CO2, over an extended time. Also, I'm not quite sure of the usefulness of measuring just the soil carbon. What about the carbon in the woody shrubs, also? That is, what was the total carbon sequestered by the plots (I realise that the soil carbon would come from the plants growing in the plots)?
I also wonder if this result has implications for one of Hansen's hopes; that reforestation would help bring CO2 levels down.
Lastly, presumably the shift from flowering plants to woody plants is due to those plots being in naturally woody areas, since the same occurred on the control plots. What would be the difference from natural prarie ecologies?
-
Quick at 11:28 AM on 11 February 2015Increasing CO2 has little to no effect
scaddenp@190, Thanks again for the input, but my last physics class was early 80s, so bear with me please. What equations yield the 1.1C and 2.0-4.5C?
-
Glenn Tamblyn at 10:57 AM on 11 February 2015Increasing CO2 has little to no effect
Quick, for starters his fixation on 9.4 and 10.4 is way off. there are two minor peaks there but the main one is closer to 15 micron. He wants a graph, show him this:
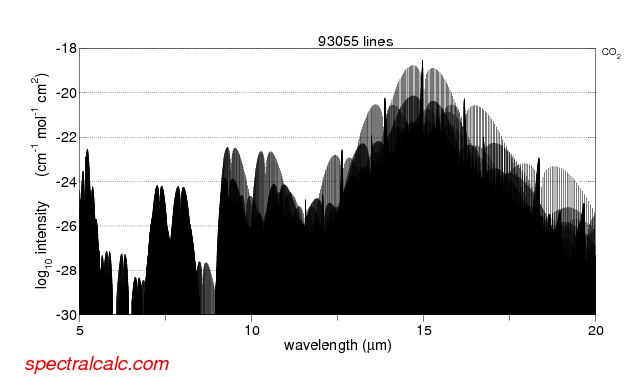
you can get a copy here: http://www.skepticalscience.com//pics/CO2IntensityWavelength.png. Notice that the vertical scale is logarithmic. So the peak at around 15 micron is nearly 10,000 times stronger than those peaks he is referring to. And this is the actual measured spectral intensity for CO2, from HiTran. Spectral Intensities 1000,s of times higher than his numbers means that is distance of kilometers becomes meters.
Next he clearly doesn't get that absorption and emission are mirror image processes. Gases that absorb at certain wavelengths also emit at those wavelengths.
He is right that when a single CO2 molecule absorbs a photon then virtually all the time this extra energy is passed off to other molecules in the air, typically within less than a microsecond of the absorption. But he is missing the fact that collision between molecules are continually raising molecules to higher energy states and dropping them back down again.
At any instant half of all the molecules in the air will be in an energy state higher than the average. And a proportion of those will be CO2 molecules. So a small proportion of those CO2 molecules will be able to spontaneously emit, de-energising by emission rather than by collision. And since there are millions of CO2 molecules in just the first meter of travel for each photon, even a small number of spontaneous emissions is enough to emit as much as is absorbed.
And most of the emitted photons are in turn absorbed by another greenhouse molecule and the energy redistributed via collisions, then another emission by another molecule ... and so on. When a gaseous medium is 'optically thick' - meaning most EM radiation passing through it is absorbed, then energy transport via radiation through the medium is extremely slow. This process is called Radiative Diffusion.A similar process occurs inside the Sun. In the inner part of the Sun there is no convection, so all energy flow is via radiation so it is extremely slow at transferring generated heat from the core outwards. It is only when one reaches the outer layers of the Sun and convection starts occurring that the rate of heat transport increases dramatically. The estimates are that it takes over 100,000 years for energy generated in the core to reach the surface and escape to space.
And it is similar here on earth except that convection is able to transport heat upwards right from the surface. It is only when the air is thin enough that some of the emtted radiation is able to escape to space. For the very peak of the CO2 absorption band this is up at 30-40 km up. However for much of the wavelengths around that between roughly 13-17 microns, the altitude is much lower, even down to around 2-3000 meters. There is a smilar behaviour for the other GH gases, depending on the profile of their spectral intensity.
Thus, athough the altitude at which the atmosphere becomes 'optically thin' varies significantly from wavelength to wave length, the average altitude at which it becomes optically thin, averaged for all GH gases, is around 5 km.
Hope this helps, and is clear.
-
Riduna at 10:52 AM on 11 February 2015A 23-year experiment finds surprising global warming impacts already underway
Interesting but neither the article or its referenced source – a précis – indicate the effect of infra-red heated plots in terms of what is to be expected from global warming this century. Nor does it appear to show likely effects on food crop yields which, after all, must be the primary concern of farmers, governments and a burgeoning hungry population.
-
scaddenp at 09:38 AM on 11 February 2015Increasing CO2 has little to no effect
Rob, conversation is here.
Quick. He has the equation wrong (note not explaining it). The correct answer is around 1.1C. However this is temp change from radiative forcing alone. Feedbacks (water vapour, albedo primarily) lift this higher to something in range 2-4.5C.
Jim needs to realise that just because he doesnt understand something doesnt make it wrong, especially on basis of a cock-eyed semantic argument. Secondly, if your understanding of something doesnt agree with actual measurements (eg the increase in DLR) and textbook calculations do, then guess who is wrong.
-
Rob Honeycutt at 09:29 AM on 11 February 2015Increasing CO2 has little to no effect
Ah! Just figured out where "Jim in CA" is getting his information.
Nasif Nahle Sabag.
The equation is a direct cut and paste.
-
Richard Treadgold at 09:20 AM on 11 February 2015Arctic sea ice extent was lower in the past
Thank you, gentlemen. Let me absorb this.
-
Rob Honeycutt at 09:14 AM on 11 February 2015Increasing CO2 has little to no effect
Where is this conversation going on, Quick?
-
Quick at 08:56 AM on 11 February 2015Increasing CO2 has little to no effect
Then same guy, (Jim in CA) added this:
"And yes, GHG theory is wrong. Here's an equation that shows the temperature increase moving from 280ppm to 560ppm:
ΔT = (0.443 W/m^2) ln[(560 ppmv/280 ppmv)] / 4 (5.6697x 10^-8 W/m^2*K^4) (300.15 K)^3 = 0.307 W/m^2 / 6.13 W/m^2*K = 0.05 K = 0.05 C = 0.09 F
That's it, just 0.09 F. Wow and double wow!! We're all going to die from heat exposure. LMAO Additionally, that value is most likely high as it's based merely on atmospheric partial pressure of CO2 and emissivity. It isn't taking into account the likelihood of energy transfer to other molecules with higher specific heats that can absorb the energy without changing temperature....molecules like water vapor.
And that brings me to another point. You morons are constantly saying that CO2 "traps" heat. Don't know about you, but to me if something is "trapped", then it's removed from the environment. "Trapping" heat would COOL things down, not warm them up. Additionally, the CO2 molecule at our atmospheric pressures and temps simply has TOO low of a specific heat to carry much thermal energy anyway. It doesn't have the thermal headroom. Sorry about your bad luck on that one.
CO2 is quite simply an energy conduit. Nothing more. It quickly transfers energy from one source to another without storing it."
-
villabolo at 08:18 AM on 11 February 2015Global warming is causing more extreme storms
@ the Griss:
Steven Goddard should be made aware of skeptic Roy Spencer's UAH temperature chart which is on model 5.6. Talk about changes.
-
Quick at 08:18 AM on 11 February 2015Increasing CO2 has little to no effect
Oh, and I have asked repeatedly for ANY any reference, but he deflects. My BS meter redlined when I first saw his original post, but I lack the bandwidth and advanced acumen to effectively debunk this. I also laid down the gauntlet for him to join here and engage. So far it's been met with more deflection.
Moderator Response:[JH] The use of "all caps" is akin to shouting and is prohibited by the SkS Comments Policy.
-
Quick at 08:13 AM on 11 February 2015Increasing CO2 has little to no effect
Glenn, I posted #182 and 183 almost verbatim. Here was his response:
When viewed under high resolution, EVERY gas has numerous small transitions along the entire EM spectrum. That has never been under dispute. I guess you can't distinguish between that and an absorption peak. And by the way, that also shows that EVERY gas is a "greenhouse gas."
Additionally, I'm well aware of the various factors that will influence absorption. Factors such as natural, temperature (also called Doppler) and pressure broadening. These same factors will also affect emissions to varying degrees.
But now you've shifted gears and are talking about ABSORPTION. As I recall, your beloved Greenhouse Gas Theory claims that CO2 absorbs and then "re-emits" a photon of IR. But that's not absorption since absorbed energy isn't re-emitted...at least below 85km in altitude. Below that altitude, absorbed energy is passed on to other molecules as KE during a collision. So I guess it looks like you've disproven your own beloved theory. Nice going.
As for my reference to Wien's displacement law, you have things backwards...which is normal for an AGW cultist. I reference it to show surface temperatures that will produce specific [peak] wavelengths that are emitted by a surface at that specific temperature, NOT to show what is being absorbed. Were you a breech baby as well?
But since you've deflected to absorption instead of scattering, I notice you left out the absorption coefficients of the TWO and ONLY two absorption peaks that are within the atmospheric window. Just so you don't have to waste time scrambling to try and find out what they are, they're 9.4 microns and 10.4 microns. Maybe you should post the absorption coefficients for all to see. You think?
-
Jim Eager at 06:47 AM on 11 February 2015Global warming is causing more extreme storms
JoeT, the northern shore of the Mediterranean basin is supposedly warming and drying in similar fashion as well. See this 2007 guest post at RealClimate by Figen Mekik: Sweatin’ the Mediterranean Heat.
-
Tom Curtis at 06:46 AM on 11 February 2015Kevin Cowtan Debunks Christopher Booker's Temperature Conspiracy Theory
Further to @54, here are the relevant figures for the test of the algorithm for GHCN v3 from Menne and Williams (2009):


As you can see, the algorithm reproduces the correct, zero trend regardless of whether the original data was distorted by upwards or downwards shifts. In otherwords, it shows no bias with regard to trends. The shift in the mean is because the algorithm always makes adjustments with reference to the final year (ie, effectively assumes the most recent measurement is accurate). It is inconsequential.
-
Tom Curtis at 06:28 AM on 11 February 2015Kevin Cowtan Debunks Christopher Booker's Temperature Conspiracy Theory
JH inline @49, and algorithm is just a proceedure that can (in principle) be automated. The algorithms used for quality control and homogeneity adjustment for GHCN v3 are described in Lawrimore et al (2011). (Off course, sometimes the description consists of a reference to an earlier paper.) Essentially, for homogeneity adjustments, they come down to comparing the temperature series to a set of nearby stations with a high correlation with that station. If there is a sudden, large shift in temperature in a particular station that is not found in its neighbours, it is assumed that there has been some change in circumstances at that station and an adjustment is made. The essential point is that there is a hard rule as to when, and by how much the adjustment is made based on the number of nearby stations, and the level of divergence. The algorithm does not look up the date, and nor does it look up the geographical region in making the adjustment. The detailed description of the method can be found in Menne and Williams (2009), along with a description of a test of the method using artificial data with random change points.
-
FrancisMcN at 05:37 AM on 11 February 2015Kevin Cowtan Debunks Christopher Booker's Temperature Conspiracy Theory
MA Rodger and Tom Curtis many thanks for your recent posts which have given me the real meat I was after to be able to just maybe change a potential UKIP voter's mind or at the very least make him change the subject! However much it is true that Brooker is unworthy of his prominence, the trouble is that a lot of local decision makers in my neck of the woods take his output as the truth until something more convincing is offered instead.
-
JoeT at 04:26 AM on 11 February 2015Global warming is causing more extreme storms
Figure 2 in the Abraham et al paper shows localized regions of increased drying in the Southwest, as one might expect due to the poleward expansion of the Hadley circulation. Is it possible to say with some degree of confidence that the Hadley circulation is the responsible culprit for this drying? If so, are there other places in the world where the drying can clearly be attributed to the expansion of the circulation, or places where this explanation doesn't hold. I'm asking this in part because of Richard Seager's 2007 paper which models and predicts this increased drying and the recent NOAA report on drought in California (Seager was the lead author) which claimed that the drought was not due to long-term climate change.
-
wili at 03:57 AM on 11 February 2015A 23-year experiment finds surprising global warming impacts already underway
Good points. I in no way meant to imply that the oceans would
"provide CO2 salvation." Only that they are important in understanding the short term dynamics of CO2 exchange going forward.Once equilibrium is reached, offgassing from the oceans will keep atmopsheric CO2 levels high for thousands of years, at least.
Moderator Response:[JH] Please provide a citation for your concluding statement. Thank you.
-
Tom Curtis at 03:43 AM on 11 February 2015Kevin Cowtan Debunks Christopher Booker's Temperature Conspiracy Theory
MA Rodger @50, I'm waiting for them to turn their attention to all the adjustments nature has been making to sea ice extent in the Arctic. All those natural thermometers must be in on the conspiracy along with NASA and NOAA and the former temperature record skeptics at BEST.
-
MA Rodger at 03:38 AM on 11 February 2015Kevin Cowtan Debunks Christopher Booker's Temperature Conspiracy Theory
Link to NOAA directory @50 goes elsewhere. Here is where it should go.
-
MA Rodger at 03:34 AM on 11 February 2015Kevin Cowtan Debunks Christopher Booker's Temperature Conspiracy Theory
The case presented by the Homewood blog really rests on 19 station data plots from NOAA. The whole set of such plots are available from this directory although to be useful the station ID numbers are needed. NASA have a good tool for finding those.
I'm sure FrancisMcM @47 will find some stations with the trend in warming reduced rather than increased by adjustment. The first Arctic station I picked Barrow in Northern Alaska showed reduced warming following adjustment.
Of course, it is difficult to imagine that this Homewood character is doing anything more than cherry-picking stations. After all UAH show a similar warming to NASA GISS in the Arctic (graphic here (usually two clicks to 'download your attachment' shows Arctic GISS annual & UAH TLT winter & summer temperature record) and that is obtained without surface station adjustments. Then perhaps Homewood & Booker will be next turn their attentions to the satellite adjustements of Roy Spencer.
-
Tom Curtis at 01:52 AM on 11 February 2015Kevin Cowtan Debunks Christopher Booker's Temperature Conspiracy Theory
FrancisMcM @47, I am not charging you of crying wolf. Rather, that is a charge that I am directing at Booker and Homewood. With regard to stations that show cooling adjustment, the three found by Nick Stokes and the three I found among Homewood's lists of (purportedly from context, warming) adjustments gives you a start. If you want to look further, Steve Mosher from the BEST team cites the entire continent of Africa, which has a warmer trend in the undadjusted than in the adjusted data (although various stations within Africa will differ). Then there are the SST which show a very strong cooling adjustment, sufficient that overall the global surface temperature record trend is reduced by adjustments, not increased.
None of that, however, will persuad those who are not persuaded by the simple fact that the adjustment algorithms, which are applied automatically, are blind to the direction of adjustment or time in the century. That is, they have no inherent bias so that any bias in the adjusted data is entirely a product of the data itself.
Moderator Response:[JH] It would be helpful to our readers if you were to provide a definition of "algorthim" and reference some background materials about it. Thanks.
-
Tom Curtis at 01:37 AM on 11 February 2015Kevin Cowtan Debunks Christopher Booker's Temperature Conspiracy Theory
I just had a brief look at Homewood's blogpost on which the Booker article is based. Homewood claims to find 19 out of 23 Arctic records adjusted. It turns out, however, that he only looked at north Atlantic and northern European stations (51o W to 87o E, or from the West Coast of Greenland to north of the Urals). We learn this from a revision to his post brought about by Nick Stokes noting three stations that showed cooling. What concerns me is that in the area that Homewood definitely claims to have analyzed, only two (Vestmannayja and Reykjavik) show a strong warming adjustment. The remaining 17 of the 19 adjusted stations show weak warming adjustments at best, and in Trommaskato, Marlye Karmaku, and Turuhansk show cooling adjustments. Others may also show cooling adjustments as I have not gone over them in detail. The two stations showing a strong warming adjustment are both in Iceland. However, Akuyeri and Stykkisholmur, the other to Icelandic stations, show virtually zero, and only a slight change in trend from adjustments respectively. It follows that the two Icelandic stations with large adjustments, whose temperature histories do not agree with each other, nor with the two Icelandic stations in close agreement, did require adjustment.
In all, Homewood has concealed in his discussion the fact that several of the adjustments to stations of which he talks resulted in a reduced warming trend; that the only two requiring large adjustments were discordant with each other and the other two stations on the same small island, and that overall the adjustments in less than half of the Arctic has only a small effect on the overall trend in that region.
I ask again, why are we paying attention to the boys who cry wolf?
Moderator Response:[JH] Like it or not, the buzz created by Brooker's Feb 7 Telegraph propaganda piece, The fiddling with temperature data is the biggest science scandal ever, is starting to gain attention in the MSM. Personally, I believe this particular propaganda piece is designed to divert attention from, and cast aspersions on, the ongoing UN climate talks in Geneva.
-
FrancisMcN at 01:12 AM on 11 February 2015Kevin Cowtan Debunks Christopher Booker's Temperature Conspiracy Theory
Tom Curtis at 46 - no wolf seen here just a desire to have the most authoritative and directly applicable rebuttal to the outpourings of a tiresome character who unfortunately seems to get a lot of attention in my part of rural Devon (the 21K+ comments to the on-line article also suggest a fair following!).
Kevin's speedy response was very welcome as was his original item and I will do my best to delve into the data as he advises but I fear that is not going to be a easily deliverable way of convincing the sort of Telegraph reader that takes Booker's items at face value. I was wondering if there are some good examples of data adjustment where the same principles have resulted in reduced temperature in recent years that could be quoted to show that the adjustment cuts both ways? Perhaps I'll just have to start looking but I would be grateful for any suggestions!
-
One Planet Only Forever at 00:45 AM on 11 February 20152015 SkS Weekly News Roundup #6B
Here is a potential article on the CBC website for next week's News Round-up:
"Climate scientist Andrew Weaver wins defamation suit against National Post"
-
Tom Curtis at 23:27 PM on 10 February 2015Kevin Cowtan Debunks Christopher Booker's Temperature Conspiracy Theory
FrancisMcN @44, have you heard the old fable about the boy who cried wolf?
I ask because the people who have been crying wolf about the temperture record have been at it for a long time. They have been repeatedly proven wrong. They have been proven wrong in detailed cases where time after time the adjustments they claim are unwarrented have been shown to be in fact completely warrented. They have certainly been proven wrong in the overall picture, where it has been shown repeatedly that they cherry pick instances of adjustments which warm the local record (when there are almost as many on land that cool the local record); and where it has just been shown that the overall effect of all adjustments of land and SST records combined reduces the warming trend in the twentieth century:
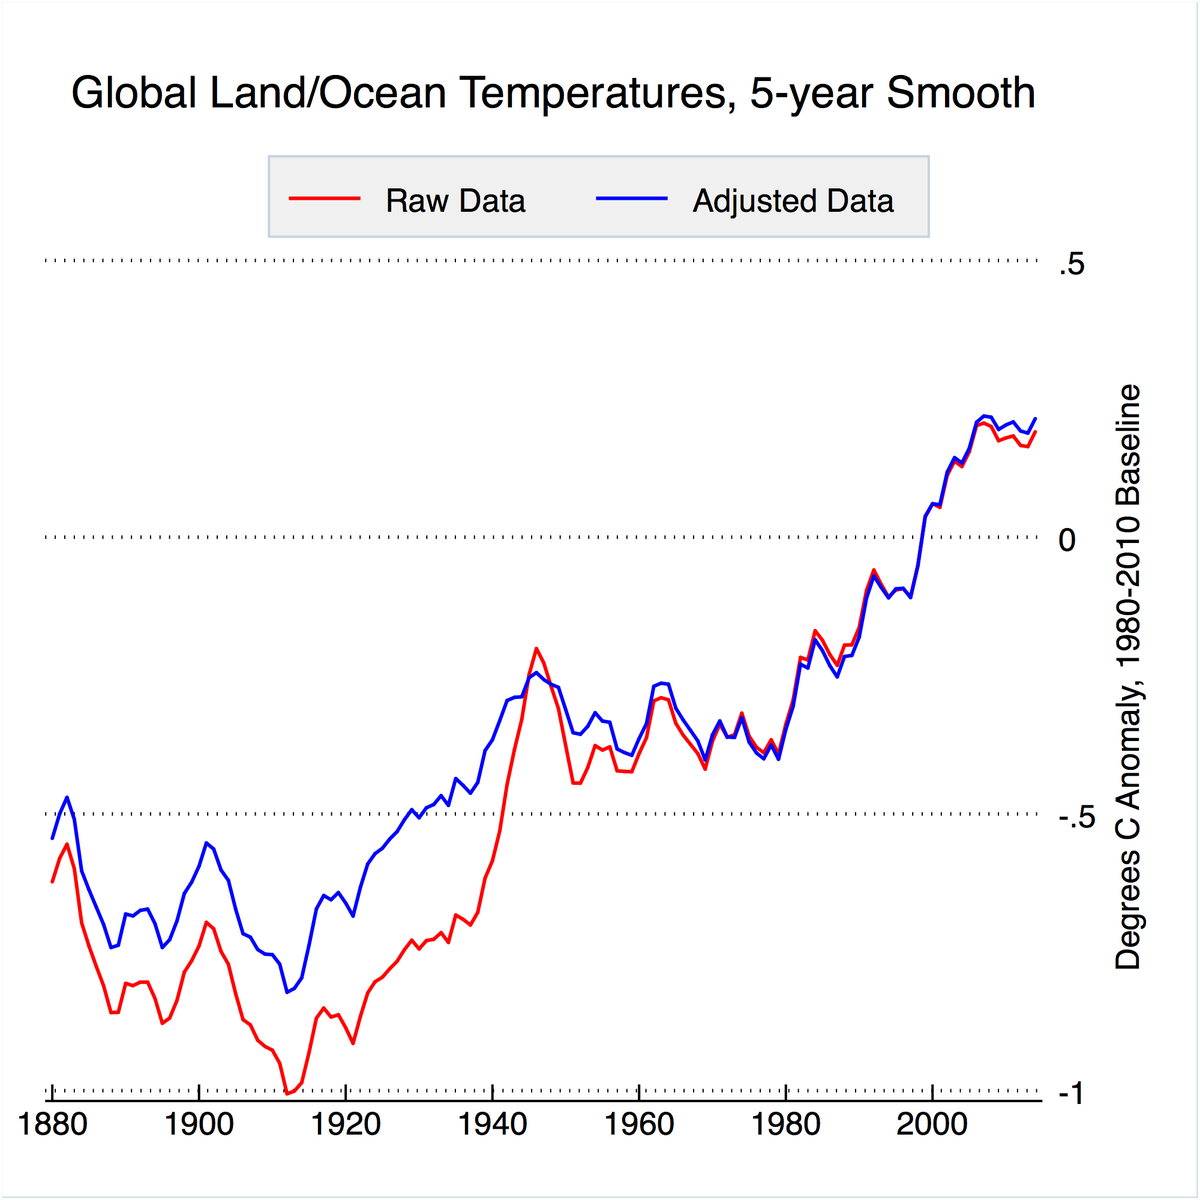
Given this, you have to wonder why anybody still pays attention to the Bookers of this world. The reason, of course, is that "The boy who cried wolf" is an old fable. In these modern time, proving that you have repeatedly misinformed the public just gets you repeat columns in the Murdoch press. Some people, and some media are more intent on the political effect of what they say than the truthfulness (and in this case it is very clear cut who they are).
-
Tom Curtis at 23:07 PM on 10 February 2015Arctic sea ice extent was lower in the past
Richard Treadgold @2, Cryosphere Today is reporting an area 12.8 million km^2 as we approach the spring maximum in sea ice area (and extent). Kinnard et al reports on the sea ice extent at the "late summer" (September). As can be seen from the Cyryosphere today graph (below), the September Minimum is has recently been around 4 million km^2, ie, significantly less than approximately 8 million km^2 shown at the end of the Kinnard et al reconstruction.

The reasons the final reconstructed values are near double the comparable values in the Cryosphere today chart are because it is a reconstruction of extent, whereas the graph shows area; because the reconstruction is unlikely to have achieved resolution of a single month, and therefore shows a two or three month average; and because late summer sea ice extents have reduced significantly since the end of the reconstruction (1995).
-
CBDunkerson at 22:56 PM on 10 February 2015Arctic sea ice extent was lower in the past
Richard, the first problem is that you are treating two different things as if they were the same. Cryosphere Today reports sea ice area. The second graph above shows sea ice extent.
The precise meaning of 'extent' varies from source to source, but the majority use something like 'the area of ocean surface with at least 15% ice coverage'. So, if you had a 100 meter x 100 meter section of ocean with 15% of it covered by ice that'd be a sea ice extent of 10,000 square meters, but a sea ice area of only 1,500 square meters.
Second problem - You are comparing daily values to decadal values. Look at the Cryosphere Today charts again and instead of looking at the current (near winter maximum) values look at the annual minimums instead... 1979-2008 mean below 5 million sq km... OMG, that's far lower than anything in the chart above! There must have been a huge sea ice collapse! Or not. Obviously the ice extent and area vary wildly throughout the year. Since the chart above is showing the extent averaged over decades these inter-annual fluctuations are averaged out.
Third problem - What constitutes 'the Arctic'? Just the 'Arctic circle'? The 'Arctic basin'? Any region north of the equator which has ever had sea ice coverage? Different data sets are looking at different regions.
-
Richard Treadgold at 21:37 PM on 10 February 2015Arctic sea ice extent was lower in the past
Hi. I came looking for historical Arctic sea ice coverage and saw this article for the first time. The figures looked wrong. You say the Arctic sea ice extent has rumbled along at about 10 to 10.5 million sq. km for 1450 years before suddenly plunging to 8.5 m sq. km about 1950 (maybe later - hard to tell with that resolution). But Cryosphere Today reports 12.8 m sq. km today, and the 1979-2008 mean they use is about 13.7 m sq. km. This means no modern decrease as shown on your graph. What's going on?
-
ranyl at 21:34 PM on 10 February 2015A 23-year experiment finds surprising global warming impacts already underway
HI Wili,
See article at HTML.
There is no doubt that the oceans have been a major sink, however as temperature rises water can absorb less and less CO2,
http://www.rtcc.org/2012/01/24/warming-oceans-face-co2-tipping-point/
also as they acidify oceanic sinks can turn to sources.
http://www.climate.org/topics/climate-change/ocean-uptake-climate-change.html
Further the oceanic desserts are growing, and dead zones increasing and biodiversity is dropping all of which will not help the future prospects of CO2 absorption.
Further again, as the southern hemisphere warms and the winds move south they draw up more water from the depths and this water is CO2 rich and releases CO2 from the ocean's depths and warms the base of the below sea level based ice sheets.
Therefore not sure the oceans will provide CO2 salvation.
Not unless through our actions (or none actions (i.e. not putting toxic waste in the water)), an oceanic ecosystem and biodiversity boom can be utilized, still going to lose many coral reefs, not sure what happens to CO2 releases associated with coral die offs?
Moderator Response:[JH] Links activated. Please take the time to learn how to use the Editor's link insertion tool. Thank you.
-
Kevin C at 19:10 PM on 10 February 2015Kevin Cowtan Debunks Christopher Booker's Temperature Conspiracy Theory
Again, you can do it with the SkS tool. Use just the land data, and deselect all but two rightmost latitude band buttons (60-75 and 75-90N).
If you just use the 75-90N zone, it indeed looks as though the Arctic hasn't warmed. But if you look at the coverage graphs you'll see why: Coverage is down to a single station before 1940, and no more than 7 in recent decades. This sort of meaningless plot has been going round for a long time, see for example this graph.
With a larger set of stations you get a meaningful record.
Ideally we'd like to calculate a record for just the Arctic, but allowing stations from just outside the Arctic to contribute for locations where they are closer than any Arctic station. You can do that using the KNMI climate explorer, but that doesn't give access to the unadjusted data. Select GISS or Cowtan & Way, and then give a latitude range on the next screen. You can also compare to the ERA-interim reanalysis on the monthly indices page.
-
the Griss at 19:05 PM on 10 February 2015Global warming is causing more extreme storms
Hi,
Steven Goddard is always going on about adjustments etc, yet will not answer a question as to why USCRN and USHCN match so well since 2005 when USCRN was created..
Why won't he answer?
-
FrancisMcN at 18:54 PM on 10 February 2015Kevin Cowtan Debunks Christopher Booker's Temperature Conspiracy Theory
Getting back to original aim of this blog entry, Christopher Booker has come back to the issue of data management (Adjusting climate data is the biggest science scandal ever http://www.telegraph.co.uk/news/earth/environment/globalwarming/11395516/The-fiddling-with-temperature-data-is-the-biggest-science-scandal-ever.html ) and further suggestions by Homewood of incorrect adjustment, this time in the Arctic. Is there a clear rebuttal of Booker's latest claims available?
-
Kevin C at 18:02 PM on 10 February 2015Kevin Cowtan Debunks Christopher Booker's Temperature Conspiracy Theory
Tom: In the green box under the temperature tool there is a link to the blog post, which technically answers your question but only if you make a number of correct inferences about what is going on. So I'll try and provide a direct answer.
Land and ocean map series are reconstructed separately, and then combined. That's what all the major record providers do, because it's the right thing to do. While this is clear from even rudimentary analysis, I'm not aware of a careful treatment of the question in the literature however. It's on my to do list, but I've been a bit sidetracked recently.
As a result, if you provide only land or only ocean data, you get a pure land or ocean temperature series.
There is one subtlety however - the fill butttons. In grid box (i.e. CRU) mode, turning these off means that coastal cells get downweighted accoding to the amount or land (or ocean for an SST reconstruction) in that cell, which is the right thing to do. If you turn them on, then coastal cells count at full weight when using just land or just ocean, which overweights the coastal cells.
Off the top of my head I can't tell you for sure which the Hadley SST series do, but I think it is the latter. So the safest course is to calculate both adjusted and unadjusted series with your preferred option.
When doing a land-ocean reconstruction, the fill buttons play less of a role, because a cell with both land and ocea data is always constructed from a weighted combination according to the land fraction in the cell.
The data you need are the GHCN tavg .inv and .dat files for land, and the HadSST gridded data for the oceans. Look for HadSST.3.1.1.0.median.zip and HadSST.3.1.1.0.unadjusted.zip. In each case don't forget to unzip them.
The fix to work with recent SST files doesn't seem to have made it into SkS yet, so for the short term I've made a working copy available here. This will be removed once the SkS version is fixed.
If you continue to have problems, say so and I'll do a screencast on it. As a software author it is never possible to know if your software is useable except through feedback from people trying to use it.
Prev 616 617 618 619 620 621 622 623 624 625 626 627 628 629 630 631 Next


