


 Arguments


Recent Comments
Prev 619 620 621 622 623 624 625 626 627 628 629 630 631 632 633 634 Next
Comments 31301 to 31350:
-
Tom Curtis at 12:53 PM on 6 February 2015Kevin Cowtan Debunks Christopher Booker's Temperature Conspiracy Theory
Tom Dayton @16, daveburton was incorrect (see my point 2 @17 above), but neither he nor I were talking about the simple anomaly on that point. Rather, we are talking about the adjustments, the difference between raw and homogenized data, which also shows substantial short term variability. Just not as much as the actual anomaly, and much less over the last 50 years.
-
Tom Curtis at 12:51 PM on 6 February 2015Kevin Cowtan Debunks Christopher Booker's Temperature Conspiracy Theory
daveburton @14:
1)
"You are correct, Tom, but his graph was for the last 114 years, and his conclusion ("why would they [bother to] do that") only makes sense if the sum of NOAA's adjustments were inconsequential. It doesn't make sense if NOAA's adjustments were only inconsequential for one cherry-picked time interval, and very consequential for the whole record."
I indicated a couple of very substantial reasons as to why we should concentrate on the period since 1950. Because there are substantive reasons for the choice of time period, it is not a cherry pick. Suggesting that it is without adressing those reasons amounts to simple name calling as an argument. However, leave that aside.
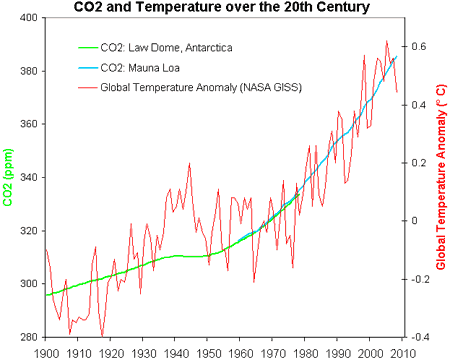
The simple fact of the matter is that the majority of early twentieth century warming is natural in origin. Anthropogenic factors account for approximately a third of that warming, or according to one recent analysis, effectively none of it. This can be seen by the relative slopes of temperature and CO2 concentration in the early, and late twentieth century:
More substantively, comparing model retrodictions with global temperatures shows the models substantially underpredict the global trend in the early twentieth century:

(Note, the pink shaded area is the model prediction for anthropogenic plus natural forcings.)
That discrepancy can be accounted for almost completely by reference to short term variability not included in model forcings, primarilly ENSO, although the unusual warmth in the 1940s is still not accounted for.
So, with this knowledge in hand, your argument then becomes that the people at NOAA increased temperature trends in the early twentieth century when such increases run contrary to the AGW narative, but did not significantly increase trends in the late twentieth century where such increases would have supported the narrative.
Expanding the analysis beyond the late twentieth century does not make the theory of dishonest adjustments any more plausible. It just means you need to understand more background information to understand the relevance of what is happening.
2)
"You're right about the temperatures, Tom, but that's not what's being compared (by Dr. Cowtan, and by me). What's being compared is the temperature adjustments (i.e., the difference between adjusted and unadjusted temperatures), and they do not exhibit much short-term variability."
Here are the difference between raw and final USHCN temperatures:
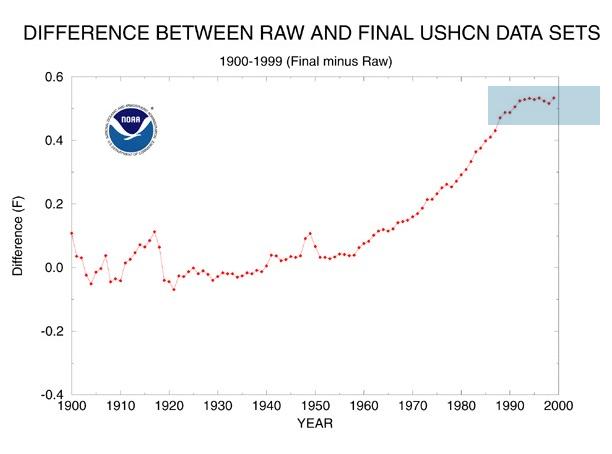
Very clearly, you are wrong to claim "...they do not exhibit much short-term variability". There is substantial short term variablity, particularly in the early twentieth century, and particularly for 1900 itself. That is, of course, for the contiguous United States. Unfortunately I do not know of a similar chart for the global land record, but there is no reason to think it would also lack variability from year to year in adjustments. So while the adjustments show less short term variability than do the actual temperatures, never-the-less, they show substantial short term variability and comparisons of differences should be made using trend values.
3)
"SST is not air temperature, and, unfortunately, the SST data quality through most of the 20th century is even sketchier and subject to more adjustments than the land air temperatures."
First, it would be nice if there was a more or less continuous, global record of air surface temperatures at 2 meters above sea level. Unfortunately no such record exists, so you make use of the records you in fact have rather than pretend to complete ignorance. Those records are, however, strongly relevant. As anybody knows, who has lived both inland and near the sea, the thermal mass of the surface waters mean they absolutely dominate the variability in nearby air masses. That is so even 50 km inland, let alone a mere 2 meters above the surface of the water. Although there will be some difference in the actual values between SST and 2 meter air temperature immediately above the surface, they will not be large and they will be consistent so that trends in the former would have been reflected in trends in the later.
Given this, I regard your exclusion of SST from the record of interest as a mere cop out. It is particularly the case given that all Global Mean Surface Temperature records use SST data over oceans, for want of any better record to use.
Second, the SST temperature data is in fact very extensive, although it does show some coverage lapses (as does the land record), particularly in the Southern Ocean.
Third, while the SST data is also subject to adjustments, they are not subject to "the same adjustments":

(Source)
As you can see, while the net effect of adjustments on land has been to cool the early twentieth century relative to the late twentieth century, the net effect on SST has been the opposite. That is, it warms the early twentieth century relative to the late twentieth century. That is, it reduces the twentieth century temperature trend.
So, if we look at the actual data, it does not support your dismissal, which is shown to be glib, and misleading. Contrary to the impression you convey, combining land and SST data will reduce the global trend from 1900 more than would be the case by simply diluting the 30% land coverage with data with no trend adjustment.
4)
"You can't do that, Tom. It's mathematically incorrect. The percentage difference isn't a sum that you can divide by 11.5 to get the per-decade adjustment-generated percentage difference in warming, it's an average."
Then it is a good thing that that is not what I did. Rather, I projected the difference in adjustment over the last 50 years back over the record to 1900. That, of course, only gives a ball park figure, and given the additional data noted at point three above, underestimates the reduction in the difference for global figures. It is near enough, however, for this discussion.
-
Tom Dayton at 11:05 AM on 6 February 2015Kevin Cowtan Debunks Christopher Booker's Temperature Conspiracy Theory
Dave Burton, you are incorrect that the temperature anomalies do not exhibit much short-term variability. For example, see the escalator graph.
-
Tom Dayton at 10:18 AM on 6 February 2015Kevin Cowtan Debunks Christopher Booker's Temperature Conspiracy Theory
No, Dave Burton, it is not okay to compute trends by merely connecting end points. You need to compute a regression line. Seriously, a 900% change?!
-
daveburton at 09:50 AM on 6 February 2015Kevin Cowtan Debunks Christopher Booker's Temperature Conspiracy Theory
michael sweet wrote, You have mislabeled your graph. In the video the graph is clearly labeled NOAA Paraguay data. You have changed the label to Globally averaged Land Surface data."
No, Michael, that graph is global. Listen to Dr. Cowtan describe it, at 3:30:
https://www.youtube.com/watch?v=qRFz8merXEA#t=210
He says, "We can calculate a global land temperature record using..."Tom Curtis wrote, "in the video Kevin Cowtan says (3:55) that "... the NOAA adjustments make only about a 3% difference to the amount of warming over the last 50 years" (my emphasis)."
You are correct, Tom, but his graph was for the last 114 years, and his conclusion ("why would they [bother to] do that") only makes sense if the sum of NOAA's adjustments were inconsequential. It doesn't make sense if NOAA's adjustments were only inconsequential for one cherry-picked time interval, and very consequential for the whole record.
For instance, if you compare the adjusted to unadjusted warming for the first 70 years of the graph (1900 to 1970), instead of the last 50 years, you'll find that the adjustments increased the net warming by more than 900% (from 0.025 °C to 0.257 °C).
Of course, you're probably saying to yourself, "but that's cherry-picking!" — and you're right. But no more so than just examining the last 50 years is cherry-picking.
Tom continued, "you have made your determination simply by comparing end points. Because of the high short term variability of temperatures, such comparisons can easilly mislead by showing atypical values."
You're right about the temperatures, Tom, but that's not what's being compared (by Dr. Cowtan, and by me). What's being compared is the temperature adjustments (i.e., the difference between adjusted and unadjusted temperatures), and they do not exhibit much short-term variability.
Tom continued, "it is the land only data, of which Kevin Cowtan indicates their is a 10% difference after adjustments."
But that's only for the cherry-picked last 50 years.
Tom continued, "That 10% is reduced to 3% by the inclusion of SST data."
SST is not air temperature, and, unfortunately, the SST data quality through most of the 20th century is even sketchier and subject to more adjustments than the land air temperatures.
Tom continued, [if you multiply by 30% because only 30% of the globe is land] "your 35% would reduce to approximatly 11% difference over a 115 year interval, or less than 1% difference per decade."
You can't do that, Tom. It's mathematically incorrect. The percentage difference isn't a sum that you can divide by 11.5 to get the per-decade adjustment-generated percentage difference in warming, it's an average.
-
John Cook at 08:39 AM on 6 February 2015Scott Mandia on teaching students to debunk climate misinformation
Thanks for your comment - I'll be in touch, would be interesting to hear more about your course and you may be interested in our upcoming MOOC, Making Sense of Climate Science Denial, which will include a great deal of creative commons material available for educators and communicators.
-
Tom Dayton at 08:09 AM on 6 February 2015Kevin Cowtan Debunks Christopher Booker's Temperature Conspiracy Theory
Zeke Hausfather has an excellent post on adjustments to temperature, though at an unfortunate site.
-
Runrig at 06:26 AM on 6 February 2015Lessons from Past Climate Predictions: IPCC FAR
Folks,
Further to posting my/your input over at Phys.org, Mr bell posted up this (whilst not acceding defeat).
"Thank you Tony for your honest analysis and discussing the content of my claims. I'll pursue this at the discussion thread you provided.
It's too bad there aren't more people on this thread with intellectual honesty, but I do appreciate yours."
So you may well be able to take him in in person.
PS: he has been generally polite (and always with me), except when when goaded.
Tony
-
Maggnum at 06:14 AM on 6 February 2015Lessons from Past Climate Predictions: IPCC FAR
I just want to comment on the well thought out answers on this thread, with thanks. I should have thought to have brought the problem here, and thanks Tony for doing so.
Mr. Bell is somewhat less objective than he holds himeslf out to be. Tom. your review seems to hit the crux of the issues - Mr. Bell is using a deceptive and incomplete "analysis" as a means to call the IPCC as a whole deceptive or incompetant. I think that, in and of iteself, is enough to put his "analysis" into its proper perspective.
Thank you Tom for looking into it, and thank you Tony for bringing it here for review.
-
Tom Curtis at 04:23 AM on 6 February 2015Kevin Cowtan Debunks Christopher Booker's Temperature Conspiracy Theory
daveburton @9 and @10, in the video Kevin Cowtan says (3:55) that "... the NOAA adjustments make only about a 3% difference to the amount of warming over the last 50 years" (my emphasis). By comparing the range from 1900-2014, you are not checking his claims, but an entirely different claim that he did not make. You may think this is a minor point, but in fact the key attribution statement for the IPCC is with regard to the period 1950-2010. That is, it is with regard to (approximately) the last half century. There are several reasons for that, one of which is the relative accuracy of the temperature record post 1950. Consequently there are substantive reasons why the IPCC and Kevin Cowtan concentrate on the most recent 50-60 years.
Further, on checking your spreadsheet it becomes very apparent that you have made your determination simply by comparing end points. Because of the high short term variability of temperatures, such comparisons can easilly mislead by showing atypical values. To avoid this, the correct method is to determine the respective trends, and compare them directly, or if you insist on comparing end points, compare the endpoints of the trendlines. This is particularly the case as it is future temperature trends we are concerned with. Comparing the endpoints for 1950-2014 (14% difference by your method), 1965-2014 (10% difference by your method) shows the effect of increasing accuracy overtime resulting in less difference between adjusted and unadjusted data, and highlights the problem with using endpoints.
Finally, although Michael Sweet is incorrect to describe the graph as Paraguay data, it is the land only data, of which Kevin Cowtan indicates their is a 10% difference after adjustments. That 10% is reduced to 3% by the inclusion of SST data, and we could expect a similar scale of reduction in your figure if it compared land/ocean temperature data rather than land only data. That is, your 35% would reduce to approximatly 11% difference over a 115 year interval, or less than 1% difference per decade.
-
michael sweet at 03:42 AM on 6 February 2015Kevin Cowtan Debunks Christopher Booker's Temperature Conspiracy Theory
DaveBurton,
You have mislabeled your graph. In the video the graph is clearly labeled NOAA Paraguay data. You have changed the label to Globally averaged Land Surface data. Dr. Cowtan points out that such a change in the Paraguay data would only affect Global data by 3%.
How could you make such a large error by mistake? It appears that you are deliberately trying to mislead whoever you show your mislabeled graph. This must be a conspiricy to defraud the public about this data. Who is paying you to make these fradulent claims?
It is well known that change of time of reading and change in temperature monitoring stations can make readings this different. The installation of Stephenson screens as described in 5 above woud cause this change.
It is easy to claim dramatic changes have been made when you mislabel the data.
-
daveburton at 03:37 AM on 6 February 2015Kevin Cowtan Debunks Christopher Booker's Temperature Conspiracy Theory
I didn't say that very well.
"...had increased globally averaged land surface temperatures by 35%"
should have been:
"...had increased the warming seen in globally averaged land surface temperatures by 35%" -
daveburton at 02:53 AM on 6 February 2015Kevin Cowtan Debunks Christopher Booker's Temperature Conspiracy Theory
Dr. Cowtan's final argument was that the adjustments were too tiny to be suspicious. “Why would they do that?” he asks at the end of his video, meaning why would anyone commit fraud for an inconsequential difference in the result?
However, I digitized the endpoints in the last graph which he showed in his video, and found that NOAA's adjustments had increased globally averaged land surface temperatures by 35%.
35% is not inconsequential.
The graph w/ comments, and a small spreadsheet with the numbers, are here:
http://tinyurl.com/cowtan-v-booker
Here's a half-size version of the annotated graph: Moderator Response:
[RH] Adjusted image size.
-
howardlee at 02:34 AM on 6 February 2015Claims that climate models overestimate warming are 'unfounded', study shows
In the long view, paleoclimate work presented in the AGU14 for the Miocene suggests sensitivities at the upper end of the IPCC range. In other words, the bahavior of Earth's climate in the past does not support the idea that model-based projections are overstated. If anything they suggest the opposite. There should hopefully be a post on this coming out in a few days.
-
swampfoxh at 01:57 AM on 6 February 2015Scott Mandia on teaching students to debunk climate misinformation
I have been teaching a course, "Global Warming: Proof or Politics?", designed for the general public using, for classroom space, public library meeting rooms in two counties in Virginia. I would like to correspond with skepticalscience.com people who are trying to get proper climate change information out to the public. My email is swampfoxh@hotmail.com
-
Lessons from Past Climate Predictions: IPCC FAR
I'll bow to Tom Curtis's far better researched answer on this one. :)
-
Runrig at 21:57 PM on 5 February 2015Lessons from Past Climate Predictions: IPCC FAR
Tom,
thanks again - I've put the latest response from you here ...
http://phys.org/news/2015-01-climate-dont-over-predict.html
And have suggested Mr Bell call in here for more "learned" discussion.
Oh, and if you'd care to call in on Phys.org to make comments you'd be more than welcome!
Tony
-
Bart at 20:30 PM on 5 February 2015Climate researcher Bart Strengers wins wager with climate sceptic Hans Labohm
Thanks a lot for all your comments!
Below I tried to answer most of them:
@ranyl: I surely have considered that the CS might be higher. I just explained why the lower bound of the IPCC-range has been lowered from 2.0 to 1.5 in AR5.
Studies of my institute (Netherlands Environmental Assessment Agency, PBL) show that a >50% change to keep the warning limited to 2 degrees, implicates a major emission reduction effort with negative emissions by the end of this century.
If you want a bigger than 95% change, this reduction effort will be even higher. We did not study the implications of even lower temperature limits, but I think you are right this might result in a current negative carbon budget.
@Wili: I did not write we have 0.1 degrees warming in 5 years, but that the average temperature in the period 2010-2014 was 0.1 degrees higher than the average of the 10 years before that. TonyW explains how this results in 0.15. (UAH has a linear trend of 0.14 starting in 1979 by the way). Furthermore, you are right that volcanoes can result in a ‘cold’ year and thus can have a large influence on the average of an extremely short period of just 5 years. This is precisely one of the reasons why I said in 2009 that I could lose the wager.
@jja: Interesting publication. In the Dutch media I wrote that I think that the change the next 5 years will be warmer again than the 10 before is at least as big as 5 years ago. Aerosol emission reductions in China - as far as it is really true, given the discussion in this tread - might be another reason why this will probably be the case.
@Paul W and Philippe: You are right there is a problem there. What I meant in 2009 is that the integral of the pdf on the left of the ‘best estimate’ of 3.0 is smaller than the integral on the right. In other words P(ECS<3.0) < P(ECS>3.0). P(ECS<3.0) is the chance that the real world ECS is lower than the best estimate and thus that the best estimate is an overestimation. And according to the same reasoning P(ECS>3.0) means that the best estimate is an underestimation. However, there are two problems here. The first is that I am not so sure anymore that the proposition P(ECS<3.0) < P(ECS>3.0) was actually true in 2009. I would love to hear your opinion on that. The second problem is that in AR5 there is no best estimate anymore, so it is actually impossible to say whether my proposition still holds. Because it was too complicated to explain this to a broader audience, I tried to make the point I did. I might have done that differently now, though.
-
chriskoz at 10:11 AM on 5 February 20152015 SkS Weekly News Roundup #6A
The article about battery storage & demise of fossil fuels is very interesting. Especially the actual link to the Citigroup report therein that I repeat here:
solar-battery-storage-socket-parity
Important part of this analysis is the fact, as the article notes:
Figure [therein] illustrates Citigroup’s point. It assumes a large portion of the solar output is self-consumed rather than sold to the grid, so the ‘income’ is primarily avoided electricity bills rather than energy sales.
That's exactly what;s happening in Australia: demand for electricity drops as rooftop panel penetration grows. However, I'm not sure how they incorporated that change in consumption model in their prediction of parity. To learn more, it's worthwhile to visit (or at least watch the outcome of:
2015 Australian Energy Storage Conference in Sydney -
Tom Curtis at 09:09 AM on 5 February 2015Lessons from Past Climate Predictions: IPCC FAR
Runrig @18, I get slightly different values, particularly for the upper range as note in my prior comment. However, given that I must judge the year by eye, and given that the reproduction of the graph shows it was a photocopy of a page, not perfectly flat on the plate, I would not argue the toss. Two points, however. First, Bell bases his analysis on the range of BaU through to scenario D on just one climate sensitivity value, rather than just BaU across the range of climate sensitivity values. Second, you mention "the full range of of scenarios". I think it is better to be more precise and mention the range of scenarios and climate sensitivities.
-
Runrig at 05:46 AM on 5 February 2015Lessons from Past Climate Predictions: IPCC FAR
Tom,
Thanks for the heads up on the full range of scenarios shown by AR5 ... I think the answer is therefore a simple one.
Bell is basing his analysis on the basis of just the BaU scenario ... so examining the 2 extremes of the graphs (fig 6.11), I get a range of 0.5-1.9C above '90 (+/- 0.1C) ... which is what is shown in the AR% graph!
Tony
-
Tom Curtis at 03:49 AM on 5 February 2015How we discovered the 97% scientific consensus on man-made global warming
Stranger 26, Mike Hulme gives every appearance of having become a post modernist. Do not expect too much in the way of rational behaviour from him.
-
Tom Curtis at 03:46 AM on 5 February 2015Lessons from Past Climate Predictions: IPCC FAR
Runrig, I disagree with KR's assessment. The reason is that if you look at the IPCC FAR Chapt 6, fig 6.11, you will find it shows three panels. Panel (a) shows the high (4.5 C per doubling) climate sensitivity estimate; panel (b) shows the moderate (2.5 C per doubling) climate sensitivity estimate; and panel (c) shows the low (1.5 C per doubling) climate sensitivity estimate:

Comparing differences between 1990 and 2035, as best as I am able, the top of the range is BaU in panel (a), with an approximatley 3 C increase. In contrast, the bottom of the range (scenario D in panel (c)) shows less than 0.5 C increase. That, then, is the full range.
Now, if the climate sensitivities had been reduced inline with KR's arguments, both the top and the bottom of the range would be reduced. Instead, however, we find the top of the range shown in AR5 is 1.85C above the 1990 level, whereas the bottom of the range is 0.58 C above. Both the top of the range and the bottom of the range have been contracted towards the median value, and by about the same proportion. As a result, the bottom of the range shows a higher, not a lower value as required by KR's line of reasoning.
Even if we restrict the analysis to the median value range shown in Fig 9 of the Summary for Policy Makers, the range shown in FAR is approximately 0.6 to 1.5 C. If that is what is shown, the lower range is unadjusted (contrary to KR's explanation), and the upper range is increased.
If I were to hazard a guess as to what the IPCC has done, it would be that they have used historical values for forcings from 1990-2010, and the scenarios thereafter. If that is what they have done, it would contract both the high and low estimates towards each other as there will be less disparity in the forcing history. That, however, is only a guess, and you would have to consult with one of the IPCC authors to get a definitive answer.
Finally, I will note that if Doug Bell is going to complain about the "IPCC deception", it would behove him to show all three panels of the IPCC FAR predictions, not just the middle range values that he actually shows. That strikes me as rather more deceptive than anything the IPCC may have done. The excuse that he uses the values shown in the summary for policy makers (should he make it) is irrelevant in that the caption of the AR5 article explicitly refers to Fig 6.11 as the source of the projections shown.
Further, even using Fig 9 from the summary for policy makers, he exagerates the warming shown substantially. As noted, the difference between 1990 and 2035 for BaU in that chart is about 1.5 C. He, however, shows it as greater than 2 C.
-
Stranger8170 at 03:44 AM on 5 February 2015How we discovered the 97% scientific consensus on man-made global warming
Thanks Rob.
I know that the deniers using newspaper blogs will never be convinced. I know there are people who read the blogs who might not have strong opinions. We have a university bio chemist and a philosopher of science taking part in some of our discussions. I think that people who read the blog but have no strong opinion would find the AGW side on our blog much more credible just by the way they conduct their arguments. I think that might a benefit but I have to say I've no way of knowing. I'm probably wasing time.
I have have asked, even on this website why deniers wouldn't fund their own survery since it would only cost the Koch brothers of some other organization chump change to do it. I figured they were afraid of the Richard Muller effect.
I want to avoid being repetitious but I'm still bothered by the Mike Hulme thing. As a layman I just don't know what to think about his comments concerning the survey. It may be something I should let go of but I'd like to get in inkling of where he's coming from because if he’s so concerned about the huge amounts of carbon going into the atmosphere he sure doesn’t seem to be helping the cause. Just the opposite.
-
Esop at 03:12 AM on 5 February 2015Cowtan and Way 2014: Hottest or not?
In reference to JCHs question above: November also saw a drop in average temps (and the media over here (Norway) was all over it, as it meant a reduction in the chances of 2014 breaking the record). If I remember correctly, there was a major Arctic blast into North America, due to a major north Pacific cyclone pushing warm air into the Arctic and pushing cold air into NA.
It seems that we get a drop in the average global temp each time the cold Arctic air flows down into lower latitudes where we can properly measure temps, but we are unable to properly account for the heat that flows into the Arctic at the same time, causing a sizeable cool bias in the global average.
If I remember correctly, most of the much hyped ''pause'' was caused by colder winter NH temps, while summer NH temp as well as summer and winter SH temps have risen steadily, without much trace of a pause. It would not surprise me if most of the ''pause'' was caused by not yet perfect methods for measuring the results of the shuffling of NH air masses during the NH winter. C&W and HadCrut 4 was a big step in the right direction, but I have a strong feeling that there is still a rather big cool bias, as indicated by the November temps.
-
Runrig at 03:04 AM on 5 February 2015Lessons from Past Climate Predictions: IPCC FAR
Thanks again KR - If you dont mind I'll post up your response here on the Phys.org thread.
Tony
-
Rob Honeycutt at 02:59 AM on 5 February 2015How we discovered the 97% scientific consensus on man-made global warming
Stranger... What most people miss about the Cook paper is that the main point is not the actual "97%" number. It's about the difference between the public's incorrect perception of the level of consensus and the actual level of consensus.
What "skeptics" always fail to do, whilst they twist and writhe over the data, is attempt to apply their own methods for evaluating the level of consensus. Or, perhaps they have and found out that something close to 97% is actually correct... and they don't want to report that.
The importance of the research is, showing the difference between perception and reality on the part of the public relative to the level of acceptance of AGW tends to move people toward acceptance of the science.
The people at your newspaper blog ranting about the research are going to do that no matter what. That's fine. Those people will never be moved and they needn't be moved. In fact, I would hold that it's better they aren't because they become a foil against which to communicate the stark reality of AGW.
When I encounter these people I usually say one of two things:
1) Okay, you don't like the research. Do your own. Show us what you believe the level of consensus is, but you need to do what Cook et al did and go through the tough process of getting your results peer reviewed. (And FYI, that ain't easy.)
2) Since Cook et al took the self-skeptical approach of getting researchers to rate their own papers, the results are likely to be very robust. And that's not to even mention the other research papers that show similar results.
So, we now have numerous peer reviewed papers showing a very high level of scientific consensus on AGW. We have no papers showing otherwise.
"Skeptics" are batting a big fat zero right now on this topic.
-
Lessons from Past Climate Predictions: IPCC FAR
Runrig - I haven't dug into the history of _that particular figure_. However, the IPCC reports are of the current state of the art; the Myhre et al results were incorporated as far back as the 2001 SAR, and by now are likely just considered part of background literature/knowledge.
It's also noteworthy that the FAR projections were based on emission scenarios higher than actually occurred - I suspect some of the adjustment may come from using observed forcings to rescale FAR projections over intervening years.
Regardless, the fact that Bell hasn't come across the initial reference(s) to projection rescaling (based on forcing updates and historic emissions) shouldn't be interpreted as nefarious actions by the Illuminati, as he has apparently concluded. Rather, it means he isn't wholly familar with the literature.
-
miffedmax at 02:56 AM on 5 February 20152015 SkS Weekly News Roundup #5B
And as reliably a ever, the Wall Street Journal shows up the other day with another "models aren't accurate" trope on its editorial page, using the same tired old short-term time frames. It is the very definition of tragicomedy.
-
Runrig at 02:36 AM on 5 February 2015Republicans have one option to eliminate EPA carbon regulations
KR,
Yes he is indeed, as has been rammed home to him by "Maggnus", but on the other hand has been polite and accepted some criticism and apologised on occasion.
I have replied also on the appropriate thread.
Thanks
Tony Banton
-
Runrig at 02:32 AM on 5 February 2015Lessons from Past Climate Predictions: IPCC FAR
KR,
Thankyou for that.
It's what I thought - and what i told him.
He still thinks that it is "deceptive" that the IPCC in that AR5 graph has the new ECS, without reference to it's being changed.
Is that right?
There is no mention that I can see. I was hoping to pass on that statement from the IPCC to him
Tony
-
John Hartz at 01:44 AM on 5 February 2015Water is far more valuable and useful than oil
Recommended supplemental reading:
World has not woken up to water crisis caused by climate change: IPCC head by Nita Bhalla, Thomson Reuters Foundation, Feb 3, 2015
-
wili at 01:32 AM on 5 February 20152015 SkS Weekly News Roundup #6A
(Please note that I am not trying to start a political debate by the last comment. Just wondering if there is something that I'm missing. Is the strategy to get rid of coal first, but in the mean time give a green light to oil and gas? But we're still selling lots of coal even if domestic consumption is going down...Ideas?)
-
wili at 01:28 AM on 5 February 20152015 SkS Weekly News Roundup #6A
"Obama ignores Obama on climate change"
Cute title. But really, what are we to make of this president at this point? Is he being completely disingenuous? Is there any logic, any method to the madness?
Moderator Response:[JH] All U.S. Presidents, including Barak Obama operate in a political world where many factors come into play when Presidential decisions are made. As we all know, energy has become an extremely complex issue in American politics. Therefore, your questions cannot be objectively answered in this particular venue.
-
Republicans have one option to eliminate EPA carbon regulations
Runrig - I've replied on the more appropriate thread. Long story short, the rescaling was entirely justified by updated forcing information, and Doug Bell is engaging in conspiracy ideation.
-
Lessons from Past Climate Predictions: IPCC FAR
Runrig - In the 1990 FAR report the radiative forcing from a doubling of CO2 was estimated by the equation:
ΔF = 6.3 * ln(C/C0)
In 1998 a far more extensive examination of radiative models and forcing was done (Myhre 1998), and the simplified equation (curve-fit to the radiative model results) was updated to a more accurate constant:
ΔF = 5.35 * ln(C/C0)
Constants for CH4, N2O, and CFC direct forcings were also updated in that paper. And later IPCC documents rescaled the FAR model results accordingly - entirely appropriately.
-
Mighty Drunken at 23:59 PM on 4 February 2015Republicans have one option to eliminate EPA carbon regulations
Hi Runrig,
It is best to keep comments on topic, here SkS has a relevant article, FAR Prediction. Assuming Doug has not messed up his baselines the answer is probably found in the linked article, the actual forcing being less than the BAU projection and we are tracking on one of the lower climate sentivity projections. His analysis seems a bit subjective, for instance he claimes, "At the 2035 mark the lowest prediction is around 1.7°C". My eyeballing puts it closer to 1.6C.
-
Falk at 23:52 PM on 4 February 2015Katharine Hayhoe's climate elevator pitch
I don't think this is a good approach. Leave out the science and pull them over emotionally? If you want to talk on a personal relevant ground confront them with with actual data on the water problems in Texas. What is the problem and where can they see the consequences? Using some vague description to scare them is not helping in my opinion.
-
Stranger8170 at 23:17 PM on 4 February 2015How we discovered the 97% scientific consensus on man-made global warming
Thanks Tom. The 97% controversy has been raging at our newspaper blog since the moment it was published. The Soon and Idso claims about your Cook et al was just the latest "skeptic" point that was to show how unriliable the study is. I would think the 1200 authous representing 2000 papers should be a large enough number as you point out.
I read a blog exchange between Dana and professor Mike Hulme. It's left me a bit confused or should I say very confused. I'm not sure what Hulme's point is or where he's comming from. His statement "..97% consensus” article is poorly conceived, poorly designed and poorly executed. It obscures the complexities of the climate issue...". has been embraced by the deniers to claim Hulme is shooting down the paper. It seems that he's down on the process not that there isn't concensus but unfortunately all he's accompolished to do is confuse. Is he doing this to obfuscate? The fact that he thinks were "beyound it" concerning concensus seems counter productive at this time.
-
Runrig at 20:31 PM on 4 February 2015Republicans have one option to eliminate EPA carbon regulations
Addendum to the above...
Mr Bell outlines his arguments here...
http://dougbell.wikidot.com/wiki:ipcc-deception
-
Runrig at 20:24 PM on 4 February 2015Republicans have one option to eliminate EPA carbon regulations
Hi,
Off topic somewhat here - but is very much related to climate science denial.
I am a retired UKMO Meteorologist and I post regularly on Phys.org trying to rebut the AGW deniers that frequent the site.
There is an ongoing thread ...
phys.org/news/2015-01-climate-dont-over-predict.html
Which primarily concerns the concerns of one Doug Bell in respect of differences between the original FAR graph ECS assessment and that transfered to the AR5 graph of all AR's overlain. I have pointed out a quote from SkS in this post.....
"From:http://www.skepti...ming.htm
"The IPCC FAR ran simulations using models with climate sensitivities (the total amount of global surface warming in response to a doubling of atmospheric CO2, including amplifying and dampening feedbacks) of 1.5°C (low), 2.5°C (best), and 4.5°C (high) for doubled CO2 (Figure 1). However, because climate scientists at the time believed a doubling of atmospheric CO2 would cause a larger global heat imbalance than is currently believed, the actual climate sensitivities were approximatly 18% lower (for example, the 'Best' model sensitivity was actually closer to 2.1°C for doubled CO2)."
I read it, that AFTER FAR the ECS was taken as 18% lower than the figure used then.
The AR5 graph has the ECS ranges "rebased" to that figure.
In the original FAR document, which you get your sensitivity figures from they are as was thought originally.The "missing" 0.4C ?"
Is anyone able to shead light on the matter?
Thanks
Tony Banton
-
chriskoz at 17:30 PM on 4 February 2015Katharine Hayhoe's climate elevator pitch
What Katharine sais here is the indicative of a long-standing opinion by many attribution climate scientists that AGW is not an environmental problem but rather a social/ethical problem. I.e. the intergenerational ethics, uneven geographical distribution of causes (emissions) and effects (adverse weather), arguments about allowances, are all social/ethical root problems that have no solution whatsoever. The environmental problem of changing climate is just the effect that cannot be fixed until the roots are not fixed.
-
jyyh at 14:50 PM on 4 February 2015Republicans have one option to eliminate EPA carbon regulations
I've used the equation Republicans = Tea Party for quite a while. I've not seen anything to disprove the fact.
-
jyyh at 14:45 PM on 4 February 2015The Most Terrifying Papers I Read Last Year
yep, that's the one. It's been projected that the Arctic warms way faster than the rest of the globe. Greenland partially melts which raises the sea level which twists the West Antarctic Ice Sheet which cracks the buffer keeping the Antarctic glaciers from melting. Thus they melt and thus the sea level rises to the level where many current ports become inoperable thus the commerce stops thus follows the economic meltdown thus the world ends.
I really should stop writing in hangover.
-
jyyh at 14:39 PM on 4 February 2015Water is far more valuable and useful than oil
no worries, we can melt the glaciers and ice sheets to get more water... maybe I should disband myself of writing in hangover.
-
jyyh at 14:36 PM on 4 February 2015New research reveals extreme oxygen loss in oceans during past climate change
Wow, an important piece of research. Kind of cool we can get these records from the layers in the bottom of the ocean. I would have imagined there wouldn't be such an oxygen loss. Sure teh animals on land can move faster than plants so some oxygen loss (thus increase in CO2) would have happened when external drivers (sun and eccentricity whatnot) warm up the continents but also in the ocean? Nice to know but the reasons are not too clear here, small scale methane bursts on continental shelves using up the oxygen? This would of course not be seen on the ice core record since the methane wouldn't make it to the atmosphere.
-
jyyh at 14:24 PM on 4 February 2015Kevin Cowtan Debunks Christopher Booker's Temperature Conspiracy Theory
Telegraph. Not the first time they are in error. Might call them opinionated and incapable of learning of their errors. Some call this 'news'paper 'the torygraph', which quite well fits in my view these sorts of extreme rightwing 'newspapers' are nothing more than public, but encoded, message boards for their readership consisting of torys, the meaning of which derives from the Middle Irish word tóraidhe; modern Irish tóraí: outlaw, robber or brigand.
-
jyyh at 14:01 PM on 4 February 2015Cowtan and Way 2014: Hottest or not?
cool, I think most people connect the word 'hot' with something that burns their skin in the childhood or some similar incident. Psychologically, it's then a question of discomfort. Discomfort in a hot car is one very commonly met occasion in the developed world, thus saying 'hottest year' connects to these uneasy feelings. Technically, we could say this was the 1st to 2nd least cold year, as the GW expresses itself better by raising the minimums first, but that would lead to a false sense of security since 'hot' is an expression associated with discomfort. 'Too hot' in turn associates with damage and is more a class of it's own. Thus speaking of 'too hot' or years should be reserved to discussions about agriculture, or health. Interesting. The year 2014 wasn't too hot but it was one of the least cold years, at least in here. Thanks Kevin C for keeping this record up to date.
-
Tom Curtis at 13:23 PM on 4 February 2015How we discovered the 97% scientific consensus on man-made global warming
Stranger @20, searching The Consensus Project database, I find just two papers with Willi Soon as a coauthor. The first, on polar bears, was rated neutral because it does not include any discussion in the abstract germain to the attribution of recent global warming. The abstract of the second reads as follows:
"The authors investigate how the global monsoon (GM) precipitation responds to the external and anthropogenic forcing in the last millennium by analyzing a pair of control and forced millennium simulations with the ECHAM and the global Hamburg Ocean Primitive Equation (ECHO-G) coupled ocean–atmosphere model. The forced run, which includes the solar, volcanic, and greenhouse gas forcing, captures the major modes of precipitation climatology comparably well when contrasted with those captured by the NCEP reanalysis. The strength of the modeled GM precipitation in the forced run exhibits a significant quasi-bicentennial oscillation. Over the past 1000 yr, the simulated GM precipitation was weak during the Little Ice Age (1450–1850) with the three weakest periods occurring around 1460, 1685, and 1800, which fell in, respectively, the Spörer Minimum, Maunder Minimum, and Dalton Minimum periods of solar activity. Conversely, strong GM was simulated during the model Medieval Warm Period (ca. 1030–1240). Before the industrial period, the natural variations in the total amount of effective solar radiative forcing reinforce the thermal contrasts both between the ocean and continent and between the Northern and Southern Hemispheres resulting in the millennium-scale variation and the quasi-bicentennial oscillation in the GM index. The prominent upward trend in the GM precipitation occurring in the last century and the notable strengthening of the global monsoon in the last 30 yr (1961–90) appear unprecedented and are due possibly in part to the increase of atmospheric carbon dioxide concentration, though the authors’ simulations of the effects from recent warming may be overestimated without considering the negative feedbacks from aerosols. The simulated change of GM in the last 30 yr has a spatial pattern that differs from that during the Medieval Warm Period, suggesting that global warming that arises from the increases of greenhouse gases and the input solar forcing may have different effects on the characteristics of GM precipitation. It is further noted that GM strength has good relational coherence with the temperature difference between the Northern and Southern Hemispheres, and that on centennial time scales the GM strength responds more directly"
The first thing you will notice is that it says nothing to dismiss the attribution of at least 50% of recent global warming to anthropogenic factors. On the contrary, it several times mentions CO2 forcing (an anthropogenic factor) as a relevant forcing, and as a cause of recent warming. Specifically, it is stated:
"The simulated change of GM in the last 30 yr has a spatial pattern that differs from that during the Medieval Warm Period, suggesting that global warming that arises from the increases of greenhouse gases and the input solar forcing may have different effects on the characteristics of GM precipitation"
Given reasonable background information about the relative strengths of anthropogenic and solar forcing, that represents an implicit endorsement that >50% of recent warming was anthropogenic. However, we don't need to dig that far in. The paper uses climate models which are known, given historical forcings, to show humans as responsible >50% of recent warming. Absent an explicit disclaimer indicating that the authors are not using standard historical forcings, that again respresents an implicit endorsement. The paper was in fact rated as Explicitly endorsing but not quantifying, ie, a 2, and that is arguably a mistake. (I would rate it as 3, implicitly endorsing.) It is, however, a mistake that makes zero difference to the headline result of Cook et al.
Now it is possible that Soon and his coauthors did clearly indicate the use of radically a-historical forcings in the depths of the paper. The raters did not get to see the depths of the paper, however. They rated on the abstract and therefore a rating justified by the abstract, though contradicted within the paper merely shows that abstracts often poorly communicate the contents of papers, not that the raters made a mistake. Further, raters clearly rated abstracts, not authors. If Willi Soon is really saying that he (rather than an abstract of one of his papers) was rated as endorsing the consensus, then he either completely misunderstands the study he is criticizing (nothing new there) or completely misrepresents it.
Turning to Craig Idso, he also has to papers rated, one of which was rated as neutral. The second, which was rated as implicitly endorsing the consensus, had the following abstract:
"Since the early 1960s, the declining phase of the atmosphere’s seasonal CO2 cycle has advanced by approximately 7 days in northern temperate latitudes, possibly as a result of increasing temperatures that may be advancing the time of occurrence of what may be called ‘climatological spring.’ However, just as several different phenomena are thought to have been responsible for the concomitant increase in the amplitude of the atmosphere’s seasonal CO2 oscillation, so too may other factors have played a role in bringing about the increasingly earlier spring drawdown of CO2 that has resulted in the advancement of the declining phase of the air’s CO2 cycle. One of these factors may be the ongoing rise in the CO2 content of the air itself; for the aerial fertilization effect of this phenomenon may be significantly enhancing the growth of each new season’s initial flush of vegetation, which would tend to stimulate the early drawdown of atmospheric CO2 and thereby advance the time of occurrence of what could be called ‘biological spring.’ Working with sour orange (Citrus aurantium L.) trees that have been growing out-of-doors in open-top chambers for over 10 years in air of either 400 or 700 ppm CO2, this hypothesis was investigated by periodically measuring the lengths, dry weights and leaf chlorophyll concentrations of new branches that emerged from the trees at the start of the 1998 growing season. The data demonstrate that the hypothesis is viable, and that it might possibly account for 2 of the 7 days by which the spring drawdown of the air’s CO2 concentration has advanced over the past few decades."
Cutting to the chase, the authors are suggesting an alternative explanation to the fact that spring is coming earlier than it did in the past. The standard explanation is that it is warmer earlier. Craig Idso's alternative explanation in terms of the CO2 fertilization effect is found to be a viable hypothesis, that "... might possibly account for 2 of the 7 days by which the spring drawdown of the air’s CO2 concentration has advanced over the past few decades." The might, possibly indicates not only uncertainty, but the upper range of the potential effect. That is, it might account for 28.6% of the botanical effect of an early spring (and zero of the effect on animals). That leaves around 70% still attributable to the traditional explanation, ie, the increased warmth.
To my mind, that is not enough to rate the paper as implicitly endorsing the consensus; though only because the consensus is implicitly defined as relating to attribution on which the abstract says nothing. Therefore this is a case of an abstract that was rated (3), but should have been rated, IMO, (4).
Note again that the ratings are not rating authors, and not rating papers. However, Cook et al did include a rating of papers by the authors. Comparison between it and the abstract ratings showed that by far the most common "error" was rating papers that endorsed the consensus as not endorsing the consensus. Again, if Craig Idso understood Cook et al, he would know that to be the case. He would know that pointing out one or two potential errors without pointing to the overall error statistics as shown be comparison of the abstract and author self ratings is a blatant cherry pick. Indeed, that is probably why he claims the error, but does not draw attention to the results of the author self ratings.
-
How we discovered the 97% scientific consensus on man-made global warming
Stranger: If you look at the rated abstracts, and search on "Soon" and "Idso", you will see that of the sampled abstracts Soon's (2 abstracts) were rated 3 (implicit endorsement) and 4 (neutral) respectively, while Craig Idso's abstracts (I found 2) also were rated 3 and 4.
This was a sampling protocol - not an exhaustive search of every paper published - but of the particular Soon and Idso fish/papers in the net the rankings were neutral or higher in endorsement of AGW.
Prev 619 620 621 622 623 624 625 626 627 628 629 630 631 632 633 634 Next


