


 Arguments


Recent Comments
Prev 623 624 625 626 627 628 629 630 631 632 633 634 635 636 637 638 Next
Comments 31501 to 31550:
-
jja at 10:14 AM on 25 January 2015The oceans are warming so fast, they keep breaking scientists' charts
This graphic shows a collection of Top of Atmosphere energy assessments derived from Hansen & Sato (2010), Nuccitelli et. al (2012), Allen et. al. (2014), Durack et. al (2014) and a simple average analysis of 2010-2014 OHC from the NODC.
http://postimg.org/image/iv4cty0df/ -
denisaf at 08:30 AM on 25 January 2015The Most Terrifying Papers I Read Last Year
This work adds to the understanding that authorities have on the unintended consequences of technological systems using fossil fuels. It helps them to make responsible decisions about implemetation of adaption measures to cope with expectations. For example, authorities in New York, London and the Netherlands are planning to use appreciable resources to provide a degree of protection from sea level rise and storm surges.
-
jja at 07:27 AM on 25 January 2015The oceans are warming so fast, they keep breaking scientists' charts
even more to the point: the 1 watt per meter squared Top of Atmosphere energy imbalance is a permanent feature that will not go away until the earth reaches a new, warmer, equilibrium.
In addition, the cumulative work of Nuccitelli, Hansen & Sato, Levitus, and Duack all point to the fact that this energy imbalance is DOUBLING double at a period of every 6-9 years.
Finally, the fact that significant reductions in south-east asian aerosol emissions and arctic albedo conditions are looming, we will likely experience a rate of heat accumulation in the near future (5-7 years) that is nearly TRIPLE triple what we are currently experiencing.
Welcome to the new era.Moderator Response:[JH] The use of "all caps" is prohibited by the SkS Comments Policy.
-
Stephen Baines at 07:08 AM on 25 January 2015Five bits of research that shaped climate science in 2014
"I take it you were angry that I was trying to falsify something ?"
No, they are annoyed because you are falsifying straw men and distorting the OP's message.
First, in the absence of increasing CO2 the air temperatures would go through decades of warming and cooling naturally, because of factors like those explained in the OP. The warming caused by increasing CO2 is simply superimposed on that variation. So the fact that rates of atmospheric warming vary over decadal scales does not run counter to projections of the effects of CO2 on climate. In fact, heat has been building up as espected based on CO2, given what we know of the forcings.
Second, Antarctic sea ice is increasing in extent despite the fact that air and sea temperatures are also increasing and land ice on antarctica is shrinking. Clearly other factors affect Southern Ocean sea ice extent in the austral winter, and the OP suggests there may be measurement artifacts as well (you failed to mention this despite it being the main point of that section of the OP!).
Third, the OP says nothing about warming in the Arctic being "offset" by mid latitude cooling. That is your invention, disproven by the global temperature trends shown above. The OP simply states that colder winters in some temperate areas are being linked to declining sea ice and warmer temperatures in the Arctic because of the effects on position and motion of the Jetstream.
-
jimlj at 07:00 AM on 25 January 2015The oceans are warming so fast, they keep breaking scientists' charts
sgbotsford: to add to wehappyfew's content, this is the warming we can expect without feedback if all GHG emissions stopped today. I hope we can agree, that's not going to happen.
-
wehappyfew at 05:28 AM on 25 January 2015The oceans are warming so fast, they keep breaking scientists' charts
sgbotsford @ 28
For a 1st order calculation, I would say you have it mostly right. You forgot to include the albedo of the Earth, which reduces the SW radiation absorbed.
Re-doing your calculations, I get
dT = 0.43degK
The much bigger problem is: you seem to think the climate is easily modeled by a first order physics equation.
Do you think it is possible that the albedo might change after a 0.4K average temperature change? Global snow cover has already declined quite a lot, especially in late spring and early summer when the albedo effect is largest.
Ice sheets and sea ice might melt a bit more at higher temps, don't you think?
Higher air and sea surface temps mean more water vapor... more greenhouse effect.
Maybe these kind of effects are why we don't treat the climate as a 1st order physics problem.
Another way to look at it... you have essentially calculated the warming due to current net forcings without any feedbacks at all. I think your number is pretty close to the accepted no-feedback value, so we are all in violent agreement about the basic physics of the greenhouse effect. Once you include the feedbacks, you should be much closer to the actual expected warming.
-
dagold at 05:19 AM on 25 January 2015The Most Terrifying Papers I Read Last Year
sgbotsford - god points you make. I wrote a Huffington Post/Common Dreams article about our human propensity not to be responsive to danger until it has reached a certain point of immediacy and suffering. In my personal experience through multiple serious illnesses, I did not begin to respond BEFORE tipping points were triggered until I'd learned through hard and repeated experience. Given the relatively "slowly" developing effects of climate change...it puts us in a very tough spot. Here is the article, if you are interested: www.commondreams.org/views/2014/02/28/through-climate-portal-humanitys-tragic-flaw
-
Tom Curtis at 04:14 AM on 25 January 2015Five bits of research that shaped climate science in 2014
I'm pretty sure I don't protest too much. I am, however, tired of a constant stream of ingoramuses repeating denier myth after denier myth with no apparent connection between their synapses.
-
Tom Curtis at 04:00 AM on 25 January 2015Just when did humans first start affecting the climate?
william @8, 250 ppmv would correspond to temperatures similar to those in the LIA, and would definitely be disadvantageous compared to current levels. Nor is it automatically true, or even particularly probable that the pre-industrial level of 280 ppmv corresponds to the ideal average temperature conditions across the globe. To the extent that there is such an ideal condition, it probably lies somewhere between 280 and 360 ppmv (given current solar activity and relative position in the milankovich cycle). More important than the exact level, however, is the rate of change which should be kept low.
-
Posthocpropterhoc at 03:27 AM on 25 January 2015Five bits of research that shaped climate science in 2014
I wasn't making a case for anything , I was just repeating what the first line of case #1 said : " surface temperatures have risen more slowly over the last 15 years or so than in previous decades , even though we're emitting greenhouse gasses faster than ever before ." Are you saying that that is not true. ? I'm just going by what the article says . I take it you were angry that I was trying to falsify something ? It was hard to tell as your syntax was a bit hard to wade through . theres's no doubt we are in a warming period . It's just hard to sort through all the hyperbole on both sides , separate instrument data from proxy data , apples from oranges , conflicting ideologies And arrive at objective views . Your comments about chutzpah and " falsified " anything are quite over the top , IMHO . As one wise fellow noted , methinks he doth protest too much .
Moderator Response:[JH] You are skating on the thin ice of concern trolling. Future posts of this nature will be summarily deleted.
Please note that posting comments here at SkS is a privilege, not a right. This privilege can be rescinded if the posting individual treats adherence to the Comments Policy as optional, rather than the mandatory condition of participating in this online forum.
Please take the time to review the policy and ensure future comments are in full compliance with it. Thanks for your understanding and compliance in this matter.
-
sgbotsford at 02:48 AM on 25 January 2015The oceans are warming so fast, they keep breaking scientists' charts
In reading this article and the one about measuring ocean temps, a number that has come up a couple times is the approximate value of 1 watt per square meter. That in effect 1 watt less per square meter was radiated back to space than was being received.
This is another dangerous stat to use. First order analysis:
"Sunlight shines with 1000 w/m2. How big is 1 watt? Things will only have to warm a bit to make it balance."
Answer: The 1 watt is everywhere. Sunlight is on only half the planet, and for a good part of that it's slantwise. Consider a circle the size of the earth. It has 1/4 the area of the earth. That is the diameter of the chunk of sunlight being intercepted. So it's *really* 250 w/m2 if we are going to compare apples to apples. So it's not .1% it's .4% increase.
#2 Ok. But radiation increases with the 4th power of temperature.
So (T + dT)4/T4 =1.004
(T +dT)/T = 1.001 (pretty close)
dT = .001T
But the planet averages about 300K
So dT = .3 degrees.
Have I goofed up? It's hard to get worked up about this.
Moderator Response:[Rob P] - Yes, it is hard to get worked up by a simple calculation that bears little resemblance to the world on which we live. Climate scientists understand that there are feedbacks in the climate system, and that the real world is much more complex - hence the design of climate models.
But changes in temperature, or ocean acidity, don't really tell us a great deal by themselves. How will this change in temperature (or acidity) affect precipitation patterns? The growing of agricultural crops? Glacier-fed rivers such as the Ganges, Brahmaputra and Mekong rivers? The ability of marine calcifiers to build their shells? The persistence of coral reefs with the strong warming of the surface ocean?
When one delves into scientific research in these areas, the prognosis is not good. Whether that's something to get worked up about is a judgement call. IMO it's ample motivation to rapidly decarbonize the global economy.
-
sgbotsford at 02:28 AM on 25 January 2015The Most Terrifying Papers I Read Last Year
Sorry. I'm not terrified. Concerned, yes. But the use of 'terrified' is hyperbolic.
Terror requires more immediacy. In South Africa if your neighbor is executed with a burning tire, you can be terrified. In WWII when you woke up to find that the Ghurkas had come in and slit the throat of the soldier sleeping one bunk over, you can be terrified. When the tail of the plane you are in falls off you can be terrified. I don't think that anyone is terrified by an event that is decades from affecting their life in a significant way. The rationists will be concerned. But they are, what, 10% of the population as a whole.
In this battle for people's minds, as rationalists we have to use language rationally. If we speak in continuous hyperboly we get caught in the Suzuki syndrome. (David Suzuki has made enough exaggerated forecasts of doom that didn't come to pass that I no longer give him any credance whatever.)
***
A second part of this battle for mindshare is the general lack of immediacy. Most people won't make a money saving home improvement unless it will pay for itself in 3-5 years. (The flurry of PV installs appears to contradict this, but the percentage of houses with PV is still small, and correlates well to areas where they pay off quickly; are in regions that have suffered rolling outages; and have a high percentage of high tech jobs)
To get mindshare, you need immediacy. Remember that meme for task management about categorizing things as unimportnant versus important, and also as non-urgent vs urgent. People tend to do those things that are urgent requiring reactive immediate action, over things that are important but whether you do something this week or next week isn't as critical.
(It's hard to remember when you are up to your ass in alligators that your objective is to drain the swamp.)
To be succesful you need to increase the urgency generally in people's minds.
Locally (Alberta) the biggest event has been the Moutain Pine Beetle outbreak. (While the rest of the province lives on oil revenue...)
If you live in a coastal city, draw a map of the new coast line with a 20 cm sea rise. Get city planners to start thinking about this.
It doesn't help that apart from the generalities the boffins with the computers aren't very good at at making specific predictions. Will my climate in central Alberta get warmer? Highly probable. Wetter? Maybe. But the extra warmth will make the climate in effect drier. That's the current best guess, but the associated numbers are rife with uncertainty. It's hard enough to gamble with known probabilities.
(In passing, as a tree farmer, I make a point of planting trees that are 'out of zone'. Trees that would normally not grow here but rather in a warmer, drier climate. )
With rising temperatures we should get larger patches of ocean that are above the critical temperature to power the heat engine that is a hurricane. We should be getting more frequent tornadoes in a longer season. I haven't checked recently, neither are forms of weather that have any immediacy.
Moderator Response:[Rob P] - The inability to recognize future threats, as opposed to immediate ones, is arguably the largest contributor to inaction on climate policy. But misinformation propagated by the mainstream media probably doesn't help either.
Societal change, when it does happen, can happen awfully fast though. Witness gay marriage for instance. After years of banging their heads against a brick wall, gay rights activists saw rapid change occur around the world. We'll need something of even larger scale to prevent the worst consequences of global warming and ocean acidification from taking place.
-
PhilippeChantreau at 00:53 AM on 25 January 2015The Most Terrifying Papers I Read Last Year
GRL paper here:
http://onlinelibrary.wiley.com/doi/10.1002/2014GL062255/abstract
Moderator Response:[JH] Link activated.
-
PhilippeChantreau at 00:52 AM on 25 January 2015The Most Terrifying Papers I Read Last Year
Perhaps this should be added to the list of scary papers:
Arctic ice shelves aren't faring any better. The loss observed is nothing short of staggering.
Moderator Response:[JH] Link activated.
[RH] Link shortened.
-
billthefrog at 22:20 PM on 24 January 2015The oceans are warming so fast, they keep breaking scientists' charts
sgbotsford @ 23
In his moderator comment, Rob Painting pointed out that excess heat has not even come close to being evenly distributed across the vastness of the ocean. (I seem to recall reading somewhere that the estimated timescale for full scale abyssal mixing was >1,000 years.)
However, leaving aside Rob's very valid point...
In your comment, you state that the mass of the top 2,000 metres of ocean is ~ 7.2 x 10²⁰ kg and that its specific heat is 4,187 Jkg-1K-1
Now consider the lily, sorry, consider the atmosphere:
Given the planetary surface area is about 511 million sq kms, standard pressure at sea level is 1013.25 hectoPascals and that gravitational acceleration at sea level is 9.81 metres/sec2, it's pretty straightforward to show that the mass of the entire atmosphere is about 5.27 x 10¹⁸ kg.
The specific heat for air (across a fair range of temperatures centred around 280 Kelvin) is somewhere about 1,010 Jkg-1K-1. Combining these numbers (and forgetting about the Clausius Clapeyron relationship) would give a figure of roughly 5.32 x 10²¹ joules to bring about a 1 degree change.
As you quote a figure of 3.015 x 1024 joules to effect the same change in the top 2,000 metres of the ocean, then, still omitting Clausius Clapeyron, we are talking about a thermal capacity difference of 567 times! Are you seriously trying to compare these two things?
One is reminded of the glee of a Young Earth Creationist upon hearing that an intermediate fossil form had recently been unearthed. The rationale? There now existed two gaps in the fossil record where there had only been one before.
Cheers Bill F
-
MA Rodger at 20:48 PM on 24 January 2015Just when did humans first start affecting the climate?
Posthocpropterhoc @7.
The origin of the proxy data is referenced in the caption of the figure your ask about. It is even titled "Marcott 2013" although it should properly be Marcott et al. (2013) as Marcott had three co-authors. The full paper is available here.
Concerning the graphical representation itself, the period you describe as "...it represents a what ? 25 year period on a graph representing 10,000 years" scales at either 100 years long (to the lowest point on of the HadCRUT4 data) or 270 years (to the lowest point on the Marcott proxy data). You are way off with 25 years.
I'm always myself amused by pseudonyms deriving from Latin. Without the "ergo", doesn't the meaning of "Post hoc, propter hoc" translate to something like 'learn from past events'?
-
MA Rodger at 20:33 PM on 24 January 2015Just when did humans first start affecting the climate?
Although not entirely convinced, I always have a lot of time for Ruddiman's theory as buring down a forest is quite a simple task, something that is occasionally demonstrated today by misguided children equiped with a box of matches. Also the effect of a small human population in diminishing populations of large herbivore could have very large follow-on effects in vegetation levels. So the ability of quite small populations to have a significant impact did exist.
One point I feel the post is a little too vague on is the differences between slash-&-burn and sedentary agriculture. The first difference is that the former is not concerned about trashing its environment, burning down a forest for a couple of crops of cereals. The latter would never do that. The second difference is that it was the rise of sedentary agriculture as we understand it today that allowed the dramatic rise in population. The post says:-
"Domestication of crops began in the Middle East around 12,000 years ago and by 8,000 years ago people there had become dependent on agriculture for most of their food."
There is a time of transition when populations decided that sticking around to looking after a field of food crop was better than scattering a few seeds over a hillside and leaving them to grow while you packed up to go hunting wild goats or whatever. This transition is seemingly associated with irrigation which soon allowed a massive rise in population. It was the massive population that made "people ... dependent on agriculture for their food" and with time, the spread of that sedentary agriculture to rain-watered lands added yet more to population who slowly de-forested the land the hard way.
-
william5331 at 20:12 PM on 24 January 2015Just when did humans first start affecting the climate?
So it seems that we have to reduce atmospheric Carbon dioxide, say to around 250ppm but not let it fall much below that. A new ice age would be as destructive as what we seem to be heading toward now.
-
william5331 at 19:55 PM on 24 January 2015The Most Terrifying Papers I Read Last Year
There may be another factor at play here. As the underside of the sloping ice sheet melts, it mixes with the adjacent sea water. This less salty water will rise up the underside of the upsloping ice and debouch on the surface of the sea, and be kept there by its lesser density. This will suck sea water in to replace it with the sea water carrying its burden of calories. The deeper the grounding line, the greater this effect should be just as an air lift is more effective, the deeper its mouth. It should be possible to get a handle on the metrick of this process by putting in place current measuring and salinity measuring instruments on the underside of the ice shelves.
-
Tom Curtis at 13:11 PM on 24 January 2015Five bits of research that shaped climate science in 2014
Posthocergopropterhoc @2, courtesy of Tamino, here is the global temperature trend up to 1999:

And here is that trend, with the additional years since added in:
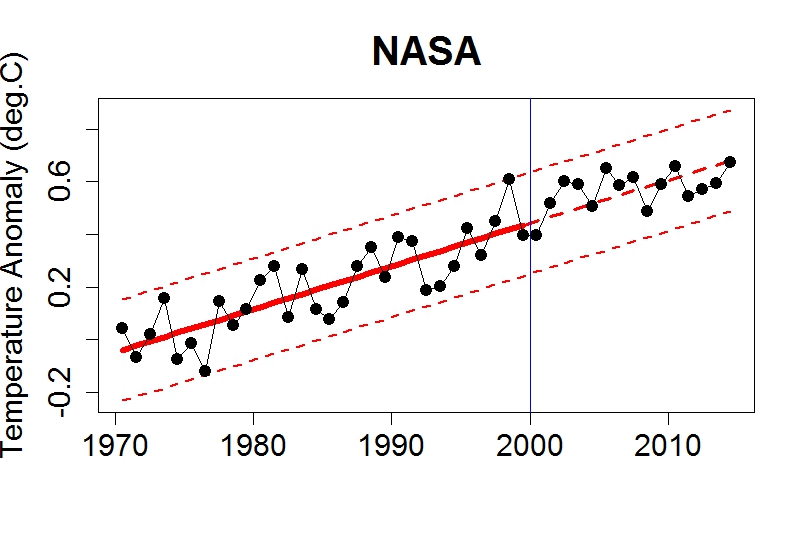
You will notice that 2014 lies almost exactly on the trend line. It takes chutzpah to argue that, because the most recent annual temperature, for an ENSO neutral year, lies on the continuation of the trend, therefore the trend has been refuted. Even more chutzpah to argue the trend is falsified when every selection of period long enough to statistically distinguish between the model predicted trend and zero lies very close to the model predicted trend, and excludes zero.
-
Posthocpropterhoc at 11:07 AM on 24 January 2015Five bits of research that shaped climate science in 2014
Correct me if I'm wrong , but this article confirms that warming has slowed over the last 15 years counter to rising co2 , and climate predictions . Antarctic sea ice has increased significantly . Polar warming is offset by mid latitude cooling . And I don't want to sound clueless but during the unusually warm period in Europe and the eastern arctic between the 20's and 40's wasn't there a whole lot of previously ice covered land exposed ? From what I've read from contemporary accounts it sounded much more extreme than now . Just asking . I try to find out as much as I can , keep an open mind .
Moderator Response:[Rob P] - You're wrong. The rate of global surface warming in the last 16 years has slowed when compared to the previous 16 years, but the slower warming rate is nevertheless similar to the long term trend:

This plot is for only one of the surface temperature data sets (NASA GISS), but all surface temperature data and the lower troposphere temperature data of UAH all demonstrate ongoing warming. More importantly, the oceans continue to absorb heat. So we know that more surface warming is in the pipeline.
-
Posthocpropterhoc at 10:36 AM on 24 January 2015Just when did humans first start affecting the climate?
Given the sweeping conclusions he comes to based on his 10,000 years of global mean temperature anomalies which apparently only range over barely 1/2 degree it would be nice to know where / how the proxy data came from . And that final dramatic up spike is a bit hard to swallow as it represents a what ? 25 year period on a graph representing 10,000 years . Most of this doesn't pass the smell test IMHO , but it is highly entertaining .
Moderator Response:[Rob P] - Personal incredulity is a logical fallacy. No more please. If you have anything interesting to say from a scientific point of view then do so.
-
wili at 09:56 AM on 24 January 20152015 SkS Weekly News Roundup #4A
Missing "h" in 'It's profitable to let the world go to ell'
Moderator Response:[JH] Typo fixed. Thank you for bringing this to our attention.
-
rader5 at 09:46 AM on 24 January 2015The oceans are warming so fast, they keep breaking scientists' charts
@sgbotsford you're not the only one. Judith Curry says the same thing:
http://judithcurry.com/2013/09/26/the-relentless-increase-of-ocean-heat/
http://motls.blogspot.com/2013/09/ocean-heat-content-relentless-but.html#disqus_thread
I'm actually astounded that either of them thinks this is so suprising since this is known and as been said by the ARGO folk:
http://www.argo.ucsd.edu/global_change_analysis.html
But more to the point, it's like neither of them have ever heard of thermal expansion:
http://en.wikipedia.org/wiki/Current_sea_level_rise#IPCC_Third_Assessment -
jja at 07:24 AM on 24 January 2015The oceans are warming so fast, they keep breaking scientists' charts
sgbotsford @23
It is a commom misinterpretation that the NODC buoy data represents an average temperature increase, it doesn't.
In fact, it is the absolutely BEST metric to communicate the total incidence of global warming that is happening now. People can easily and clearly understand the ocean being warmed by the atmosphere and the results are extreme enough to induce a real wakeup. -
jja at 07:17 AM on 24 January 2015The oceans are warming so fast, they keep breaking scientists' charts
Tom @22
Such calculations are an effective way to convey to the general public the actual scale of current global warming. Your argument against such discourse is hollow and would equally apply to the "hiroshima atomic bomb" icon in the upper right-hand corner of this page.
When the general public / common misinformed denier is made aware of the scale of warming that has been measured, directly and accurately, in the world's oceans, a light turns on in their darkened minds.
This explaination is much more accurate than the hiroshima bomb analogy, regardless if it is "thermodynamically possible or not" (in fact, that is the most common retort from the denialist community!).
The point isn't that it is thermodynamically going to happen, the point is that GLOBAL warming is happening, even if the atmospheric response is delayed. -
sgbotsford at 07:13 AM on 24 January 2015The oceans are warming so fast, they keep breaking scientists' charts
Not to denigrate the article, but this is pretty subtle science.
Check me:
Area of ocean 360,000,000 km2
Volume of top 2000 meters 7.2E+17 m3
Mass of top 2000 meters 7.2E+20 kg
Heat capacity of water 4187 J/kgK
1 degree delta T 3.01464E+24 Joules
Temp change of 10^22 J 0.003317145663 K(WHY can't these editors do tables!)
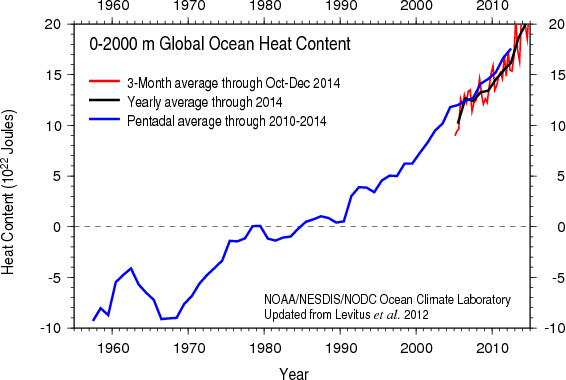
If I've not screwed up somewhere, we're talking about 3 thousands of a degree per 10^22 J. So if we are at a measured increase of 25 * 10^22 joules we are talking about .075 degree. One begins to see why it's not expressed in the form of a temperature anomaly.
After reading the article about how deep ocean temperatures are measured, I'm not confident in the reality of this graph, and I'm used to dealing with science.
This article is NOT a good talking point with climate change deniers. There are too many layers of obfuscation on the derivation.
Moderator Response:[Rob P] - No point in checking your calculations when your entire premise is flawed, and yes this particular contrarian myth has been circulating the internet ever since the strong warming of the ocean became impossible to handwave away.
Although the 0-2000 metre layer of the ocean has warmed, not all of it has. By dividing the measured OHC by the entire volume of the 0-2000 metre ocean layer, you're inferring something that never happened. It's a misrepresentation. Most of the warming of the subsurface layers are in areas of anomalous ocean ventilation - right where we'd expect them to be.
Much of the heat, however, remains in the upper layers of the ocean, especially the 0-100 metre layer. This is relevant to climate and ecology because that heat is exchanged with the atmosphere, more so during El Nino. Look at temperature anomalies in the upper 100 metres of the ocean during 2014 for instance.

-
Tom Curtis at 06:41 AM on 24 January 2015The oceans are warming so fast, they keep breaking scientists' charts
jja @18, while such calculations are interesting, they are misleading unless strictly limitted to indicating the relative proportions of energy being stored in ocean and atmosphere. That is because, firstly, the situation described is thermodynamically impossible, and so of no relevance; and, secondly, because such calculations give no basis for estimating the final equilibrium temperature response, and hence cannot indicate whethere global warming will be catastrophic or benign, or something inbetween.
-
Tom Curtis at 06:35 AM on 24 January 2015The oceans are warming so fast, they keep breaking scientists' charts
OPOF @16, point by point:
- Of the (currently) 8.9 +/- 1.3 Gigatonnes of carbon placed in the atmosphere by human activity each year, 4 Gigatonnes remains in the atmosphere, 2.6 +/- 1.2 Gigatonnes is absorbed by vegetation and soil as a result of CO2 fertilization, and 2.3 +/- 0.7 Gigatonnes is absorbed by the ocean. Uncertainties represent 90% confidence intervals. Taking the central estimates, that means 45% of emitted CO2 remains in the atmosphere, 29% is absorbed by plants and soil biota, and 26% is absorbed by the ocean. It is important to recognize the majore uptake by plants and soil. All figures are from the IPCC AR5 as shown in figure 6.1. (As a side note, the emissions figures include 1.1 Gigatonnes from land use change including deforestation, indicating that plants and soils are currently taking up more carbon than we are releasing by our rapid deforestation. Despite this, since 1750 plants and soil have lost 30 Gigatonnes of carbon due to even more rapid deforestation in temperate zones when the CO2 fertilization effect was smaller.)
- The additional concentration of CO2 will still be having an impact when equilibrium is reached, at which time no net energy will be absorbed, by definition of equilibrium. That does not mean its greenhouse effect will have ceased. Therefore, to avoid confusion, the effect should be described as reducing the efficiency of eliminating waste heat rather than of absorbing incoming energy (which is inaccurate on two counts).
- Correct so far as I know, but my level of knowledge is not deep in this area (as Rob Painting).
- The fundamental equation describing the heat balance is Forcing = Change in heat content + λ x Global Mean Surface Temperature (GMST), where λ is the climate sensitivity factor. So, the current change in heat content is a function of forcing, climate sensitivity and the current temperature, whereas the final temperature reached for equilibrium is purely a function of forcing and climate sensitivity (as change in heat content reduces to zero by definition of equilibrium). Therefore, IMO, GMST is a more important indicator than change of heat content (although several SkS authors disagree with me on this). Change in heat content, however, remains very important, and crucially, absolutely refutes any notion that the overall change in temperature is due primarilly to internal variability.
- As of AR4 (on which the SkS graphic is based), the entire heat gain at the surface due to ice melt represents just 2.1% of the total, equivalent to that from the warming of surface soils, and less than that from the warming of the atmosphere. It is tempting to think it is a major player in the heat budget, but it is not. It is one of several minor players that together add up to between 5 and 10% of the total surface energy budget, with the ocean being the giant in the room. As a side note, there are other, even smaller minor players, such as increased energy in winds and waves (which are getting stronger, and larger on average), and increased storage of energy as chemical energy due to the CO2 fertilization effect. These are truly bit players, in the drama, however.
-
MA Rodger at 06:06 AM on 24 January 2015The oceans are warming so fast, they keep breaking scientists' charts
One Planet Only Forever @16.
A couple of corrections.
In your first point. While the eventual home of the majority of our CO2 will be in the oceans, at present roughly 45% remains in the atmosphere, 30% in the oceans and 25% in the biosphere. So the atmosphere is presently still larger not smaller.
In your second point. It is the infra-red on the way out that is increasingly intercepted by CO2. Mind, at higher frequencies, CO2 does do a small bit of intercepting sunlight, but only a little. The big effect is in the infra-red at about 15 microns. (A little graphic of mine 2 clicks (usually) down here.)
In your fourth point. The SST & land temperature do not provide a direct indicator of the radiation imbalance at the top of the atmosphere, which is the forcing yet to be equalised by warming. What is good is ΔOHC as the thermal mass of the oceans is the big thing that needs warming.
In your fifth point. They call it the latent heat of fusion and 300Gt of ice (=300 cu km) requires about 10^20J to melt. So even with something like Greenland shedding 600Gt, the Arctic Ocean 300Gt, Antarctic 300Gt, other glaciers 300Gt, melting ice is small compared with ΔOHC.
-
knaugle at 05:52 AM on 24 January 20152015 SkS Weekly News Roundup #4A
I've noticed deniers going bonkers over NASA - Gavin Schmidt's supposed statement that he is only 38% sure 2014 was warmest on record, but can only find it in places akin to checkout aisle rags, like the Daily Mail. Anyone know where this claim comes from? Sure didn't see it on NASA or NOAA.
Moderator Response:[TD] See the comments starting here.
-
MA Rodger at 05:41 AM on 24 January 2015The oceans are warming so fast, they keep breaking scientists' charts
gregcharles @15.
Sorry. My bad typing. 1995 should have been 1955. If I cut & paste from Levitus et al (2012), then there'll be no mistake:-
We computed decadal monthly means by averaging all data within each month for decadal periods beginning with 1955–1964 and then averaging these decadal climatological monthly means to compute the long-term climatological monthly mean (1955–2006) at each gridpoint.
-
jja at 05:11 AM on 24 January 2015The oceans are warming so fast, they keep breaking scientists' charts
Just as an interesting calculation, if that heat going into the ocean (10*1022 Joules in 8 years) had all gone into the air instead then air temperatures would have risen 19.4 C in those 8 years.
This is more than an interesting calculation. This is a whole series of communications that ABSOLUTELY MUST absolutely must be placed into the minds of the public. It absolutely destroys any conversation regarding a "pause". AND And it CLEARLY clearly shows the severity of current global warming. I have used this as a talking point to deniers that claim a pause and they, of course, choose not to believe it. Because there is absolutely no response except. We are experience catastrophic global warming.
Moderator Response:[JH] The use of "all caps" is akin to shouting and is prohibited by the SkS Comments Policy.
-
jja at 05:06 AM on 24 January 2015The oceans are warming so fast, they keep breaking scientists' charts
The accumulation of 6E22 joules in the earths oceans from 2010 to 2014 yeilds an average Top of Atmosphere energy imbalance of .932 Watts per Meter Squared. If this only represents 94% of the total energy deposited in the earth biosphere the average TOA value is .991 Watts per meter squared from 2010 to 2014.
I wonder what the effect of South East Asian aerosols is on the current TOA? -
One Planet Only Forever at 04:50 AM on 24 January 2015The oceans are warming so fast, they keep breaking scientists' charts
I would like some confirmation that my understanding of what is going on is correct.
- A substantial amount of the CO2 added to the recycling environment of the planet (the surface waters and air), by humans burning buried hydrocarbons eds up absorbed into the oceans. A smaller portion collects as a higher concentration of CO2 in the atmosphere.
- The additional concentration of CO2 in the atmosphere means that more of the incoming energy from the sun will be captured by the planet. And the surface of the planet that emits absorbed solar energy as infrared energy that CO2 absorbs will need to be higher to balance the energy in with energy out.
- And a lot of energy in that warmer surface gets taken down into the oceans. This heat absorbtion will be more rapid in La Nina conditions and would be slower in El Nino conditions.
- So the increased heat content of the oceans is an indication of the warming. However, the long term average of the surface temperature is still a meaningful measure since it relates to the changes needed to rebalance incoming energy with outgoing energy as atmospheric CO2 concentrations increase.
- Net loss of ice mass would be another 'energy change' that is occurring. The latent heat, maybe not the correct term in this context, of melting ice occurs with no change of temperature as the ice transforms to water. This would be another large energy change that is occurring.
-
Tom Dayton at 04:48 AM on 24 January 2015Global warming made 2014 a record hot year – in animated graphics
Nick Stokes also has created useful plots of the durations of record temperature years. Click the little arrow buttons to switch across different temperature datasets. But note that many of those lack 2014 records so far.
-
gregcharles at 04:40 AM on 24 January 2015The oceans are warming so fast, they keep breaking scientists' charts
@BillTheFrog and MA Rodger
All right, fair enough. Yes, it makes sense to report total heat as an anomaly, and based on the the negative values in the chart, it is obviously what they are doing. I'm still not sure why that can't be stated along with the chart for clarity, but I suppose it doesn't matter.
I will point out that the baseline used seems to be around the 1980 pentadal average, not 1995-2006.
-
Tom Dayton at 04:40 AM on 24 January 2015Global warming made 2014 a record hot year – in animated graphics
Nick Stokes has a very technical discussion of uncertainty at Moyhu. Gavin Schmidt from NASA Goddard explained in response to Nick's question at RealClimate:
[Nick commented:] It’s not clear how you then went to the odds of 2014>2010. Because 2010 basically wasn’t sampled in different places. So it seems there is a major component of variation missing. How is that handled?
[Response: Nothing sophisticated. These estimates are based on a 1 sigma of 0.05ºC, increasing backwards in time, and assuming independence for any one year which seems reasonable. If you have something better and tractable, let me know. – gavin]
-
Rob Honeycutt at 01:56 AM on 24 January 2015Renewables can't provide baseload power
Tracy... If there's no big money going into this, that's probably a very strong sign that smart people have taken a close look and determined that it's not the most viable solution.
-
CBDunkerson at 01:52 AM on 24 January 2015It's too hard
James P wrote: "...it is fairly obvious to the non-scientist like myself..."
So you are a non-scientist... but you insist that scientific peer review must be like whatever (non-scientific) review process you are familiar with? What was that you were saying about bias and opinions and personal passions clouding issues?
-
CBDunkerson at 01:47 AM on 24 January 2015Temp record is unreliable
James P wrote: "This conveniently ignores the fact that we need to have absolutely certain climate information and we need to know for what period absolute certainty exists before we can even begin to discuss climate change in a rational manner. I don't see why anyone would bother otherwise."
By this 'logic' the entire history of science and technological progress would be out the window.
Cave man learning to make fire? Why would he bother when he clearly didn't have "absolute certainty" about how fire worked? Wright brothers building an airplane? Why would they bother when they clearly didn't have "absolute certainty" about how fluid dynamics would impact the craft?
In essence you argue that we cannot start until we have finished. If we knew everything about climate science with absolute certainty there wouldn't be any need for further research or debate... we'd be done. We'd know everything. To set that (impossible) end state as a pre-requisite for starting is just ridiculous.
The real question is whether we know enough to make reasonable predictions... but since the answer is "yes", deniers are forced to seek a different, irrational, standard.
-
MA Rodger at 01:45 AM on 24 January 2015The oceans are warming so fast, they keep breaking scientists' charts
jsd @13.
Any impact from choice of climatology depends on your data-gap-filling strategy according to Lyman & Johnson (2014).
-
jsd at 01:25 AM on 24 January 2015The oceans are warming so fast, they keep breaking scientists' charts
@MA Rodger
I guess the choice of the reference period (climatology) is very important to the long-term trend, see the following paper.
http://journals.ametsoc.org/doi/abs/10.1175/JTECH-D-14-00169.1
-
T. Cossins at 00:49 AM on 24 January 2015Renewables can't provide baseload power
"all money goes to gargantuan projects..."
Thus non-mainstream scientists must appeal to crowd-funding campaigns or other non-governmental means in order to get measly dollars enough for just few theoretical works.
http://www.indiegogo.com/projects/focus-fusion-empowertheworld--3
http://spectrum.ieee.org/energywise/energy/nuclear/how-far-can-crowdfunded-nuclear-fusion-go -
DSL at 00:24 AM on 24 January 2015Temp record is unreliable
And James, if you have access to any absolute certainty regarding anything, please share with the world. It's the ethical thing to do. You might even win a Nobel, or several! Keep in mind that an actual absolute certainty would be instantly recognizable by everyone else.
-
DSL at 00:21 AM on 24 January 2015Temp record is unreliable
James P: "Given the passion generated by the subject of climate change, it is fairly obvious to the non-scientist like myself that the general atmosphere in which the discussion is unfolding is not sufficiently dispassionate to bring us anywhere near the conditions in which peer review could be carried on in an appropriate manner."
You are confused, James. The general atmosphere in which the debate is unfolding is the atmosphere of scientific journals. You're probably transferring the passion seen in the internet debate to the scientific debate (e.g. Judith in publication is not Judith on the internets). This is an error. If you stand back away from the published science and remain there, you will continue to be tempted to make the scientific debate out to be whatever you want it to be. You've just given in to that temptation by ignoring Tom's substantial response. -
Tom Curtis at 23:15 PM on 23 January 2015Temp record is unreliable
James P @326:
1) I am a veteran of creation/evolution debates, as well as climate science debates. On the way I have also debated a number of other kooks, including a self avowed geocentrist and a person who thinks global warming is caused by radar. I know from long experience that we live in an era of gullibility were any well established science can be questioned by large proportions of the population on grounds that come down to mendacious rhetoric. You want to pretend otherwise? Then the more gullible are you.
2) In my post @ 324 I gave an extensive, informative answer to your question. Your response has been to ignore that response except for a side comment that is off topic on this thread, and not relevant to your initial question. That suggests to me your question was not asked in good faith. That you describe your question as "your point" confirms that, ie, that you were angling for a rhetorical hook, not asking a question out of a genuine interest to learn the relevant facts.
@325:
By conventional wisdom, "absolute certainty" is only to be had in logic and mathematics. Emperical science must restrict itself to limiting uncertainty. I find more interesting, however, the etymology of the term "absolute certainty". Strictly that means "a certainty that has no solvent", ie, a certainty that cannot be dissolved by any fact or evidence. "Absolute certainty" is actually only the realm of the dogmatists. Your demand for "absolute certainty" from science is then a demand that science cease to be science. Rightly, friends of science resist such demand.
-
James P at 22:59 PM on 23 January 2015Temp record is unreliable
TYPO in #326 'a precious few' was intended not 'the precious few'
-
James P at 22:53 PM on 23 January 2015Temp record is unreliable
Tom Curtis (#324) writes, 'As Rob P notes, there is no such thing as data that no-one disputes, particularly in an era of pseudo-skepticism. Those, however, are the basic facts the fake skeptics will need to studiously ignore, or distort.'
First of all, I find myself wondering who these dreadful people are who are apparently driven by some kind of nihilistic urge to 'studiously ignore, or distort' basic facts. Do such people even really exist? What on earth is the motivation of these 'fake sceptics'?
Second, when 'there is no such thing as data that no-one disputes,' I find myself wondering how seriously to take a scientific debate that is based on the idea that since you can't convince everyone of your 'facts' you can just insult them for not being convinced.
Third, the expression 'era of pseudo-skepticism' surprises me greatly. We actually live in an era of overwhelming conformity and adherence to doctrines promulgated in schools, universities, the mass media, and government propaganda. Outside that, there are just a few heretics whose only outlet for their opinions seems to be the comments sections of the precious few websites, most of which will probably only end up deleting them.
-
Tom Curtis at 22:47 PM on 23 January 2015It's too hard
Well, at least James P has made it clear what he wants to be true about peer review in climate science. Unfortunately he fails to provide any evidence the peer review in climate science is broken. He also shows that he considers entertaining about him the hypothesis that he entertains about climate scientists is, in his opinion, ad hominen. Personally, I don't think so - but if that is his opinion, he indicts himself.
Prev 623 624 625 626 627 628 629 630 631 632 633 634 635 636 637 638 Next


