


 Arguments


Recent Comments
Prev 624 625 626 627 628 629 630 631 632 633 634 635 636 637 638 639 Next
Comments 31551 to 31600:
-
James P at 22:41 PM on 23 January 2015Temp record is unreliable
Rob P. (#323) writes, 'This is an impossible standard' and then goes on to trivialise my point through what is a kind of reductio ad absurdem. This conveniently ignores the fact that we need to have absolutely certain climate information and we need to know for what period absolute certainty exists before we can even begin to discuss climate change in a rational manner. I don't see why anyone would bother otherwise.
Moderator Response:[Rob P] - Impossible expectations are one of the 5 main characteristics of scientific denial. See this SkS post: The 5 characteristics of scientific denialism. The meat and potatoes quote:
The authors define denialism as "the employment of rhetorical arguments to give the appearance of legitimate debate where there is none, an approach that has the ultimate goal of rejecting a proposition on which a scientific consensus exists".
-
James P at 22:33 PM on 23 January 2015It's too hard
Tom Curtis (#47) referred to a distinction between 'peer review based on quality of paper from peer review as viewpoint discrimination' What I'm suggesting is that such a distinction cannot be made in the real world. Overwhelmingly, people discriminate against viewpoints they do not like by dismissing such viewpoints as 'not quality.'
-
James P at 22:24 PM on 23 January 2015It's too hard
Tom Curtis (#47) the human tendency is towards double standards, where someone whose opinions differ from one's own are held to a much higher (sometimes impossible) standard while opinions one likes are regarded with benevolence and the expectation that these opinions should be backed up by hard evidence is much lower. Given the passion generated by the subject of climate change, it is fairly obvious to the non-scientist like myself that the general atmosphere in which the discussion is unfolding is not sufficiently dispassionate to bring us anywhere near the conditions in which peer review could be carried on in an appropriate manner. (That your comment ended with an ad hominem comment - a slur on my intellectual capacity - is, itself, proof of this contention.)
-
MA Rodger at 21:05 PM on 23 January 2015The oceans are warming so fast, they keep breaking scientists' charts
gregcharles @10.
The refernce period used by Levitus et al (2012) on who's methods the data is derived use a reference period of 1995-2006 to base their anomaly.
That the graph represents an anomaly of some sort is surely obvious, unless you can explain a negative absolute heat content - an interesting concept.
-
Tom Curtis at 19:00 PM on 23 January 2015It's too hard
James P @46, your claim indicts your discipline as not being scientific, rather than calling into question peer review in other disciplines. Or (a more conservative hypothesis), perhaps it merely indicts you as not being able to distinguish peer review based on quality of paper from peer review as viewpoint discrimination.
-
Tom Curtis at 18:55 PM on 23 January 2015Temp record is unreliable
James P, the thermometer record, particularly that used by HadCRUT4 was very restricted up until 1880. That can be seen in this graph of the percentage of the land/ocean area covered by their record:
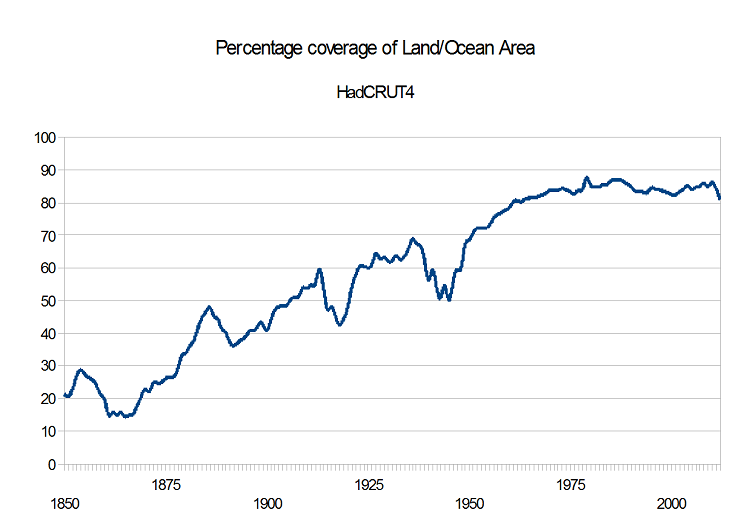
After 1880, although coverage was not universal it was also not significantly biased in geographical representation except for sparse coverage in the Arctic, and zero coverage in the Antarctic. Antarctic coverage for all datasets was accomplished in approximately 1957, as part of activities related to the International Geophysical year.
As Rob P notes, there is no such thing as data that no-one disputes, particularly in an era of pseudo-skepticism. Those, however, are the basic facts the fake skeptics will need to studiously ignore, or distort.
The real question is, how much difference does the lack of coverage make? Prior to 1880, arguably it makes a very big difference because their was not only a lack of coverage, but such coverage as existed was heavilly biased towards Europe and North America, along with the North Atlantic. That is the reason GISS and NOAA do not extend their temperature records back prior to 1880. After 1880, however, except for Antarctica, the coverage is typically extensive and not geographically biased such that only minor distortions of the temperature record can be expected.
That last point was ably demonstrated by Caerbannog, who randomly chose 85 rural stations with long records, such that only one station was to be found in any given 20o x 20o cell at any time, and took the simple average to determine a global temperature:

As you can see, divergence from the GISS temperature record is minimal. So, after 1880 coverage issues do not typically impact on estimates of global mean temperature, and to the extent that they do have only a small impact (the 0.05 C uncertainty interval, in fact). Indeed, the improvement of the record over time has recently been illustrated by Gavin Schmidt with a plot of the PDFs of the temperature of successive record warm years in the GISS record:

-
shoyemore at 18:36 PM on 23 January 20152015 SkS Weekly News Roundup #4A
The link US conservatives erupt over pope's plan for encyclical on moral duty to address climate change leads to a different story Climate change researcher to sit with first lady at SOTU
Just pointing that out.
Moderator Response:[JH] Link fixed. Thank you for pointing out the glitch
-
SteveFunk at 17:31 PM on 23 January 20152015 SkS Weekly News Roundup #4A
Any estimates on the Colima volcano yet? Will this have a measurable cooling effect?
-
James P at 16:17 PM on 23 January 2015It's too hard
"You need to start citing peer reviewed articles, not Koch propaganda," someone wrote above.
I fail to see any reason to trust 'peer reviewed articles.' I know from my own experience (in another discipline) that the peer review process is just a way of screening out dissent. When a reviewer agrees with a point of view advanced in an article, they don't even care if many of the 'facts' that support it are adequately referenced. Peer review is a bad joke.
-
James P at 15:58 PM on 23 January 2015Temp record is unreliable
As someone who takes a passing interest in the climate change debate, what I would like to know is the first (i.e., earliest) year for which we have temperature data for the entire planet, data that no one disputes. My guess is that it's only fairly recently, say a date in the '50s or '60s. Does anyone know?
Moderator Response:[Rob P] - "year for which we have temperature data for the entire planet, data that no one disputes"
This is an impossible standard. Some people still insist bigfoot exists, that they've been abducted by aliens, that Earth isn't warming etc. There is always going to someone who disputes the facts.
-
DavidPalermo11600 at 13:48 PM on 23 January 2015Global warming made 2014 a record hot year – in animated graphics
Tom Dayton et al...
THANK YOU. Yes I understand it's the trend that matters. The thing that I am still struggling with is that the deniers will indeed say "38% probabilty is not very certain". My mathemetician friend explained it to me but I am not sure yet I can explain it very well to someone. I will read Schmidt's new article.
Thanks all,
DavidModerator Response:[Rob P] - I wouldn't worry too much by how climate contrarians frame things, nor of trying to convince them of anything. You can't reason someone out of a position they never reasoned themselves into in the first place. As for probabilities, maybe a simple graph might help?

The probability of 2014 being the warmest year (due to margin of uncertainty and the small differences between years) is almost ten times that of 1998. And the contrarians were very certain that year was warm!
-
Tom Dayton at 13:00 PM on 23 January 2015Global warming made 2014 a record hot year – in animated graphics
David Palermo, the deniers want the public to think that the lack of 100% certainty about whether 2014 was the warmest year, means that any year easily could have been the warmest--any year including 1998, 1895, .... They want the public to extrapolate that scientists have no idea what year was warmest.
In fact, those 38% and 48% probabilities are relative to the set of four or five years that are in that table, and all of which are recent years. It doesn't really matter which individual year was the warmest, because it's the trend that matters. The warming trend is supported by that table's inclusion of only very recent years in the set of years in which lies the warmest year--with near 100% certainty. Interpreting those individual year probabilities properly as being relative within that set, as HotWhopper pointed out 2014 is by far the most likely to be the warmest.
-
Jim Hunt at 12:08 PM on 23 January 2015Global warming made 2014 a record hot year – in animated graphics
David @33 - With HadCrut4 still to come ECMWF have thrown a curve ball:
http://www.ecmwf.int/en/about/media-centre/news/2015/ecmwf-releases-global-reanalysis-data-2014-0
ERA-Interim’s reanalysis confirms that 2014 was indeed a warm year, but indicates that it was probably not the warmest. This discrepancy is mainly due to differences in data coverage in the Arctic and Antarctic, which are enough to affect the ranking of different years.Read Gavin and Tamino though!
-
Jim Hunt at 12:00 PM on 23 January 2015Global warming made 2014 a record hot year – in animated graphics
Gavin Schmidt has a new article up over at RealClimate:
http://www.realclimate.org/index.php/archives/2015/01/thoughts-on-2014-and-ongoing-temperature-trends/
His conclusions after all the brouhaha?
The excitement (and backlash) over these annual numbers provides a window into some of problems in the public discourse on climate. A lot of energy and attention is focused on issues with little relevance to actual decision-making and with no particular implications for deeper understanding of the climate system.
In my opinion, the long-term trends or the expected sequence of records are far more important than whether any single year is a record or not. Nonetheless, the records were topped this year, and the interest this generated is something worth writing about. -
billthefrog at 10:28 AM on 23 January 2015The oceans are warming so fast, they keep breaking scientists' charts
@gregcharles
I suspect there is no baseline heat content specified because it would be a rather meaningless number. The surface area of the planet is about 511 million square kilometres, of which around 70% is ocean. The mean depth is, if memory serves, around 4 kilometres, so the ocean volume would be somewhere around 1.43 x 10⁹ cubic kms, or 1.43 x 10¹⁸ cubic metres.
As a cubic metre of water weighs a bit over a tonne, we're talking about 1.5 x 10²¹ kgs. If the average temperature of the ocean was, say, 7 degrees Celsius, then that's about 280 Kelvin.
There is a variation of specific heat with temperature, but as a quick approximation (for at least part of the range between Absolute Zero and 7 degrees Clesius) one can use a figure of 4,000 Joules kg-1 k-1
Putting that lot together comes out at (if I can still do sums at half past midnight) - wait for it - around 1.7 x 1027 joules. (Obviously I've left out any contribution from phase change latent heat as well.)
That's why the starting figure is basically irrelevant.
Hope that provided some insight into the wacky world of energy calculations. (I also hope I didn't cock it up too badly!)
Cheers Bill F
-
Tom Curtis at 10:21 AM on 23 January 2015Global warming made 2014 a record hot year – in animated graphics
TomDayton, thanks for the link to Sou's excellent article. I particularly enjoyed the link to the slides for Schmidt's presentation of the data of for 2014, from which the table above comes. (I had previously only seen it in a tweet.) That the table was included in that presentation shows the cluelessness or chicanery of the "skeptics". They first complain that Schmidt claimed 2014 was a record with no mention of uncertainty. They then, seperately claim that Schmidt has retracted the prior claim. They make no mention that both events occured in the same press presentation, and that the "retraction" was just Schmidt's presentation of the uncertainty in a way that is easier to understand. So, both the earlier claim that Schmidt did not present uncertainties is incorrect, and the claim that he later retracted is incorrect - and both display incompetence or dishonesty.
-
Tom Curtis at 10:13 AM on 23 January 2015Global warming made 2014 a record hot year – in animated graphics
DavidPalermo @33, Gavin Schmidt published this table:

These results are implicit in the stated temperatures for the various years, together with the stated uncertainty. There is nothing new in this, and nothing in it contradicts the fact that the global mean surface temperature as determined by NASA GISS was higher in 2014 than in any prior year. The near universal (SFAIK) portrail of the release of these figures as being a veversal of prior claims by NASA about 2014 show either a total lack of comprehension of basic stastics by their authors, or a deliberate intent to deceive.
The real story in those figures is that the claim that 1998 was not the hottest year on record is statistically significant. The "skeptics" favourite cherry pick just became obsolete and they are trying desperately to draw attention away from that fact.
-
Rob Honeycutt at 10:07 AM on 23 January 2015Global warming made 2014 a record hot year – in animated graphics
This graphic does a pretty good job...
-
Tom Dayton at 09:55 AM on 23 January 2015Global warming made 2014 a record hot year – in animated graphics
DavidPalermo, HotWhopper addressed the probabilities.
-
DavidPalermo11600 at 08:52 AM on 23 January 2015Global warming made 2014 a record hot year – in animated graphics
So, I am puzzled. All the skeptics now are saying that 2014 may not be the warmest on record because Dr. Gavin Schmidt is "only" 38% sure it is. And accoring to NASA (Schmidt) the probability is ~38%. See here page 5:
http://www.ncdc.noaa.gov/sotc/briefings/201501.pdf
How can I explain that the 38% is the best probablity of all the possible warmest years? I looked and looked and looked and I can't find anything that will help me explain and understand that somehow 38% is a high probability? Is it? I also wrote to Schmidt but have not hear back yet.
Thanks!
DavidModerator Response:[PS] Fixed link
-
Mal Adapted at 08:32 AM on 23 January 2015Renewables can't provide baseload power
Not only is there no support for the idea that "all money goes to gargantuan projects rather than cheaper and more promising devices", there's direct evidence to the contrary.
One hopes Nelson Mandela would be a little more (genuinely) skeptical than some of his admirers.
-
gregcharles at 07:51 AM on 23 January 2015The oceans are warming so fast, they keep breaking scientists' charts
@Rob and Glenn
Yes, I know that surface temperatures are usually reported as difference from a mean, but generally (not always) the chart specifies what the baseline is. I'm not sure why they didn't do that here.
-
Glenn Tamblyn at 07:43 AM on 23 January 2015The Oceans Warmed up Sharply in 2013: We're Going to Need a Bigger Graph
Well,Rob called it a year ago.
NOAA just changed the scale of their graph (select panel 2). It is now -10 - +25. That should last for another 4 years. Then it will need to be 30, then 35, 40, 45 .... you get the picture. -
Sapient Fridge at 06:56 AM on 23 January 2015The oceans are warming so fast, they keep breaking scientists' charts
Esop, I really wish newspapers would re-visit cold climate predictions they have made in the past, such as this one from The Australian in 2008. Alas they never do.
-
Tom Curtis at 06:52 AM on 23 January 2015Renewables can't provide baseload power
Tracy Cossin @120, as the researchers who develop a viable, commercial fusion reactor (or who even just develop the prototype of such a reactor) will gain a large financial benefit from intellectual property rights, not to mention lasting fame, you can be sure their research is directed where they consider there is the highest prospect of success.
The problem with fusion is that while it is very possible, and occurs naturally in the conditions at the center of stars, it is very difficult to get it to occur under conditions at the surface of our planet. Or more correctly, it is very difficult to maintain the stellar conditions required by fusion on the surface of our planet. As a result, even though research of fusion began in the 1950s, it was not until two years ago that a fusion reactor generated more energy than was absorbed by the plasma. No fusion reactor has yet generated more energy than was used in sustaining the operations of the reactor. Despite this, hopes are high that that milestone will be passed by 2027 in a new experimental reactor currently under construction. At greater than 16 billion Euro cost to date, for a planned 450 net MW output, the plan is hardly commercial.
Given this, there is justifiable skepticism that comercial fusion power can be developed quickly. There is even reasonable skepticism that fusion power, even if stable and self sustaining will ever be commercial within the coming century. I hope that skepticism will turn out to be wrong, but I would not bet against it. I would certainly not bet our chance of a 22nd century climate that was stable and suitable for our civilization on it.
-
MA Rodger at 06:38 AM on 23 January 2015The oceans are warming so fast, they keep breaking scientists' charts
If I haven't put the decimal point back to front, I calculate the Levitus OHC 0-2000m rise (using regression) over the last 3 to 4 years is running at 1Wm-2 globally = +16Zj pa.
-
boba10960 at 06:30 AM on 23 January 2015Not pHraud but pHoolishness
A late post to this thread, but there is a point related to the original article that is worth noting in case the “Wallace v. Feely” issue arises again.
In addition to spatial and temporal aliasing in the collection of historical data, noted in the original article, one must also be aware that not all pH values are directly comparable. This is because scientists use different “pH scales” (methods of calibration) when determining pH. In a recent review article, Frank Millero noted “Unfortunately, the carbonate constants used to study the CO2 system in the oceans are reported on different pH scales, confusing many trying to understand the carbonate system.” (In case the link doesn’t work, the reference is Treatise on Geochemistry, 2nd edition, Volume 8, Chapter 8.1). Equations 13-16 in the review article show that the same reference seawater can have pH values of 8.32, 8.19, 8,05 and 8.06 on four commonly used pH scales. This range of values is comparable to the change in pH of the ocean over the past century. Historical pH data have been reported on different pH scales, so it is possible that some of the variability in the early 20th century results from the use of different scales, as well as from other problems noted in the original article.
The value of the work by Feely and Sabine is that the results are based on uniform and internally consistent measurements, thereby creating a more robust trend than can be obtained by simply combining all historical data without normalization to a common analytical method.
-
Glenn Tamblyn at 06:22 AM on 23 January 2015The oceans are warming so fast, they keep breaking scientists' charts
Esop.
Yep, of course it's cooling. 'Cause sea level is rising and, you know, when the temperature drops the liquid in a thermometer goes .... um .....
These folks really are bizarre!
Just as an interesting calculation, if that heat going into the ocean (10*1022 Joules in 8 years) had all gone into the air instead then air temperatures would have risen 19.4 C in those 8 years.
Not warming My A**e!
-
Esop at 06:06 AM on 23 January 2015The oceans are warming so fast, they keep breaking scientists' charts
The interesting thing is that over the fast 5 or so years, the deniers have willingly painted themselves into a corner by forecasting anything from mild to dramatic cooling. I can't count the number of times that I asked deniers back in 11/12/13 what their explanation would be when 2014 or 15 would break the record. The answer was always the same: It is cooling.
Back in 2011 or 2012, Norways #1 newspaper ran an article that contained an interview with top ''skeptic'' Ole Humlum, regurgitating the same old denialist mantras, with the mandatory predictions of rapid cooling due to record low solar activity in the coming years, negative PDO and the other usual suspects. I emailed the journalist (and got a response) and told her to do a follow up interview with Humlum & co in 2014 or 15, when the record would likely be broken. I' m not holding my breath, though, even though she might start thinking when the very confident prediction of a layman beat the predictions of her assembled her hand picked panel of ''experts'' (Humlum and (AGW ''skeptic'') solar physicists).
With leading denialists having for years predicted rapid cooling due to natural drivers, but what we instead have seen is more warming, will this wake up at least some of the ''skeptics''? Of course not the paid, pro level guys who know perfectly well what they are doing, but will some of the useful idiots now slowly start to wake up, and what will the implications be?
Will they turn quiet, or will they stand their ground and keep on denying, or will they turn against those that have fooled them for so long?
-
Glenn Tamblyn at 06:04 AM on 23 January 2015The oceans are warming so fast, they keep breaking scientists' charts
Since John put this post together, NOAA have updated the graph. The vertical scale now goes up to 25. At the curent rate of warming (10*1022 in 8 years) they won't have to do this again for another 4 years. Then the top scale will go to 30. Then 35, 40, 45.... You get the picture.
-
Glenn Tamblyn at 05:59 AM on 23 January 2015The oceans are warming so fast, they keep breaking scientists' charts
gregcharies
"Is this chart reporting differences from an average?"
Yes. As with much climatological data, they are measurng an anomaly - how much something has deviated from the average from a baseline period. The baseline can be arbitrary since the data is all relative.
Anomalies are used since you can get a more accurate result. Any reading of anything includes some inaccuracies. And some of these inaccuracies can be fixed, present in every reading as biases. When we take the difference between 2 readings any of these fixed biases cancel out.
-
Rob Honeycutt at 05:57 AM on 23 January 2015The oceans are warming so fast, they keep breaking scientists' charts
gregcharles... The zero axis is a baseline average of the data, though I'd have to look up what time frame they use to calculate the baseline. With surface temperature data they generally use a 30 year baseline average of 1951-1980 (GISS). I imagine they're doing something similar with OHC.
-
gregcharles at 05:43 AM on 23 January 2015The oceans are warming so fast, they keep breaking scientists' charts
Why is heat content before 1980 below 0? Is this chart reporting differences from an average?
-
Rob Honeycutt at 03:47 AM on 23 January 2015Renewables can't provide baseload power
No one is saying that fusion isn't possible.
There is no support for the idea that money doesn't go to cheaper and more promising devices.
-
Maggnum at 03:47 AM on 23 January 2015Greenland is gaining ice
Last updated Nov 2011? I think this needs an update! Come on John, I'm sure you have nothing but time on your hands. :)
-
michael sweet at 03:18 AM on 23 January 2015Matt Ridley wants to gamble the Earth’s future because he won’t learn from the past
Ryland,
It is interesting to hear that Mr. Asten has changed his claim to " the pause in warming from 2000 on". Last year the deniers claimed the pause started in 1998.
-
T. Cossins at 03:17 AM on 23 January 2015Renewables can't provide baseload power
Laws of Physics does not prohibit fusion from occurring.
A real problem is that all money goes to gargantuan projects rather than to cheaper and more promising devices. -
Jim Pettit at 00:40 AM on 23 January 2015Matt Ridley wants to gamble the Earth’s future because he won’t learn from the past
@ryland
A couple of things:
1) The Australian is yet another Murdoch-owned rag.
2) The Australian is behind a paywall; no thinking person would ever pay good money to read something from a Murdoch-owned rag (see #1 above).
3) Professor Asten has a long track record of climate change denialism.
So: given that the article to which you've linked is a) in the Murdoch-owned Australian, b) was written by a fake "skeptic", and c) by your statement contains references to the non-existent "pause" (and likely many of the other debunked zombie Asten continues to use), my "critical comment" would be this:
The article has no credibility where climate science is concerned, and therefore has no value.
-
ryland at 00:17 AM on 23 January 2015Matt Ridley wants to gamble the Earth’s future because he won’t learn from the past
There is a piece in The Australian of January 22 from Michael Asten Professor of Geophysics at Monash University in which he makes a number of points on global warming, the pause in warming from 2000 on and the statement that 2014 was the warmest year ever (http://tinyurl.com/o3yq2vf). It would be great to get some critical comments from SkS readers
Moderator Response:[Rob P] - Of course this is only one surface temperature data set, and monthly data at that, but where's the paws pause?

-
DSL at 00:01 AM on 23 January 2015Renewables can't provide baseload power
Yeah, I been trying to bring my dad back to life so I can ask him a question about my car. It's not working so well, but I keep thinking about what Nelson Mandela said, and I'm going to keep trying.
-
Glenn Tamblyn at 23:04 PM on 22 January 2015Renewables can't provide baseload power
Unless of course it is impossible because it's impossible.
Thats the problem with all that 'taking a positive attitude' stuff. It doesn't differentiate between those things that are amenable to being solved with just some 'positive attitude', and those things where the Laws of Physics say "screw your attitude, this is reality"
-
T. Cossins at 22:12 PM on 22 January 2015Renewables can't provide baseload power
"It always seems impossible until it's done" - Nelson Mandela
-
One Planet Only Forever at 14:27 PM on 22 January 2015Call to climate scientists: submit your quote for 97 Hours of Consensus 2015
kmoyd,
I would ask you to consider the economic arguments in an even more challenging way.
Delaying reduction of impacts will increase the future consequences. The ones benefiting in the current generation from the delay, from the increased trouble-making, are not going to be suffering the future consequences. So any comparison of anyone's present day lost opportunity to future costs to others is clearly a red-herring type of argument. It is fundamentally unacceptable for any generation to make things worse for a future generation, no matter how much richer the current generation thinks it could be.
The same reasoning can be used to argue that it is unacceptable for anyone in the current global generation to benefit in a way that is harmful to others rather than helping them to a sustainable better life.
-
One Planet Only Forever at 13:22 PM on 22 January 2015Matt Ridley wants to gamble the Earth’s future because he won’t learn from the past
As billthefrog has pointed out the problem is not Ridley, it is News Corp and all of its fans.
News Corp does not even try to present a one-to-one 'discussion' of this issue (and certainly not a 97 to 3 discussion). Their media is flooded with attempts to discredit climate science. When they present anything from "the other side" it is planned and presented to to ensure it is surrounded by attacks and unjustifiable attempts to discredit the valid points mentioned.
The fact that so many people are willing to be faithful fans of such obviously crass irresponsible illigitimate unjustifiable behaviour is the problem. And that type of person is encouraged to develop their attitude by a socio-economic-politcal system that rewards and reveres those who are able to get away with illigitimate profitability and popularity.
One way to beat such trouble-makers is to continue to increase the understanding of what is going on and ensure that all people in positions of significant responsibility and influence have no excuse to not understand it. That may enable people in the near future to compile and present solid cases of 'Evidence of a lack of the required mental capability to lead responsibly' as justification for the legal removal of such people from their illigitimately obtained positions of responsibility.
-
John Cook at 13:15 PM on 22 January 2015Call to climate scientists: submit your quote for 97 Hours of Consensus 2015
kmoyd, great comment! There are a couple of answers:
Firstly, climate denial exists in a quantum state. That means many denialists might be admitting one day that humans are contributing to global warming, but you'll find the next day they are back to claiming global warming stopped in 1998. There are many stages of denial and denialists can be observed to subscribing to any number of these stages, even if they're mutually inconsistent.
Secondly, upon your suggestion of asking the scientists to focus on a specific topic, I confess the words "cat herd" immediately came to mind :-) Scientists tend to be an independent, strong-minded bunch (after all, they are the original genuine skeptics). Directing scientists in a particular direction may prove as difficult as herding cats.
However, I think what you will find in this next iteration of 97 Hours, there'll be a much greater diversity of focus in the quotes. In the first 97 Hours, we hunted for quotes ourselves and we tended to restrict ourselves to quotes endorsing the scientific consensus on human-caused global warming. That imposed a certain uniformity on the set of 97 quotes.
This time, scientists are submitting the quotes themselves. So, as a cat herd is wont to do, I'm already seeing a lot more diversity in the focus of the quotes. Scientists tend to be talking more from their own particular area of expertise.
And I'm getting some pretty whacky suggestions on how they'd like to be drawn, which sounds like a lot of fun. One scientist (who featured in the first 97 Hours) asked if he could be drawn bungee jumping. It shouldn't be too hard for people well-versed in the climate issue to figure out who that might be.
-
Tom Curtis at 12:43 PM on 22 January 2015Renewables can't provide baseload power
Rob Honeycutt @115, I guess it is "theoretically possible" for a sufficiently lose definition of theory, but the specific proposal found in the video linked by Tracy Cossin's has not had the physics actually worked out in theory.
That contrasts with two other proposed fusion reactors, one of which may even be converted into a functional design within 15 years. If it is, at the economic replacement rate of power stations, that means that design would solve the problem of CO2 emissions from stationary electricity generation within 50 to 65 years (or 35 to 40 years too late). And the "if" remains very large at this stage, given that they have not even built a prototype at this stage, and expect to take 10 years to do so.
I continue to hope that fusion will play a very large part in humanities future energy budget; but that is a prospect for the end of this century, if that. Even then, it will not replace the need for largescale renewable energy because with continued economic growth, even waste heat becomes a problem for climate, and only renewable energy sources avoid the waste heat problem.
-
scaddenp at 12:36 PM on 22 January 2015The Antarctic ice sheet is a sleeping giant, beginning to stir
KD - all that water piled onto antarctica, depresses the crust below it. Remove and it the crust rebounds (slowly). It also acts (like a land mass) on the water around it (not below it). Melt it and that mass is then spread thinly over ocean instead of concentrated in one place. The effects of that are mentioned in the paper and the calculations described in Bamber 2009. Are you challenging the Bamber maths?
-
Tom Curtis at 12:34 PM on 22 January 2015The Antarctic ice sheet is a sleeping giant, beginning to stir
KD @13, they way you phrase your comment suggests there is some confusion about what is being claimed. In addition to the total gravitational attraction from the Earth, regions of local mass density exert a gravitational force on nearby bodies. This was first measured in relationship to mountains by Pierre Bouguer and Charles Marie de La Condamine in 1738. Equivalent techniques are the basis of the GRACE mission, which measures mass anomalies.
So, it does not make any difference to the Earth's total gravitational field whether ice is piled up 2 km deep in Greenland or spread millimeters deep across the entire surface of the Ocean. However, it makes a very large difference to the lateral gravitational attraction of the ocean towards Greenland. Enough, of all of the ice currently on Greenland is involved, to make a difference of several meters in the local sea level around Greenland (but not appreciably to global sea level). Further, if the ice is melted from Greenland it does not spread evenly over the Ocean surface, even ignoring gravitational effects. Rather, it tends to preferentially pile up near the equator due to the centripetal force. That in turn creates a smaller mass anomally which results in an increased sea level at the equator due to lateral gravitational attraction.
Overall, the effects are complex to calculate, but they are real. They have actually been observed, as shown in the third figure in my post @10. And the theory behind the effect is as old as Newton, who was the first to propose that mountains would divert plumb bobs from the vertical by a slight amount.
-
Rob Honeycutt at 12:25 PM on 22 January 2015Renewables can't provide baseload power
So, in other words... It's not even a theoretical possibility yet.
-
Bob Loblaw at 12:08 PM on 22 January 2015It's not us
In addition to MA Rodger's point that the change in TSI needs to be divided by 4 to account for the disk vs. sphere question, you also have to multiply the value by 0.7 to account for the fact that the earth's albedo averages about 30%. It's the change in absorbed solar that needs to be compared to the greenhouse forcings, not the change in received solar.
Prev 624 625 626 627 628 629 630 631 632 633 634 635 636 637 638 639 Next


