


 Arguments


Recent Comments
Prev 624 625 626 627 628 629 630 631 632 633 634 635 636 637 638 639 Next
Comments 31551 to 31600:
-
One Planet Only Forever at 00:29 AM on 21 April 20152015 SkS Weekly News Roundup #16B
Leto @1,
There is more reason to oppose the support of Lomborg than the fact that he is a discredited denier of the constantly improving understanding of climate science.Bjorn Lomborg is also one of the many 'financial analysts' whose evaluations are based on the belief that it is OK for part of a current generation of humanity to benefit in a way that cannot be continued into the distant future and that creates consequences for others, especially future generations, as long as the benefit the current generation get can be shown to exceed the costs inflicted on others, even if only a few in the current generation benefit.
That is essentially the belief behind a comparison of the 'lost opportunity or cost to some in a current generation' to the 'added costs expected to be dealt with by others, particularly future generations'.
And many of those type of analysts go further than that fundamentally absurd belief. They overstate the 'lost opportunity or cost of the few in the current generation' and understate the 'consequences others will suffer'.
-
CBDunkerson at 00:02 AM on 21 April 20152015 SkS Weekly News Roundup #16B
The Cryosat article above links to a new site where they are now providing recent arctic sea ice data on an ongoing basis. In the past, Cryosat results were only released a few times per year.
-
CBDunkerson at 22:01 PM on 20 April 2015There's no empirical evidence
RedBaron, setting aside the (equally valid) arguments based on carbon isotope levels and lower land use estimates from other sources... I'm having a temporal causality problem with your position that AGW is largely driven by "~300 GtC emissions pior to 1850".
If that were the case, wouldn't atmospheric CO2 levels have risen significantly from those emissions prior to 1850? Yet the "CO2 emissions vs Atmospheric CO2 levels" graph in the main article above shows that atmospheric levels were nearly flat through 1850... increasing significantly only after fossil fuel emissions rose greatly.
Basically, it seems like you are looking at various estimates of total CO2 emissions from different sources and saying, 'Aha, this estimate over here puts a large total on ancient land use emissions... that is the cause!' without considering the timing. How could all of the CO2 emissions from land use prior to 1850 'hide out' and avoid raising atmospheric CO2 levels until after large scale burning of fossil fuels began?
-
Leto at 19:28 PM on 20 April 20152015 SkS Weekly News Roundup #16B
To clarify what I have said above... I am certainly not accusing scientists of cherry-picking. I haven't even read their paper. I am just saying the break into two trends looks odd, and the article should provide more information about what motivated the selection of that particular break point. (The paper should also provide this information, but for all we know it does this already.)
I would be (pleasantly) surprised if the statistical tests used to break one trend into two produced that particular break point, but I know it is hazardous to pit visual intuition against maths. Until we read the original paper, this is all guesswork.
-
Tom Curtis at 18:10 PM on 20 April 20152015 SkS Weekly News Roundup #16B
bozza, there are statistical methods that can be used to determine whether or not it is appropriate to use a single linear trend for the whole data, two seperate trends, a sinusoid, etc. One such is the akaike information criterion. There are others. If the the authors of the paper used such a criterion to establish the appropriateness of using two linear trends, then it is not cherry picking. If they did not, there case for using two linear trends has not been made (at best) and it may be cherry picking. If such methods do not show the two trends to be appropriate and they did not perform the test, then it is cherry picking. Unfortunately I do not have the paper so I cannot comment on whether or not they justified their choice of two trends or not, nor whether the choice is justified independently of whether they attempted to do so.
I will note that in the well known cases of denier cherry picking, it has been shown quite frequently by Tamino that the AIC does not justifiy their choice, and that they are definitely cherry picking.
-
bozzza at 15:31 PM on 20 April 20152015 SkS Weekly News Roundup #16B
ah, yes: I was going to raise the very same question about this last graph being cherry picked for its ripe data... the plot doth thicken methinks!
(..and I'm not altogether sure I'm too happy about it mind you!!)
-
bozzza at 15:23 PM on 20 April 20152015 SkS Weekly News Roundup #16B

This shows the possibility of continuing normal sinusoidality: or does it?
This is the graph I am currently interested in btw but please: all questions about cherry picking of data for deception need to be considered and discussed- I will always agree with that!!
Graphical Information is well known to prove deceptive and must be carefully interpreted, like any data- it's just graphical information can be quite powerful in the mind.
-
bozzza at 15:11 PM on 20 April 20152015 SkS Weekly News Roundup #16B
Cherry picking accusations could be made but it is part of the process of trying to find a trend and then establishing why... life is sinusoidal and any departure from that begs for an explanation. This could be part of normal sinusoidal behaviour (hence the legitimate complaint of unfair cherry picking of data/starting points) but given that the context of previous data is there how can it be cherry picking for the sake of deception... this is cherry picking for the sake of tying to establish realationship!!
This is the process of science...
-
Tom Curtis at 15:01 PM on 20 April 2015There's no empirical evidence
Red Baron @262:
"The half-life of carbon-14 is 5,730±40 years. Any SOM older than 5,730±40 years to the end of the last glaciation period would have a C-14 at 50%-75% similar to Fossil fuels"
In other words, where fossil fuels are 100% depleted in C14, soils are around 75% or less depleted in C14. Put another way, to deplete tropospheric C14 by the same amount, you need 33% more soil carbon than you would fossil fuel carbon. That, however, means you are also depleting C13 in the troposphere 33% faster. That means that if you assume significantly more soil carbon emissions over the last 150 years, you rapidly get a measurable mismatch in the isotope ratios.
That does not mean there is not room for some more soil carbon in the mix. The carbon model predictions are very close to observations, but not perfect, and they have error margins. Therefore it is open for you to show for some potential increase soil emissions, they better match the observations, or match them as well as current estimates. Until you actually do that, however, we have no reason to accept your theory. Just waving your hands is not a scientific argument.
Indeed, given the current accuracy of the models, we can already preclude the possibility that the majority of the emissions hockey stick is from soil carbon rather than from fossil fuels and cement.
-
bozzza at 15:01 PM on 20 April 20152015 SkS Weekly News Roundup #16B
I'm certainly interested in the Greenland albedo stuff and welcome any debate about cherry picking of data as it should always be a legitimate line of enquiry. Are there any links to the contentious data being discussed?
-
Tom Curtis at 14:31 PM on 20 April 2015There's no empirical evidence
Red Baron @262:
"His arguments are generally sound and I accept his sources. Excepting his measurements include highly degraded ecosystems found now and not even close to what they were before human impact."
First, it is not at all clear that the "extirpation and extinction" of megafauna would result in significant carbon emissions. In particular, while it may result in reduced bioturbation at depth, that would merely result in existing carbon being left at depth, rather than it being brought to the surface. It is only where that is coupled with significant erosion and/or desertification that it would potentially lead to emissions, and that is not typically the case.
The most noted desertification, ie, the Sahara, was brought about by changes in rainfall, not by the extinction of megafauna (which were not, in general, driven extinct in Africa) and hence does not fit your model. Come to that, neither does North America (where the survival of bison maintained the lush grasslands you consider so important), nor Australia, which has always lacked hoofed grazers until Europeans brought cattle.
Second, and most importantly, any emissions from soil due to the "extirpation and extinction" of megafauna is already included in Ruddiman's estimations due to the associated C13 signal. Ergo it was taken into account by my tabulation.
Third, whatever the effect of the "extirpation and extinction" of megafauna (or whatever other combination of factors caused the early holocene carbon emissions, ie, Ruddiman's fatal flaw), they occured before the nineteenth century agricultural revolution. Ergo the emissions consequent of that revolution come from the (according to you) already depleted reservoir. Therefore there did not exist the potential in the nineteenth century for the agricultural revolution to cause a hockey stick in emissions. Put another way, if we accept your argument about depletion, it gives us no reason to question Houghton's figures Houghton's estimates are for LUC emissions from (according to you) already depleted soils.
Finally, my critique of Teague's argument about sequestration used the sum of Houghton and Ruddiman's figures, thereby accounting for all LUC over the entire Hollocene. It, therefore, represents the only basis against which to check Teague's claims. You may certainly speculate that Ruddiman got his figures wrong because Teague is (somehow) infallible, but you are then no longer basing your estimates on data, only wishful thinking.
-
Leto at 14:22 PM on 20 April 20152015 SkS Weekly News Roundup #16B
Edit... I mean the points are above the continuation of the first trend line
-
Leto at 13:30 PM on 20 April 20152015 SkS Weekly News Roundup #16B
Chiskoz @2,
I agree that the step looks odd, and I'd be interested in knowing if the timing of that step point was data-driven or chosen arbitrarily. The majority of the initial data points after the step are above the second trend line, so it is odd to suggest, as the graph does, that the first part of the second trend line accurately reflects the beginning of a downward trend.
If nothing else, the division of the data into two groups needs better justification in the figure legend.
Does anyone have a link to the original paper?
-
bozzza at 12:55 PM on 20 April 2015There's no empirical evidence

Do the Albedo Changes in Greenland constitute evidence?
Moderator Response:[JH] Image reduced to conform with SkS guidelines.
-
RedBaron at 11:53 AM on 20 April 2015There's no empirical evidence
@scaddenp
The half-life of carbon-14 is 5,730±40 years. Any SOM older than 5,730±40 years to the end of the last glaciation period would have a C-14 at 50%-75% similar to Fossil fuels. But that's not the whole story, carbon-14 occurs in trace amounts, i.e., making up about 1 part per trillion (0.0000000001%) of the carbon in the atmosphere. Certainly measurable locked in a biological source, but very difficult to distinguish the difference between a stable humus source 50-70% similar to a fossil fuel source having been released into the atmosphere and mixed together. Both will dillute atmospheric C-14 levels, and both have dilluted atmospheric C-14 levels. But that deep SOM largely wasn't released in huge amounts before the industrial age and the spread of the John Deer Plow pulled by tractors and haber process nitrogen fertilizers, disturbing far more acreage far deeper than any previous agricultural practices. That's the key to the puzzle too. The signature is largely hidden in the fossil fuel signature. Very easy to overlook by anyone studying the atmosphere. Mostly the knowledge of this release has been discovered by soil scientists and agricultural scientists (and the quite rare paleosoil scientist like Retallack). Previous to the industrial age the released C-14 isotope ratio from agriculture would have blended in far closer to the O-horizon short term carbon cycle. So it follows the same hockey stick, as they are closely related.
The important thing to note when discussing the Ruddiman hypothesis is his admitted "fatal flaw". He fully admits that the so called "tortoise carbon release" measured is actually larger than his projected effects from human agriculture. Instead of following the concave curve of population growth (and thus the extent of agriculture in populations using agriculture), the release is far larger, earlier and more convex shaped. Ruddiman's "fatal flaw" though is resolved by by factoring in the evidence from Retallack and Sandom. ie the effect the extirpation and extinction of the megafauna by man and the effect that had on the grasslands ecosystems, all of which preceeded agriculture.
In addressing Tom as you requested: In general I have no problems with his rebuttal actually. His arguments are generally sound and I accept his sources. Excepting his measurements include highly degraded ecosystems found now and not even close to what they were before human impact. Not allowing for that change is where his rebuttal fails to actually disprove soil source for AGW hypothesis. In discussing Ruddiman, Tom fails to acknowledge the "fatal flaw" in Ruddiman's hypothesis, unlike Ruddiman himself. Tom actually uses the "fatal flaw" to argue against Teague! Instead of using them to counter each other, it is far better to combine their separate lines of inquiry, each explaining the flaws still present in the other when viewed alone. The evidence and context of all the sources combined into a new systems science synthesis paints a much clearer picture. That is the synthesis I am trying to get at here.
-
sauerj at 11:03 AM on 20 April 2015Shell: internal carbon pricing and the limits of big oil company action on climate
Good Article! ... If I understand right, the $40/tonne-CO2 shadow tax only applies to the CO2 emitted by Shell in the extraction process, not for the CO2 emitted by combusting the product itself.
If true, then the $40/tonne only amounts to $1.69/barrel of crude [math: $40/tonne CO2 x 0.317tonne CO2/barrel_crude(per internet) x 80mmtCO2/600mmtCO2 = $1.69/barrel ... where the (80extraction CO2/600total CO2) ratio comes from data in this article]. If this is all true, the $1.69/barrel is not nearly enough to sway a project's evaluation.
I believe this is point of this article: That, if instead, the shadow tax ALSO included the combustion CO2, then the $/barrel would be 600/80X higher, or $12.7/barrel. Still a bit low. I'm guessing that the real pay-forward/cultural change impacting cost would probably be above $20/barrel.
However, I suppose, even this higher $12.7/barrel "adder" would still fail to influence potential projects (at least for projects involving only FF's), as the $12.7/barrel "adder" would be an equal "adder" on all FF projects, since, in general, all FF's have the near same CO2 combustion/kJ ratio. Now, if non-FF projects were thrown in the project evaluation mix (thus adding to Shell's energy portfolio diversity), then this $12.7/barrel "adder" would then have a lot of sway. ... Again, this is probably what the article is ultimately saying. Thanks! ... GHU!
-
scaddenp at 09:50 AM on 20 April 2015There's no empirical evidence
It may have C13 profile that is closer to FF, but I fail to see how even soils from several millenia can have same C14 profile (ie zero) as FF. Are you implying that mass numbers quoted by you so far are only for for deep SOC? (I dont think so) and what evidence you have that there is a substantial contribution of deep soil carbon (the hardest to lose). I would also be interested in your response to points made by Tom.
-
RedBaron at 09:07 AM on 20 April 2015There's no empirical evidence
Scaddenp,
Please keep in mind that I am making a clear distinction between "recalcitrant" SOM and "labile" SOM. The SOM isotope profile in the O-horizon is not much different than that found in living vegetation, having a turnover in the carbon cycle measured usually in decades or less and never much more than a couple hundred years unless locked in permafrost. The SOM deep in the A-horizon is very different, often lasting for millenia in a very stable form (unless disturbed), and has a very similar isotope profile as fossil fuels.
-
Tristan at 08:13 AM on 20 April 2015The Scientific Guide to Global Warming Skepticism
Skeptical Science is a strong brand - has there been any discussion related to using the framework and name for other areas in need of science communication (I'm thinking vaccines and GMOs for starters)?
-
scaddenp at 08:08 AM on 20 April 2015There's no empirical evidence
RedBaron, any theory that tries to explain the net increase in CO2 from soil degradation also needs to explain the carbon isotope D13 and D14 ratios in the atmosphere which fit accurately with fossil fuel source (eg see here and here which also accounts for spatial distribution).
-
wili at 06:24 AM on 20 April 20152015 SkS Weekly News Roundup #16B
Thanks for another great roundup.
Minor point--the second title "'3D Cryosat' tracks Arctic winter sea ic" is missing the final 'e.'
Something to consider for inclusion in the next roundup:
Russian Ecologists Warn Summer Could See Repeat of Devastating 2010 Wildfires – or Worse
Moderator Response:[JH] The missing "e" has been inserted. Thank you for pointing this out and for the positive feedback.
-
RedBaron at 04:40 AM on 20 April 2015There's no empirical evidence
MA Rodger and Tristan,
Both of you are correct, but only if that ~300 GtC emissions pior to 1850 that Ruddiman discusses[1] is not included. The Retallack paleosoil evidence[2] even adds a causal relationship as opposed to simple correlation. The Teague evidence [3] confirming both the ecosystem services and pointing one way that information can be put to use for mitigation.[4]
Just to sum up, the biggest mistake is in ignoring the soils[5], both as a cause and as a solution.
Moderator Response:[JH] You are now skating on the thin ice of excessive repitition which is prohibited by the SkS Comments Policy.
Please note that posting comments here at SkS is a privilege, not a right. This privilege can be rescinded if the posting individual treats adherence to the Comments Policy as optional, rather than the mandatory condition of participating in this online forum.
Please take the time to review the policy and ensure future comments are in full compliance with it. Thanks for your understanding and compliance in this matter.
-
2015 SkS Weekly News Roundup #16B
Finally pulled myself together and finished the Norwegian translation of "It's not bad"!
-
MA Rodger at 03:30 AM on 20 April 2015There's no empirical evidence
RedBaron @255.
So we are effectively back to your input @217.
"The hocky stick isn't fossil fuel emissions, it's agricultural degradation of the soils, particularly carbon. Sure emissions also help somewhat, but even without a single fossil fuel drop, degrade the ecosystem services and we get global warming. It is us doing the harm, so it is AGW. But you guys are looking at the wrong source. Here is your evidence:-"
But the evidence you have provided for soils being the overwhelming source of CO2 emissions, right from the start with a National Geopgraphic article, all the way to here and now, is wholly insufficient to support your radical assertions. Of your most recent citations @250, Ruddiman is silent on this and the LiveScience article ditto. @249, Sait makes only unsupported assertions. I did not find anything worthy of further consideration with Retallack or Teague or Savoury. Indeed, @247 I concluded "I see no evidence that Houghton and others are in error over CO2 emissions from land use." Nothing has changed. There is no evidence to suggest soils are a major CO2 source, let alone being the major source as you are arguing.
-
WheelsOC at 03:21 AM on 20 April 20152015 SkS Weekly News Roundup #16B
RE: Climate plans put world on track for warming above agreed limits
The Climate Action Tracker (CAT), compiled by scientists, said pledges so far put the world on track for average temperatures in the year 2100 three to four degrees Celsius (5.4 to 7.2 degrees Fahrenheit) higher than they were in pre-industrial time. That is well above a U.N. goal of a maximum 2 degrees C (3.6F) rise.
All I can think of is Marcott's Wheelchair.

-
Tristan at 01:42 AM on 20 April 2015There's no empirical evidence
I'll just point out, that the notion of 'reversing' climate change doesn't really make sense anyway. What matters is limiting the rate of change. Once it has changed, it's changed, and the bits of the ecosystem/society that can't adapt will break. At that point, there probably isn't that much to gain by trying to force the ppm back down (not that that seems plausible right now).
-
RedBaron at 01:20 AM on 20 April 2015There's no empirical evidence
MA Rodger,
Would it be fair to say that if you skip the emissions caused by the loss of ecosystem services, it would then bias your analysis of what could be done by restoring ecosystem services? After all, if your main focus is fossil fuel emissions, then the main focus for mitigation would also be fossil fuel emissions. The whole effect of soil sequestration of CO2 glaringly omitted both as a major cause and as a potential major mitigation strategy.
Now don't get me wrong. I am hugely in favor of alternative energy. At some point that will have to happen anyway, but the more pressing issue is restoring ecosystem services to about 1/2 the planet's land surface. It is the only possible strategy with any hope at all of working. Even going to 0% emissions tomorrow by the entire world will not reverse AGW for hundreds if not thousands of years......unless the ecosystems capability to sequester that carbon is restored. Even more importantly, that ecosystem service is potentially large enough to mitigate fossil fuel emissions even without taking them to 0%.
-
2015 SkS Weekly News Roundup #16B
#1:
Done!
-
michael sweet at 21:04 PM on 19 April 20152015 SkS Weekly News Roundup #16B
Chriskoz,
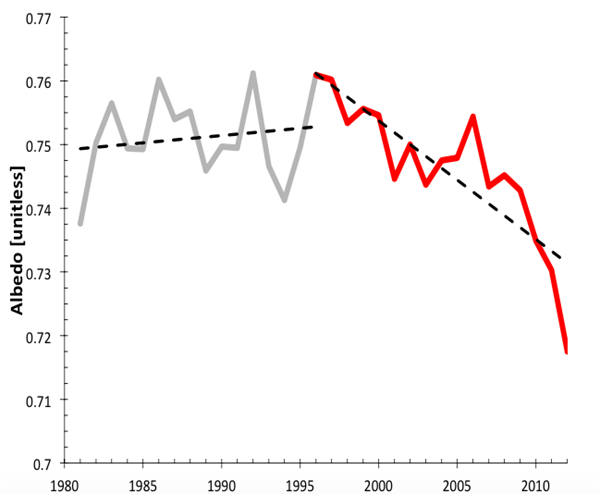
The data in the graph you do not like goes back to 1980. That is likely the start of the satelite data. It generally is not cherry picking when you show all the data. If you do not like their fitted line you are welcome to draw your own. It is obvious that most of the change has taken place in the last ten years. The article in CB discusses the 2014 data and links the data. I presume the 2014 data was not included in the paper because it was not available when the paper was written. Your dismissal of a paper without reading it because you do not like the way they worked up the data is unsupported.
-
chriskoz at 20:45 PM on 19 April 20152015 SkS Weekly News Roundup #16B
About the new research by Marco Tedesco - "Darkening ice speeds up Greenland melt" on CB.
I don't have access to the actual article refered only as Tedesco et al. 2015 - apparently only submitted, not accepted yet.
But the albedo timeline graph, as presented by CB, suffers from cherry-picked point (1996) to show the apparent trendline change in albedo so that it looks more "alarming". That's the same type of deception science deniers use to point out that "it hasn't warmed since 19xx" and debunked by the escalator.
The main fallacy the deniers' method is that when you want to show the change of trends in a signal, you have to draw the trend lines so that the lines are continuous - the are not "steps" between their ends. Otherwise your trend changes are escalator-like bunkum. For that reason, I would not accept Tedesco et al. 2015 if I was reviewing it. Hopefully reviewers will be helpful there and let Marco fix this mistake in this article on an interesting subject.
-
MA Rodger at 19:54 PM on 19 April 2015There's no empirical evidence
RedBaron @254.
The references I linked to @253 consider FF emissions from 1751-2010 and "The contribution of LULCC to anthropogenic carbon emissions were about 33% of total emissions over the last 150yr (Houghton, 1999)". So, no, the emissions argued by Bill Ridduman are not included.
-
Leto at 19:16 PM on 19 April 20152015 SkS Weekly News Roundup #16B
Some of you may be familiar with the latest antics of Tony Abbott, the Australian PM. He is giving 4 million dollars to the discredited climate contrarian Lomborg.
If you think this is a bad idea, please sign the petition:
-
RedBaron at 19:13 PM on 19 April 2015There's no empirical evidence
MA Rodger,
Are you including the ~300 GtC emissions before 1850 that Ruddiman discusses or the lack of decline added on even to that seen in previous glacial cycles?
-
MA Rodger at 18:41 PM on 19 April 2015There's no empirical evidence
Red Baron @250.
Firstly I am sorry that I missed seeing your reply until now.
I must say that I am not a fan of somebody pointing me at a 20 minute U-Tube video. If somebody cannot condense their argument into something shorter (I was taught anything that doesn't fit on a side of A4) it almost always means they don't then understand the argument being presented. Sait, of course has a simple argument that has been expanded to fit the TED format. Strangely, I see nothing shorter available, rather just a longer one (that I haven't bothered with).There is much evidence within this talk by Sait that says he is no expert. He is wrong to say that 50% of anthropogenic CO2 emissions presently end up in the oceans. It is lower, perhaps 35%. He is wrong to suggest that CO2 becomes carbonic acid in water. Most of this CO2 simply remains as absorbed CO2. (To be entirely correct, it is overwhelmingly the bicarbonate resulting from the CO2 that causes the acidity.) Acidification resulting from the additional CO2 has not reached 30%, whatever that is supposed to mean.
I do not find such errors encouraging when so much else needs to be said but which is ignored.Sait's central assertion that 250Gt(C) has been emitted by fossil fuels (and breathing??!!!) while 467 Gt(C) has been released from humus is not supported by any evidence. Indeed, the figure from CIDAC give FF emissions to 2010 as 365 Gt(C) with roughly 50% extra from changing land use (ie 185 Gt(C)) according to Houghton et al (2012) which mostly is accounted by deforestation. Thus CO2 emissions to 2010 not involving humus are considered to amount to 550 Gt(C), over twice the figure asserted by Sait. He offers not support for his assertion. Until he does, his words remain unconvincing. These talks by Sait are a bit old now. The continued silence is very telling.
-
RedBaron at 17:05 PM on 19 April 2015There's no empirical evidence
Ok I see no comment, but I would like to present some actual evidence and analysis from a completely different source than Retallack, Savory, or Sait. These two from Bill Ruddiman and Chris Sandom respectively:
THE ANTHROPOGENIC GREENHOUSE ERA BEGAN THOUSANDS OF YEARS AGO
Humans Blamed for Extinction of Mammoths, Mastodons & Giant Sloths
The interesting thing to me is that these widely separate lines of investigation, from modern agricultural practices to ancient human impacts to paleosoils all are slowly converging on the idea that soils as part of a whole ecosystem have a much larger impact on the ecosystem services than previously thought. Particularly the ecosystem services of climate control and the carbon cycle. Namely I hypothesize the AGW effects we are seeing now are actually primarily the result of multiple trophic cascades caused by the spread of mankind and then the rise of civilization. Further, I hypothesize that fossil fuel emissions are a problem primarily due to the ecosystem service of carbon sequestration into the soils was already severely damaged, first by the megafauna extinctions, and then by agriculture, both man made. These diverse lines of inquiry are not completed into a fully developed synthesis as of yet, but I am convinced this is the right track not only in better understanding the atmosperic CO2 levels, but also how to reverse them.
-
uncletimrob at 13:12 PM on 19 April 2015The Rise of Skeptical Science
Thanks! John, you touched on some very inmportant issues that educators face, in particular the lack of a "filter" that distiguishes between actual science and pseudo science. I believe you are correct in that this is in part because real science is "hard" and pseudo science is often couched in language that is easy to digest. SS breaks through the "hard" barrier very well, with easy to understand graphics and language that an interested High School student can understand. And, I have to say that many of the students I come in contact with ARE interested in global warming/climate change (despite that my area is Mathematics - although I have taught Physics in the past).
-
denisaf at 08:59 AM on 19 April 2015New Video: The Trouble at Totten Glacier
It is ironic that humans devised the means of irreversibly using up limited crustal stocks of fossil fuels to provide physical energy with the unintended consequence of causing irreversible rapid climate change. So now we have problems of the kind discussed here while we are losing the physical capability to address them. Oil is running out so fuel for aircraft will be posing a problem that will impinge on studies of what is happening in Antarctica and elsewhere.
-
gorm raabo larsen at 07:55 AM on 19 April 2015The Rise of Skeptical Science
... excellent... and very important... thank you very much !
-
Leto at 19:01 PM on 18 April 20152015 SkS Weekly Digest #15
I'm hoping it is okay to post something slightly off-topic...
I googled for 'real climate' because the PC I was on did not have the Real Climate page bookmarked, and was somewhat surprised to see this as the third link in the Google results:
http://thefederalist.com/2015/04/17/what-it-would-take-to-prove-global-warming/
The material at the end of the link is obviously thoughtless denialist nonsense, but the question is: why it is so highly ranked in Google? Is thefederalist.com doing some dodgy search engine optimisation (SEO), or is Google giving this site more profile than it deserves?
If there are are dodgy SEO tactics being employed, I will complain directly to Google, who usually respond to such complaints by re-ranking the dodgy site.
If it is Google who is pedalling this nonsense, a different response is appropriate.
Hoping some of you have some insights.
Cheers,
Leto.
-
PluviAL at 03:20 AM on 18 April 2015Western Canada’s glaciers could shrink by as much as 95% by 2100, study finds
@1, 2, 3: Yes, it makes it look as if we are at a precipice. But maybe we are, and this just depicts it graphically. We are aware of the potentail abyss from other works, this may just show how close we are. But you are right, that should have been the point of the article.
-
One Planet Only Forever at 23:59 PM on 17 April 2015Western Canada’s glaciers could shrink by as much as 95% by 2100, study finds
The graphic presentations could have been less questionable if they had included the line of multi-year averages through the historical values. And it may have been helpful to include values prior to 1980 even if they were from a less precise information source or evaluation.
The model forecast will be a multi-year average trend line. Models are not set up to predict the rather random yearly variability of the systems they model. That would be a waste of time and effort.
The forecast average line will look 'out of line' with the jagged annual historical data line, especially when the most recent annual line was going up (as is the case with this report).
A clearer way to present this would be to have the average line through the historical data presented by a line matching the intensity of the forecast line, with the annual jagged line being a less intense background-style presentation.
-
CBDunkerson at 21:30 PM on 17 April 2015BEST Results Consistent with Human-Caused Global Warming
qinqo, my take on Muller is that he bought in to the whole 'climate change is a hoax' mythology hook line and sinker, but had enough integrity to acknowledge when his own research disproved (again, past research had done so before he ever started) one of those lies. Unfortunately, the same failures of logic and character which led him to buy into complete nonsense in the first place have also prevented him from thinking, 'Gee, I just made a fool of myself... maybe I should re-evaluate some of this stuff'... and thus he continues to make completely ridiculous claims on other aspects of the global warming 'debate'.
Basically, if he has done research he'll go with what his data shows, but if he hasn't done the research he'll go with the 'skeptic' misinformation. It seems like he may think he is the only competent scientist on the planet... because he places the blog rantings of 'skeptics' above peer-reviewed research from the scientific community.
-
qinqo at 09:56 AM on 17 April 2015BEST Results Consistent with Human-Caused Global Warming
What am I to make about this guy Muller? To me he seems really inconsistent. Unless you take into account that he is often promoting natural gas and fracking. (before and after his 'conversion')
He still uses his 'old ways' sometimes to diminish AGW, even after claiming that he is certain AGW is real. Why then is he still advocating the use of a fossil fuel? Even a method shown to be really devastating to earth's climate.
One of the things that got me convinced that he is shady is his claim that 'hide the decline' is a reference to temperatures. This was a while after when the investigation of the scientists took place. It seems to me that he might be a covert shill for natural gas. The 'conversion' study was sponsored by Koch. He seems to be balancing on a tightrope.
The study accomplished two things:
1. Good for 'skeptical' public: there is a new independent study acknowledging antropogenic global warming. Deniers will have a hard time denying this. True skeptics in the general public will be more inclined to taking AGW serious.
2. Good for Koch: there is a new 'trustworthy' scientist risen, who in order to curb global warming, is advocating the burning of Natural Gas and the 'clean' technique of fracking. Natural gas containing 80% methane. Methane: stays not as long in the atmosphere as CO2, but does have a greater greenhouse effect.
What am I to make of this? Can someone explain why natural gas is a better solution than renewables. Muller seems to think it is the only real affordable option we have. Renewables are as of now too expensive. (what about nuclear energy?)
-
uncletimrob at 06:24 AM on 17 April 2015Western Canada’s glaciers could shrink by as much as 95% by 2100, study finds
Yes, I wondered about the abrupt changes as well. Perhaps someone more knowledgable can explain them, as the article doesnt really do so.
-
Infopath at 03:35 AM on 17 April 2015Global warming hiatus explained and it's not good news
Tom @44,
Thanks for expanding on that.
"His dragging out that old misattribution to Einstein rather proves that point."
That's what I thought too.
Funny how Einstein would have preferred "theory of invariance" (absolute — speed of light), rather than relativity... beautiful.
-
ianw01 at 01:57 AM on 17 April 2015Western Canada’s glaciers could shrink by as much as 95% by 2100, study finds
Those abrupt changes in slope between past and projected trends do not make these projections look particularly credible, particularly for the Interior. I wonder what step change the models have happening at the present moment?
Intuitively, I would expect the future shape may look more like the increasing slope of current actic sea ice plots.
-
bozzza at 18:24 PM on 16 April 2015Global warming hiatus explained and it's not good news
@ 36 @ Rob P: To summarise, does this mean EKMAN SUCTION Ekman Suction is the concept of "Flotation" in action?
Moderator Response:[JH] The use of "all caps" comnstitutes shouting and is prohibited by the SkS Comments Policy.
-
Tom Curtis at 15:08 PM on 16 April 2015Global warming hiatus explained and it's not good news
Infopath @42:
"Everything is relative," as the pop version of Einstein's theory goes. Not so. That statement, for instance, is absolutely wrong. The scope of special relativity is rather more narrow. It concerns only very special situations, very special observers, very special questions of relativity and absoluteness."
"Albert Einstein was unhappy about the name "theory of relativity". He preferred "theory of invariance". The reason is that [one] cornerstone of his 1905 theory of relativity is that the measured velocity of light is the same (invariant) regardless of any relative motion between a laboratory and the source of light. What Einstein feared came to pass when the popular catchphrase of his theory became "everything is relative." It was snatched up by people not acquainted with the scientific context, who regarded the theory as evidence in support of their own social views."
See also here.
I consider it irrelevant whether or not Carson is technically a scientist (ie, has a PhD in a scientific discipline and/or has published in the peer reviewed scientific literature). His views on this topic, and on global warming in general are clearly not scientific views. Rather, they are pseudo-science. His dragging out that old misattribution to Einstein rather proves that point.
-
Glenn Tamblyn at 13:56 PM on 16 April 2015Global warming hiatus explained and it's not good news
Peter.
From the first link scadenp gave you
"To a certain degree, Eastern Boundary Current (EBC) ecosystems are similar: Cold bottom water from moderate depths, rich in nutrients, is transported to the euphotic zone by a combination of trade winds, Coriolis force and Ekman transport. The resultant high primary production fuels a rich secondary production in the upper pelagic and nearshore zones, but where O2 exchange is restricted, it creates oxygen minimum zones (OMZs) at shelf and upper slope (Humboldt and Benguela Current) or slope depths (California Current). These hypoxic zones host a specifically adapted, small macro- and meiofauna together with giant sulphur bacteria that use nitrate to oxydise H2S"
So, "This can only occur, in this area remote from human influence, from undersea volcanic activity."
Nope, you assumption is wrong. There is another major source, anaerobic sulphur bacteria that thrive in anoxic conditions!
Volcanic activity isn't the only source of H2S! Simply assuming that it is is sloppy reasoning. If ou want to evaluate an idea you need to consider geological evidence, oceanographic/hydrological and fluid mechanics evidence, and biological evidence.
==========================================
And..."Could it be that warmer water rises?"
Only if it is warmer than the water above it! If cold water is warmed but not enough to make it warmer than the water above, it doesn't rise. Example. If water at 4 Deg C is warmed to 6 deg C it can't rise if the water above it is 20 deg C.
So how much warming?
Peter, unquantitative arguments are worthless.
-
Infopath at 11:43 AM on 16 April 2015Global warming hiatus explained and it's not good news
Peter Carson@30: "(Wasn't it Einstein who said all things are relative?)"
Uh... no, I don't think he did. Do you have a reference/link?
(Sorry, OT but couldn't resist (feel free to delete).)
Prev 624 625 626 627 628 629 630 631 632 633 634 635 636 637 638 639 Next


![[5]](http://www.grida.no/graphicslib/thumbs/1805c933-493c-4b85-be16-ad06eb342332/medium/degraded-soils_c4c4.jpg)