


 Arguments


Recent Comments
Prev 626 627 628 629 630 631 632 633 634 635 636 637 638 639 640 641 Next
Comments 31651 to 31700:
-
Composer99 at 03:07 AM on 14 April 2015Andy Lacis responds to Steve Koonin
Some housekeeping may be required, as this article is breaking the formatting of other posts on the main page (no doubt due to the preview ending in a block quote).
-
CBDunkerson at 02:46 AM on 14 April 2015Andy Lacis responds to Steve Koonin
"They should also pay attention to the geological record that points to an atmospheric CO2 level of 450 ppm as being incompatible with polar ice caps..."
That figure seems much too low. 450 ppm is the most common 'target limit' to avoid the worst impacts of AGW, but I've never seen a claim that we'd eventually lose the ice caps and have corresponding 70 meter sea level rise at 450 ppm.
-
billthefrog at 23:06 PM on 13 April 20152015 SkS Weekly News Roundup #15B
"... usual media hyperbole is beginning to come down on the pro AGW side"
I do love the term "pro AGW", as if it is something that many people would actually want to see happening. In common with many people, I think there is a causative relationship between ozone depletion and melanoma incidence rate. That doesn't mean I'm "pro CFCs", or that I'm "anti the Montreal Protocol".
Terms such as "pro democracy" or "pro equal rights" do tend to convey the correct impression, but "pro AGW", I rather think not.
If you are genuinely concerned about perceived press bias, it might be educational for you to have a look at the article John Mason wrote a few weeks ago concerning the reporting of certain climate/weather related events.
cheers bill f
Moderator Response:[JH] "Pro AGW" is typically shorthand for "pro AGW science".
I also presume that your admonition is directed to the journalist who wrote the article. If so, you should post your concerns on the comment thread of the article as posted on the Los Angeles Times website.
-
CBDunkerson at 22:01 PM on 13 April 20152015 SkS Weekly News Roundup #15B
mjp, the article clearly states;
"California has seen droughts before with less rainfall..."
How does that constitute 'sidestepping' the severity of past droughts?
You cite the headline, but it doesn't say anything about precipitation or 'drought' in general. It says that heat records have been broken. Which is true.
-
scaddenp at 13:37 PM on 13 April 2015Global warming hiatus explained and it's not good news
amhartley - I dont immediately find McGregor's source but I think you can guess it's context. You are usually interested in heat capacity in terms storage of added energy. Add energy to earth (eg increased solar output or additional GW), then the heat capacity of earth is going store energy, slowing the temperature rise. Warming from solar doesnt penetrate far into land - a few meters (ask horizontal ground source heat pump installers). Sea is different with deeper penetration but more importantly convection carries heat deeper and heat capacity is huge. Atmospheric storage is pretty minimal.
-
chriskoz at 12:33 PM on 13 April 2015Global warming hiatus explained and it's not good news
scaddenp@14, Tom@16,19
Your discussion belongs to Underwater volcanoes are warming the oceans. I went there to check what SkS has to say about your last sentences (thermal insulation of the ocean depths and thermal gradient of ocean warming vs. volanic/geotermal heat) & sadly, I found this very would be useful article is empty! What happened to it?
If it's lost it should be brought back. Some mod could check it...
Otherwise it should be filled in with the results of your discussion, together with the references Tom had provided. That article is important to debunk the claims like that by Peter Carson. Anyone wants to do that?
Moderator Response:[DB] That's a topic article stub, earmarked for a future piece.
-
mjp at 12:19 PM on 13 April 20152015 SkS Weekly News Roundup #15B
The completely rational story for the California drought is that worse droughts have occurred in the deep past and are possible in the future, but a warming climate will make a recurrence of similar circumstances worse in the future. Bit of a mouthful, I know.
When used in the context of the drought I find it unhelpful to see headlines like "California's new era of heat destroys all previous records".
Denial arguments play on the science papers that show worse droughts have occurred in the past. When science based articles appear to sidestep and not acknowledge that, it appears that the science is being deceptive. Doesn't help.
But this is mainstream media. I guess the upside is that usual media hyperbole is beginning to come down on the pro AGW side.
-
amhartley at 11:16 AM on 13 April 2015Global warming hiatus explained and it's not good news
"About 97 per cent of all the heat capacity of the Earth is in the ocean — that's where all the energy gets stored."
Is that accurate? Should a qualifier accompany that 97%? For instance, is the denominator the earth's heat capacity within, say, 10km of the surface?
-
Tom Curtis at 09:04 AM on 13 April 2015Models are unreliable
Tom Dayton @860, that Hotwhopper article is pretty damning of Roy Spencer's choices. What it does not mention was that 1983 was massively effected by the El Chichon volcano (which shows up the models), but that the effect in observed temperatures was cancelled, or more than cancelled by the 1983 El Nino in the observational record, which by some measures was stronger than the 1998 El Nino:
As ENSO fluctuations are random in time in the models, they do not coincide with observed fluctuations. The consequence is that while the volcanic signal was obscured in the observations, it was not in the models and the discrepancy between models and observations in 1983 was not coincidence. Nor was the greater relative temperature in UAH relative to HadCRUT4, as satellite temperature indexes respond more strongly to ENSO.
Spencer knows these facts. Therefore, his arbitrary choice of 1983 as the baseline year must coint as deliberate deception. He is knowingly lying with the data.
-
scaddenp at 08:47 AM on 13 April 2015Global warming hiatus explained and it's not good news
Tom, I have just got to stop doing this when I get out of bed! You are correct of course.
-
Timothy Chase at 08:43 AM on 13 April 20152015 SkS Weekly News Roundup #15B
Although the Bloomberg California heat chart does not appear in the tech paper, at least with respect to the unprecedented nature of the current drought, the Bloomberg article appears to going off of:
... the 2012–2014 drought stands out in the context of the last millennium. In terms of cumulative severity, it is the worst drought on record (−14.55 cumulative PDSI),more extreme than longer (4 to 9 year) droughts. Considering only drought episodes defined by at least three consecutive years all lower than −2 PDSI, only three such events occur in the last 1200 years, and 2012–2014 is the most severe of these."
Open Access: Griffin, Daniel, and Kevin J. Anchukaitis. "How unusual is the 2012–2014 California drought?." Geophysical Research Letters (2014).
http://onlinelibrary.wiley.com/doi/10.1002/2014GL062433/epdf The tech article makes clear that the reduced precipitation is by no means unprecedented, but over the past three years the higher temperatures have resulted in higher rates of evaporation that have amplified the drought such that cummulative drought severity has been unprecedented. -
Tom Curtis at 08:39 AM on 13 April 2015Global warming hiatus explained and it's not good news
scaddenp @18:
"Argh! Dont attempt this stuff when you are in massive hurry and barely awake."
I know the feeling, and good advise ;)
Running through the calculation, and using your figures we have:
3 x 10^23 Joules / 0.84 Jouls/Kelvin.gramme = 3.57 x 10^23 Kelvin.grammes
3.57 x 10^23 Kelvin.grammes/ 2790 Kelvin = 1.28 x 10^20 grammes
1.28 x 10^20 grammes / 3 grammes/cm^3 = 4.267 x 10^19 cm^3
4.267 x 10^19 cm^3 /10^15 cm^3/km^3 = 4,267 km^3 of basalt cooled from "melting point" to 10 C to generate the release the amount of energy accumulated in the ocean. That in turn works out at approx 97 km^3 per annum. That compares to the 30 km/annum estimated deposited magma globally.
You will notice the major difference between my and your working is that I divide by temperature rather than multiply, the division being necessary to get the correct units.
As an estimate, the 3800 K magma temperature is absurdly high relative to recognized values (which are closer to 1300 K from wikipedia, National Geographic, and a couple of scientific articles I read). However, you did not include the heat of fusion, nor the difference in heat capacity between magma and basalt.
Using the values from the worked example @16, we would need an additional flow of 50,025 km^3 of magma at the ocean floor (ie, not mere crust formation) to account for the increase in OHC since 1970. Even that, however, would not account for the problem of thermal insulation of the ocean depths, nor why the thermal gradient cools with depth rather than warms with depth as would be required if the major source of surface ocean heat was from the ocean floor.
-
Phil at 07:57 AM on 13 April 2015Models are unreliable
Rhoowl:
Phil computers do have rounding errors, iteration problems with real numbers.
Indeed they do, which is why careful climate modeller programmers analyse their programs to ensure such errors are restricted, and the models (or their component parts) are tested to ensure they do not exert a undue influence. That they do would be obvious - a modelling program that produces results that are unduely influenced by rounding errors would give widely different results with very small changes to the input.
Input has fudge factors. I use fudge factors all the time when modeling. I enter objects that can't possibly exist just to make the program work...
Whatever you may do, it does not follow that climate modellers do it too. -
scaddenp at 05:54 AM on 13 April 2015Global warming hiatus explained and it's not good news
Argh! Dont attempt this stuff when you are in massive hurry and barely awake. I had 30E22 in head from look at OHC graph and transcribed it to exponent too. However, I didnt make typo entering into calculator and 3E11 is still the cubic kilometers. As Tom said, this has to be very thin to transfer that much energy to ocean. The main point stands: it is totally unrealistic to blame undersea volcanoes for GW.
-
Rhoowl at 03:09 AM on 13 April 2015Models are unreliable
Jh I wish to reply to your comment and since it is off topic and is more personal in nature we should do this privately. My email is rhoowl at yahoo
Moderator Response:[JH] Your request has been duly noted.
-
Tom Dayton at 02:54 AM on 13 April 2015Models are unreliable
Rhoowl: Your reply to my comment was not on the topic I had explained--differences between models. Since you either will not or cannot focus on a topic long enough to have an actual conversation, I'm giving up on you.
-
saileshrao at 02:53 AM on 13 April 2015The history of emissions and the Great Acceleration
Thanks, sidd and andyskuce.
Howard Lee indicates that would be 340 Gt of Carbon, not CO2, for land use changes from prehistoric times to pre-industrial times.
As such, cumulatively, land use change dwarfs all the other contributors, which bodes well for the potential of land use changes to drawdown CO2 in the near future, if we put our hearts and minds to it. -
Tom Dayton at 02:49 AM on 13 April 2015Models are unreliable
Rhoowl: Spencer followed up his claim that you linked, with another claim this time about "90 models" but likewise severely flawed. Hotwhopper clearly explained Spencer's biggest...um, "mistake"...of playing loose and fast with baselines. There is also the issue of Spencer falsely giving the impression that the RSS and UAH satellite trends for the tropics are consistent, when in fact UAH for the tropics is three times lower trend than RSS, and recently RSS has been shown to be correct in the tropics and UAH wrong.
-
billthefrog at 02:40 AM on 13 April 20152015 SkS Weekly News Roundup #15B
@ PC
Ah, you have unerringly spotted the fingerprint of the 66 year cycle, which proves that it was the PDO "wot dunnit".
-
PhilippeChantreau at 02:11 AM on 13 April 20152015 SkS Weekly News Roundup #15B
Here's a funny thought: if I was to use fake skeptic methods with the NOAA chart of California's temps, I would cherry-pick 1949 as starting point and calculate the "trend" to the present...
-
Rhoowl at 01:53 AM on 13 April 2015Models are unreliable
robp dr Roy spencer has also reviewed this his conclusion don't agree with you graph. Tristan dr spencer is a climate scientist.
http://www.drroyspencer.com/2013/06/epic-fail-73-climate-models-vs-observations-for-tropical-tropospheric-temperature/
Td I have already agreed that the scenarios spread was not an model error....there are errors in the models. I have also read the intermediate blog. What you pointed to as verification was reviewing past Enso from only 18 climate models. What About the other climate models. This appears to be a weak verification. He only matced the trend an not absolute values. I reviewed Steve easterbrook material. Much of what he professes is that science twist need to aek to the public in general terms so it is more understandible. Much of what he said didn't address the issues I am presenting.
leto I never claimed that the modelers do not have skill or infallibilty
Quite the opposite actually. The losing argument was started by someone else previously. Perhaps this was out of line.
Phil computers do have rounding errors, iteration problems with real numbers. Input has fudge factors. Is use fudge factors all the time when modeling. I enter objects that can't possibly exist just to make the program work...
after further reading about about the water co2 interaction it became clear that a grid resolution of 100km x 100km is too coarse to property model the cloud co2 interaction. The material is too anisotropic for that resolution. Zhou zhang bao and liu wrote a paper suggesting that grid resolution Be 1x1 mm. To properly model turbulence.. In the atmosphere. Obviously this would be an impossible task
Moderator Response:[JH] Either English is not your first language, or you do not take the time to proof read what you have keyed in prior to hitting the "Submit" button. Either way, parts of your comment are nonsensical. In addition, some of your statements insult the intelligence of other commenters. If you keep going down this path, your future postings may be summarily deleted.
-
billthefrog at 01:34 AM on 13 April 2015Global warming hiatus explained and it's not good news
3 x 1030 joules?????
As scaddenp refers to 3x10²³ J in comment #14, then 3x1030 J in #15, I think we can safely assume there has been a typo.
Unless, of course, there was a sudden increase in OHC of 2.9999997x1030 joules in the space of approximately 22 minutes. (In which case, I think we would have noticed.)
Glad to see I'm not the only one that does typos.
cheers bill f ;-)
-
Phil at 21:48 PM on 12 April 2015Models are unreliable
And two more ...
3. Hoffmann seems to think that global temperatures are inputs to GCM. This is just factually wrong
4. He makes the usual "denier" mistake of equating the atmospheric temperature record with the "global" temperature record (i.e he ignores 93% of the energy imbalance) -
Phil at 20:41 PM on 12 April 2015Models are unreliable
@851
The blog post by Dr Hoffmann is wrong in so many ways. Here are just two points from it.
1. The illustration of rounding errors in computer programs would only be relevant if the errors have a systematic bias (i.e. they all rounded up or all rounded down). As Hoffmann's output shows they don't; the rounding errors are randomly signed and therefore will tend to cancel each other out, both within an individual run and between runs.
2. The discussion about modelling individual molecules in the atmosphere/planet is ludicrous; bulk matter has well defined properties that can be determined experimentally and used in a model without recourse to modelling individual molecules. We didn't know, or model, the individual atoms of the Apollo 11 space rocket, but that didn't affect our ability to predict its behaviour.
-
grindupBaker at 17:13 PM on 12 April 2015The global warming 'pause' is more politics than science
Here's my analysis based on an LSQ fit to an RSS graph I saw on WUWT site (unclear to me whether they were saying it was Monckton or Knappenberger-Michaels LSQ fit):
1996/10-2014/10 = 0.0 degrees/century (18 years 1 mo. = 217 months)
WUWT Monckton(?) LSQ fit with comment <I paraphrase> exactly zero warming.
1999/02-2014/10 = 1.2 degrees/ century (15 years 9 mo. = 189 months)
*more recent* my well-estimated eyeballed fit *on the very same WUWT graph* for this later period.
Thus, Monckton (I think it is) shows clearly that "global warming" increased just 16 years ago.
Not only that but the fun part now: 1.2 degrees later warming trend / 0.0 degree earlier warming trend = infinity so the Monckton (?) analysis *shows an infinite increase of "global warming" just 16 years ago*.I'm like that other bunch, Monckton and that, I hugely prefer fun & games to actual work.
-
sidd at 12:58 PM on 12 April 2015The history of emissions and the Great Acceleration
In particular table 3 in ruddiman(2013) estimates 320-343 gigaton pre1850 carbon emissions
-
sidd at 12:42 PM on 12 April 2015The history of emissions and the Great Acceleration
sailesh rao asked:
"What is an estimate of the CO2 emissions due to land use changes from the start of the agricultural revolution, say 8000BC to 1750?"
See Ruddiman(2013) doi:10.1146/annurev-earth-050212-123944 or his recent book "Earth Transformed"
sidd
-
Leto at 09:44 AM on 12 April 2015Models are unreliable
Rhoowl wrote,
"you have to understand the the people who are writing and operating the programs for computer models are not climate scientists."
Producing a useful model of anything is 99% based on understanding the domain you are modelling, and 1% putting some code together. The idea that a non-climatologist who knows about programming is particularly well-positioned to comment on the success or otherwise of a climate model is nonsense. The idea that climate science has a lack of intelligent people versed in both the necessary domain knowledge and the coding skill is also nonsense. Sure, you mustn't assume that the climate modellers are infallible, but your starting assumption should be that the people trying to educate you on this site know much more about this than you or some programmer.
"btw..you only win the argument if you convince the other person that they are wrong."
This is probably the silliest comment I have ever read on this site. For a start, you are wrong if you see this exchange as a contest people are trying to win. The people responding to you are trying to educate you, and if you refuse to be educated that is a reflection on you, not on the validity of their responses. I see no evidence that anyone has failed to understand your points (which have all been discussed before anyway), but I see plenty of evidence that you have not actually stopped to consider what you are being told. Remainingly stubbornly ignorant and then calling that result a win or a draw is simply foolish.
-
Tom Curtis at 09:24 AM on 12 April 2015Global warming hiatus explained and it's not good news
scaddenp @15, I do not understand why you are using 3 x 10^30 Joules as your target, given that it is 10 million times the heat increase in the ocean since 1970.
Anyway, in trying to check your numbers I came across a worked example by Ass Prof Leslie Sonder at Dartmouth College. This area falls close enough to her area of specialization that I suspect she has made no blunders in the basic calculation, but am quite happy for others to point out blunders so that we can correct the example.
In any event, she calculates that 2 x 10^13 Kg per annum of new crust is formed by mid-oceanic ridges. That represents 6.67 x 10^9 cubic meters, or 6.67 cubic kilometers, or 22.23% of estimated global magmatic deposition.
She also calculates an energy release of 4 x 10^19 Joules per annum, or less than 0.008% of the average annual energy accumulation in the ocean since 1970.
Several things should be noted about this. First, the magma deposition as new crust of a given year does not all occur at the center of the mid-ocean ridge. Rather, extrusion form pillow basalts at the surface (0.5 km thick according to wikipedia), which because they cooled in water, cool rapidly. Below that, however, are sheeted dike complexes (1.5 km thick) which cool beneath the layer of pillowed basalt, and hence slowly. Beneath that again are Gabbro and layered ultramafic rocks (5 km thick) which, because of its depth below the sea floor, cools very slowly. The process of formation appears like this:

(Source)
Because the vast majority of the solidified magma is not at the surface, it cools slowly releasing its heat gradually over time. This does not mean less heat is released in any given year, because heat is still be ing released from previous years. It does mean the heat is not all released at the center of the mid-ocean ridge by volcanism. The vast majority of it is released later by diffusion through the sea floor. Hence the wide bands of increased geothermal heat surrounding each mid-ocean ridge.
It also means that the majority of the rock does not cool to abyssal water temperatures. Indeed, the rock immediately above the mantle is near the melting point of the rock, with temperatures declining approximately linearly as it approaches the ocean floor. In other words, Sonder's estimate is likely an over estimate. Put another way, 0.008% of recent annual OHC increase is an upper limit of the heat released by cooling magmas at the mid-oceanic ridges. Further, the process of that release ensures that it is near constant over time so that it cannot be a significant contributor to any change in OHC.
-
Andy Skuce at 09:08 AM on 12 April 2015The history of emissions and the Great Acceleration
eksommer @18
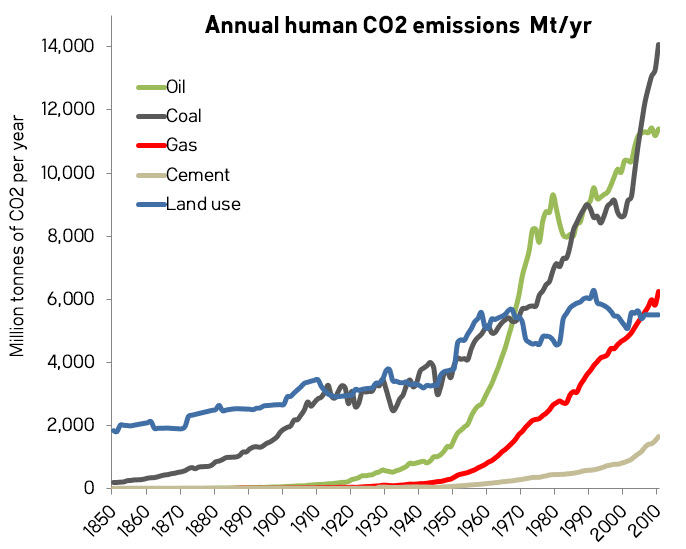
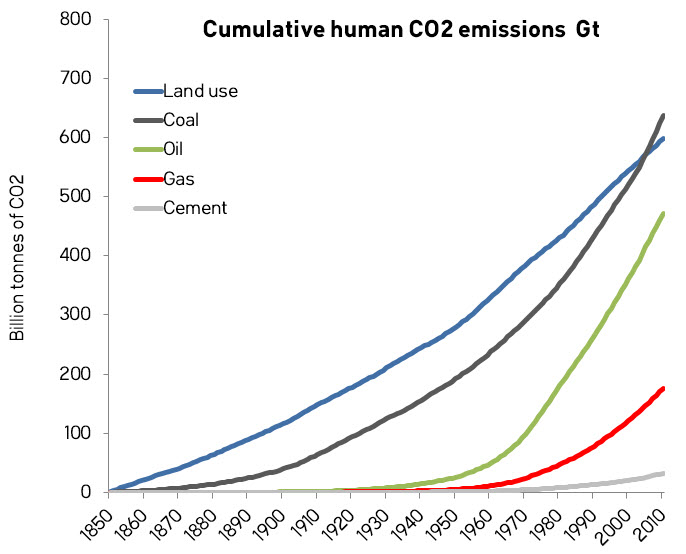
You are correct that stacked graphs can be misleading. So, here are annual emissions and cumulative emissions graphs, unstacked. There are things that jump out of these graphs that are not obvious in the ones I presented. Thanks for the suggestion.
-
Andy Skuce at 09:02 AM on 12 April 2015The history of emissions and the Great Acceleration
mdenison @19
Here is a plot showing year-to-year changes in the emissions rates. The blue line jumps around a lot, so I applied a 10 year trailing filter (ie, the 2010 figure is the average of 2001 to 2010).

There seems to be a jump after about 1950 where the annual rate of increase in emissions is roughly 400-500 million tonnes of CO2 per year. Before 1950, the change was 0-200, roughly speaking. I think that's a real step change.
Now, you might argue that what matters is not the actual growth rate but the percentage rate of growth, You would be right, an economy growing steadily at 2% per year would grow faster in dollar terms the bigger it got.
Let's look at some curve fits, before and after 1950.

I fitted an exponential curve to emissions between 1850 and 1950 and extrapolated it to 2010. I think it's obvious that this would have under estimated growth in emissions for the next 60 years. The last curve in my post showed a linear rather than exponential extrapolation, which assumption, you are right, did exaggerate the effect of the Great Acceleration. But I think it's clear that the Great Acceleration is still a real phenomenon.
For the 1951-2010 period, I found a linear function fitted best. Although I just argued that growth should ideally be exponential rather than linear, I think that applies to the economy, but not necessarily to emissions. There have been improvements in the efficiency of fossil-fuel usage and, although there is an undoubted correlation between fossil-fuel use and economic growth, increasing fossil-fuel combustion has not been the only factor driving the economy.
-
scaddenp at 07:18 AM on 12 April 2015Global warming hiatus explained and it's not good news
Lets run some numbers shall we. Specific heat of basalt is 0.84J/gK. Assume is deposited very thinly and so can cool from 2800C to 10C in decades. To get a change of 3E30 in OHC from this basaltic lava cooling we need 3E30*2790/0.84 g of lava. With a basalt density of 3.0, that would translate into an increased volcanic outflow of about 3E11 cubic kilometers of basalt, or around 8E9 cubic kilometers per year, 8E8 Mt pinatuba per year. I think we would have noticed.
-
scaddenp at 06:56 AM on 12 April 2015Global warming hiatus explained and it's not good news
"[El Nino, for example, by itself releases 10 to 20 cu.km of lava near the Eats pacific Rise, let alone that released elsewhere. This is yet to be shown there.]"
Can we have a cite for evidence of this please. Especially change in volcanic output between el nino and la nina?
Also, Ocean heat content has increased by 3E23J since 1970. Entirely consistant with CO2 increase. Most of this heat accumulation in top 700m with gradual warming in top 2000m, nothing much happening in depth (where you claim the heat is coming from). Furthermore the spatial distribution of this heat accummulation is in no way correlated volcanic ridges. Heat transfer between ocean and atmosphere is also entirely consistant with El nino warming.
-
Tom Dayton at 03:27 AM on 12 April 2015Models are unreliable
Rhoowl claimed "the cmip5 models produce a wide range of results with a large error. the models are off what real world temperatures indicate. just looking cmip5 ar4 model graphs compare to real world temperature it appears that the models are more than two standard deviations off."
Multiple people have explained to you that your particular interpretation of the model results as "error" is incorrect. It appears that you continue to refuse to read explanations of what the model results actually are, and what the models actually are. To start with, you absolutely must read the Intermediate version of this "How Reliable Are Climate Models?" post. When a bunch of people on SkS tell you that you don't understand something, it is your responsibility to make at least the effort to read all of the original post on which you are commenting; some posts have Basic, Intermediate, and Advanced tabbed panes. If you don't trust what those blog posts say, I applaud you for your skepticism as long as you then read the peer reviewed original publications that those posts cite.
One source of variability in GCMs' results is differences in the models' constructions, not just their parameters. The CMIP5 ensemble of models is just that--multiple models, created by multiple people using different approaches. Those differences in models' constructions are not weaknesses! They are intentional--think of them as replications of experimental setups. Robust "replication" does not mean just rerunning an experiment with exactly the same setup. Instead it means running an experiment differently as long as, in principle, the results should be the same. Using differences in experiment construction and running is a test of whether the orginal experiment's results really were due to the posited phenomena or were due to otherwise uninteresting quirks in the experiment. Likewise, having differently constructed climate models safeguards against any one model's results being due to quirks in that particular model.
A good place to start learning about verification & validation (V&V) of climate models is at Steve Easterbrook's blog Serendipity. Steve is a computer scientist and engineer who used to be the chief scientist at NASA's independent V&V center, now is a professor, and does climate research. He has a good recent video of a TED talk (you should read the text surrounding that video on his blog), a short but good description of V&V, and a short description of massive and thorough comparisons of the outputs of 24 climate models. You would benefit from reading other posts of his that you can find by using his blog's Search field to look for "verification" or "validation."
Also useful for you to read is Tamsin Edwards's series of four short blog posts the links to which are near the top of her post Possible Futures.
Of course the bottom line is whether all those different models' results are the same. But "the same" does not mean "exactly the same." There is no absolute definition of "the same." Not 1 in 10,000. Not 2 standard deviations. Not 20%. This is true not just in climatology, but in every field. All models are wrong, but some are useful. For example, if you are trying to discover whether a drug helps an illness, and every experiment testing that shows it does not help, then it doesn't matter that some experiments show it makes no difference and some show it makes the illness worse. For the purpose of those experiments, the unanimous, sensible conclusion is that you should not give that drug to anyone with that illness.
It is necessary to define "the same" climate model results as "similar enough to suit the purpose to which these models' results are being put." But that's a topic for a future comment. First please address, narrowly, what I've written here.
-
Tristan at 02:49 AM on 12 April 2015Models are unreliable
I do not see any climate science credentials. Climate science modelling is a multidisciplinary topic, and as far as I can tell, Dr Hoffman has never published in the field of climate science. He only possesses one piece of the requisite expertise, and presents an opinion on a blog (and hence is not subject to the rigours of peer review and the scrutiny of others in the field).
On the other hand, we have papers like Risbey et al. (2014) that discuss the very topic at hand.
My question to you is this: Why do you eschew the published material on the topic and get your information from sources without the credibility that comes from working in a particular field? -
Rhoowl at 02:22 AM on 12 April 2015Models are unreliable
tristan
here are the credentials of doug l hoffmann..blog originator
http://theresilientearth.com/files/dlhoffman.html
the man is highly qualified to evaluate computer models. you have to understand the the people who are writing and operating the programs for computer models are not climate scientists.
the field requires experts in many areas and not one person can be expert in all of them.
please present an argument addressing the issues cited
Moderator Response:[JH] You are deluding yourself if you believe you know more about Global Climte Models (GCMs) than the commentors who are attempting to educate you on this thread. Please cease making dispariging remarks about their knowledge. If you do not, you will quickly relinquish your privilege of posting on this website.
-
Tristan at 01:49 AM on 12 April 2015Models are unreliable
I was unaware that reading blog posts by people who aren't climate scientists was considered research. Maybe you should read some actual papers.
-
Rhoowl at 01:03 AM on 12 April 2015Models are unreliable
I'm sorry about getting off topic..you're correct...however...i'm not the only one who is doing this for the responses. btw..you only win the argument if you convince the other person that they are wrong.
anyhow...after doing some more research...i ran into the article...
http://theresilientearth.com/?q=content/climate-models-%E2%80%9Cbasic-physics%E2%80%9D-falls-short-real-science
this is another view that is along the lines of what i have been exactly saying. my experience in modeling agrees with everything that is said in the article. and scientist need to explain why what is being said in this article is not correct. it didn't even touch on the dreaded (actually a serious problem) divide by 0 which is all to common in computerization of real world models.
the cmip5 models produce a wide range of results with a large error. the models are off what real world temperatures indicate. just looking cmip5 ar4 model graphs compare to real world temperature it appears that the models are more than two standard deviations off. I wanted to calculate this...but I was unable to find the necessary data to do so. if someone knows how to get this data or and some analysis of this i would very much like to review this.
if it is more than 2 standard deviations off this means that the math is questionable or the theory is questionable.
if the models produced a nice error i think 20% is acceptable..and the real world temperatures were following this within 2 standard deviations then this would significantly increase your confidence level. as things stand right now i do not have any confidence that the models results are accurate or properly represent the theory or math.
Moderator Response:[Rob P] - Climate models show remarkable agreement with recent surface warming once natural variability and unanticipated changes in external forcings (such as increased volcanic sulfate aerosols) are taken into account.
-
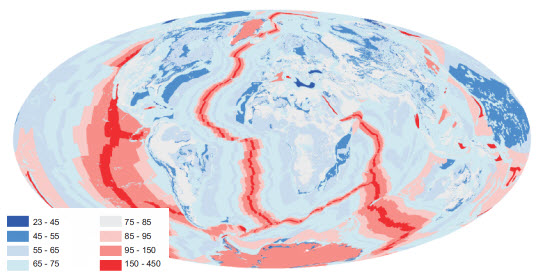
Tom Curtis at 19:14 PM on 11 April 2015Global warming hiatus explained and it's not good news
Peter Carson @11:
1) The map I showed includes heat loss from young sub-ocean crust and sub-ocean hotspots, and ergo includes heat loss from the associated volcanism.
2) grindupBaker's calculation included 1000 K for temperature loss, not for the the initial temperature. Given that the abysal temperature is around 280 K, that means he was assuming magma temperatures 1280 K, so that adjusting for your increased temperature estimates makes little difference to the result. On the upper bound, it only increases the value by 25%, and 125% of effectively zilch is still effectively zilch.
3) Of more concern is that he included only lava volume, not total magma volume which is about 10 times greater (see link below, or the page he linked to). Adjusting for that brings the estimate up to 0.07 zettajoules (for your upper bound temperature). That compares to the 1.14 zettajoules per annum for young ocean crust (from the first link). Ergo even if direct volcanism were not included in that estimate, it would only increase the heat flow estimates in mid ocean ridges by 6%. Well within error and ergo inconsequential.
4) More troubling, El Nino is not a volcanic event of any description, and ergo cannot have an associated lava flow. It certainly cannot have an associated lava flow equal to approximately half of the global magma deposition (subarial and subocean). Further, unlike your made up figure, actually observed figures for volcanic extrusion in the Galapagos rise put it at around 0.002–0.13 km^3 per annum. As with your false, and unjustified claim about what has or has not been included in GCMs, your made up claims continue to embarass you (or would if you had any shame).
5) I went to your poorly organized site, and was unable to find any links to relevant calculations. I did, however, find that you claim that changes in CO2 level can have not effect on the global heat budget because "CO2 is saturated". In terms of scientific knowledge and reasoning, that would put you below average at an anual meeting of the flat earth society. Therefore I see no point in extending this conversation.
Moderator Response:[TD] Peter Carson, see the SkS post "Is the CO2 Effect Saturated?" After you read the Basic tabbed pane, read the Intermediate and then the Advanced tabbed panes.
-
Tristan at 18:33 PM on 11 April 2015Global warming hiatus explained and it's not good news
Oh man, popcorn time.
I love it when someone decides they've figured it all out but no one will publish them because gatekeepers, so they come to Sks (kudos, Peter, brave of you) and proceed to explain what those silly climate scientists missed. To actual climate scientists.
-
Peter Carson at 18:15 PM on 11 April 2015Global warming hiatus explained and it's not good news
grindupBaker & Tom Curtis. [BTW Basalt lava is typically 1400K to 1600K, rather more than your 1000K or even C.]
I’m well aware of the diagrams of global heat presented. However, they show only the estimated average heat released during quiescence, ie no eruptions when most heat is released. The diagram severely underestimates volcanic heat released.
Yes, I’ve done some calculations, some shown on my site pjcarson2015.wordpress.com
You will also see what causes the larger cyclones, etc.
[El Nino, for example, by itself releases 10 to 20 cu.km of lava near the Eats pacific Rise, let alone that released elsewhere. This is yet to be shown there.]
Try working it out yourself, then give a calm response.
Hint: rate of divergence x height x length of all divergent plates. Convergent plates give an extra ¼. That’s a lot more than the estimate of 3 cu.km to which you are referring.
-
grindupBaker at 16:56 PM on 11 April 2015Global warming hiatus explained and it's not good news
I forgot to format my spreadsheet for posting, especially column headings but really what does it matter when responding to such thoughtless empty anecdote as that at #6.
-
grindupBaker at 16:53 PM on 11 April 2015Global warming hiatus explained and it's not good news
@Peter Carson:
3,000,000,000 m**3 / year total annual volcanic lava flow (http://volcano.oregonstate.edu/book/export/html/138)
from an estimated "more than a million submarine (underwater) volcanoes"
"The lava is basalt. Hawaiian basalts contain about 50% silica, 10% each of iron, magnesium, calcium, about 15% aluminum" from some place I've forgotten.
1000 Kelvin lava temperature dropannual lava volume density annual lava mass thermal capacity annual heating
m**3 kg/m**3 kg J/kg.K Zettajoules
50% Silica 1,500,000,000 2,648 3,972,000,000,000 710 0.00282
15% Al 450,000,000 2,700 1,215,000,000,000 910 0.00111
10% Ca 300,000,000 1,550 465,000,000,000 630 0.00029
10% Fe 300,000,000 7,874 2,362,200,000,000 450 0.00106
10% Mg 300,000,000 1,740 522,000,000,000 1050 0.00055
5% traces 150,000,000 3,302 495,360,000,000 750 0.00037
100% Total 0.00583I compute that a total of ~0.00583 Zettajoules / year heat is added into the deep oceans at the sea bed by the annual 3 cubic kilometers of volcanic lava flow at an assumed average temperature of 1,000 degrees.
Current analysis is that 13.7 Zettajoules / year heat is added into the oceans from the surface down by the residual radiative imbalance
Thus, surface-down heat added = 2,350 times as much as volcano heat.Also, just to hammer on the utter silliness of this "volcano heat" nonsense, note that the estimate of all geothermal heat is 0.085 w/m**2 (though not known very precisely) which is 1.37 Zettajoules / year. Thus, regular dull geothermal heat seeping up through the land surface and the sea bed is 1.37 / 0.00583 = 235 times as much as volcano heat. I expect that modellers would include this minor but not trivial heat, perhaps somebody else would confirm. The "volcano heat" nonsense is, quite frankly, extremely ignorant and it is beyond lazy not to at least attempt a 1st-order perhaps flawed approximation of the reference quantity for discussion as I have done. It is sadly indicative of a certain group of people that they vastly prefer anecdote and hyperbole to some attempt at analysis.
Moderator Response:[Rob P] See also this SkS rebuttal by Andy Skuce - Heat from the Earth’s interior does not control climate.

-
Tom Curtis at 16:37 PM on 11 April 2015Global warming hiatus explained and it's not good news
Peter Carson @6, if it were true that the effects of under sea volcanism "has never been included in climate or weather models", then logically you could not know that their inclusion "would seem to be the solution to a number of problems". In fact, you are only guessing, and probably guessing on poor information, that that is the case.
What is known about under sea volcanoes is that nearly all of them are found along mid-ocean ridges where eruptions are small scale and more or less continuous. They are, therefore, unlikely to have changed their effect (whatever it is) over the last century or two.
We also know that even over those ridges, the warming effect is less than (typically much less than) the TOA energy imbalance so that changes in that warming effect are likely to be very small relative to that imbalance. We also know that the water column makes an excellent insulator so that any such changes will have minimal impact on surface temperatures.
Finally, it is in fact not true that sub-ocean geothermal heat has never been included in GCMs. In fact such studies have shown that inclusion of sub-ocean geothermal energy increases the motion of abyssal currents, thereby better modelling the distrubution of C14 in the oceans. It is, however, not the only candidate in that role. Nor, I suspect, is the distribution of C14 in the ocean the type of "problem" (I suspect) you had in mind.
-
grindupBaker at 15:03 PM on 11 April 2015Global warming hiatus explained and it's not good news
The statement "...increase in the strength of trade winds...in the Pacific Ocean had pushed warmer surface waters deeper, having an overall cooling effect on global surface temperatures" in posting, which is the phrasing that I see universally, is incorrect as I understand it. Not quite the converse, but it's tangential. The actual reason is that cooler, deeper water is brought to the surface by the trade winds, not that warm water is being pushed into the western Pacific Ocean. Cooler Pacific Ocean surface water (except that western portion) lowers GMST by two means (1) reducing the average temperature proportional to its surface area (2) reducing the heat quantity that it would otherwise have transferred elsewhere, thus reducing surface/air temperature elsewhere also. I understand that you'all and scientists know that the two events are inextricably linked in Pacific Ocean but it's still illogical to make the leap and directly attribute partial suppression of the GMST anomaly to heat being pushed into ocean. I think it invites disbelief. Again, it's cold water rising, not warm water being pushed below the surface, that reduces GMST anomaly, thus stop saying that GMST did not rise much because heat got pushed into oceans instead.
Moderator Response:[Rob P] - It's a bit of both. This can be seen in the change between El Nino and La Nina years. Note the storage of ocean heat below the surface in La Nina years (2007-2008 & 2010-2011), and the corresponding change in global surface temperature (black line). Image from Roemmich & Gilson (2011).

-
Peter Carson at 14:12 PM on 11 April 2015Global warming hiatus explained and it's not good news
“Volcanic eruptions generally cool the planet's surface.”
True only for terrestrial volcanic activity. There is up to 9x more undersea activity, warming the ocean directly and has no cooling ash; it has never been included in climate or weather models. If included, it would seem to be the solution to a number of problems. After all, if one omits a significant parameter, one will experience problems in matching data to theory.
-
Glenn Tamblyn at 10:57 AM on 11 April 2015The history of emissions and the Great Acceleration
mdenison
Agreed, if one does a simple growth rate calculation for the total emissions rate from Andy's first figure one does get around 2%. However the mix of contributions don't all individually appear exponential. Land use looks linear, coal might be exponential, oil harder to judge.
Equally there is a visible inflection point around the end of WWII, and possibly another around 1910. Was there an underlying growth rate that was suppressed during the Depression/Inter-War years and recovered after the war? Or is the CO2 emission rate a composite of multiple independent factors - population growth rates and changes in that, developments in medicine etc that fed into that, technology changes, economic developments etc.
Just because the cumulative impact of all these factors is roughly exponential, it doesn't follow that there is an underlying single driver of this apparent behaviour. Individual drivers can show 'accelerations'.
-
mdenison at 10:39 AM on 11 April 2015The history of emissions and the Great Acceleration
Although I agree with much of your article I think you overstate an acceleration in CO2 emissions. My own look at the cdiac data show that CO2 emissions from fossil fuels, cement and land use change have grown at about 2% per anum since the mid 19th century. Wars, boom and bust hardly affect this and although different fuels emissions grow at different rates at various times the collective rate always averages out at about 2%. This growth rate can be seen in the atmospheric data from the Law dome and the Keeling curve; also showing CO2 additions growing exponentially at about 2%. Did fossil fuel consumption go nuts? No. I see no great change circa 1950 just the business as usual exponential growth of 2% before and afterwards. It is still about 2% today.
-
Rob Honeycutt at 08:02 AM on 11 April 2015CO2 is not the only driver of climate
Just to simplify a little here...
CO2 is a long-lived, non-condensing greenhouse gas that is well mixed from pole-to-pole and through the full column of the atmosphere.
H2O is a short-lived, condensing greenhouse gas that freezes out at higher latitudes and altitudes.
-
Klapper at 06:02 AM on 11 April 2015Global warming hiatus explained and it's not good news
"This pause is projected to end in the near future as temperatures resume their upward climb."
This comment is the final sentence from from the editorial summary to the Steinman, Mann & Miller 2015 paper in Science. However, it conflicts somewhat with Mann's quote at RealClimate.org from the conclusions of the paper:
"Given the pattern of past historical variation, this trend will likely reverse with internal variability, instead adding to anthropogenic warming in the coming decades."
Which is it: "the near future" or "coming decades"? The answer to that question, which has serious ramifications for global warming policy change, depends on whether you believe the PDO/AMO operate in 60 to 70 cycles or not. If you do, then the answer is likely "coming decades" before the repression of the anthropogenic signal by the NMO is relieved.
Prev 626 627 628 629 630 631 632 633 634 635 636 637 638 639 640 641 Next


